Downloaded 408 times
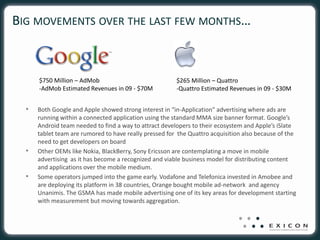

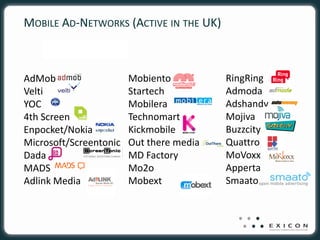
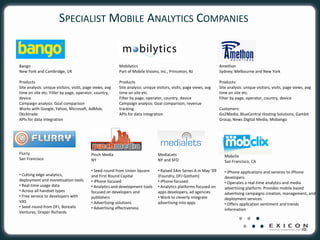
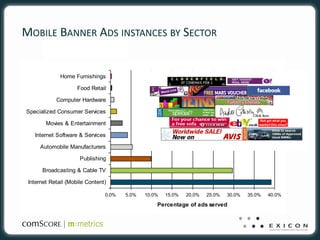
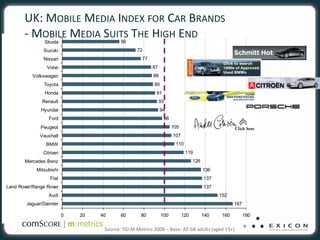
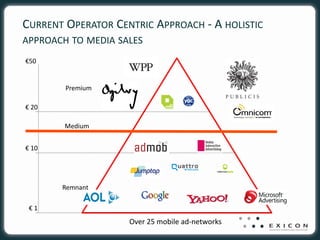

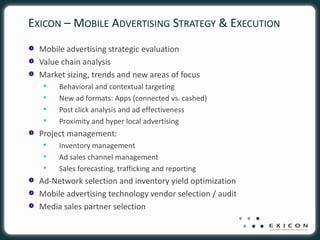

This document discusses recent developments and opportunities in the mobile advertising industry. It notes that Google acquired AdMob for $750 million and Apple acquired Quattro Wireless for $265 million, showing strong interest in in-application mobile advertising. It also discusses the growing size and fragmented forecasts of the mobile advertising market. The document outlines different types of mobile ad networks and opportunities around contextual targeting, new ad formats, and location-based advertising. It proposes services around mobile advertising strategy, sales management, and technology optimization.


