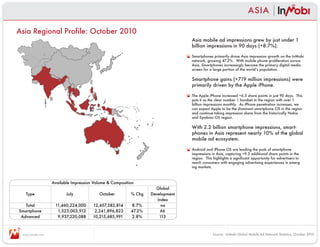
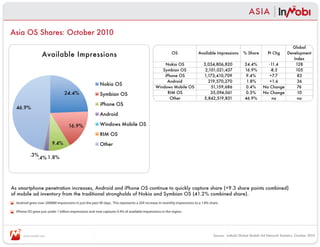
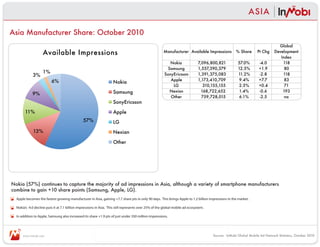
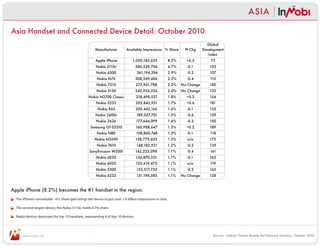
SlideShare a Scribd company logo
1 of 9
Download to read offline
A GLOBAL VIEW OF MOBILE ADVERTISING:
              OCTOBER 2010 REPORT - ASIA PACIFIC MARKET
                                    SECOND RELEASE:  INMOBI NETWORK DATA
                                                Release Date: 6 January, 2011


                                                       The World’s Largest Independent
                                                                   Mobile Ad Network

                     To download the full report, visit us at www.InMobi.com/research 


                         www.inmobi.com             research@inmobi.com
NET WORK DATA

Network Data: Specifications and Representation

Specifications

Data in this report are sourced from our global mobile advertising network which served 24.1 billion impressions in October 2010.
With 102 countries receiving over 10 million impressions in October 2010, we are able to claim one of the broadest and most
representative networks in the world. Exact specifications are as follows:

•        Global Available Impressions in July 2010: 20.3 Billion
•        Global Available Impressions in October 2010: 24.1 Billion
•        Regions Represented: Africa, Asia Pacific, Europe, Middle East, North America, and South America
•        Countries Represented: 102 countries with over 10 million impressions in October 2010
•        Base Measure: Available Impressions
•        Reports: Market Summary, Manufacturer Share, OS Share, and Top Handsets & Connected Devices
•        Time Periods: October 2010 with change versus July 2010

Representation

InMobi is committed to an independent and transparent leadership position in mobile advertising. With that in mind, the following
issues are present in this data.

Mobile Advertising Market Definition: This report covers mobile display advertising only including both WAP and APP. SMS/Text
and Search are NOT included in this synopsis.

Scale and Time In Market: Representation within the network is a function of the both scale and time in market. Readers can
expect more fluctation and variance in younger, smaller markets for the company.

Publisher Mix: As with any ad network, market representation is a function of the publisher mix. We have over 5,000 publishers
of all sizes and content types, but changes to the publisher mix in a given market could impact the data.

Advertiser Mix: Similar to publisher mix, the advertiser mix could impact the numbers in our network, although to a much lesser
extent than publishers.


    www.inmobi.com                                                                       Source: InMobi Global Mobile Ad Network Statistics, October 2010
ASIA

Asia Regional Profile: October 2010
                                                                                Asia mobile ad impressions grew by just under 1 
                                                                                billion impressions in 90 days (+8.7%).

                                                                                Smartphones primarily drove Asia impression growth on the InMobi 
                                                                                network, growing 47.2%.  With mobile phone proliferation across 
                                                                                Asia, Smartphones increasingly become the primary digital media 
                                                                                screen for a large portion of the worldʼs population.

                                                                                Smartphone gains (+719 million impressions) were 
                                                                                primarily driven by the Apple iPhone.

                                                                                The Apple iPhone increased +6.5 share points in just 90 days.  This 
                                                                                puts it as the clear number 1 handset in the region with over 1 
                                                                                billion impressions monthly.  As iPhone penetration increases, we 
                                                                                can expect Apple to be the dominant smartphone OS in the region 
                                                                                and continue taking impression share from the historically Nokia 
                                                                                and Symbian OS region.

                                                                                With 2.2 billion smartphone impressions, smart-
                                                                                phones in Asia represent nearly 10% of the global 
                                                                                mobile ad ecosystem.

                                                                                Android and iPhone OS are leading the push of smartphone 
                                                                                impressions in Asia, capturing +9.3 additional share points in the 
                                                                                region.  This highlights a significant opportunity for advertisers to 
                                                                                reach consumers with engaging advertising experiences in emerg-
                                                                                ing markets.


                  Available Impression Volume & Composition
                                                                   Global 
   Type                  July            October         % Chg   Development 
                                                                    Index
   Total             
                    11,460,224,000      
                                       12,457,582,814    8.7%         na
Smartphone            1,523,003,912      2,241,896,823   47.2%        66
 Advanced             9,937,220,088     
                                       10,215,685,991    2.8%        113


 www.inmobi.com                                                                              Source:  InMobi Global Mobile Ad Network Statistics, October 2010
ASIA

Asia OS Shares: October 2010
                                                                                                                                                                             Global 
                  Available Impressions                                                                 OS              Available Impressions        % Share        Pt Chg Development 
                                                                                                                                                                              Index
                                                                                                 Nokia OS            3,034,806,820                    24.4%        -11.4       128
                                                                                                Symbian OS            2,101,021,437                   16.9%         -8.5       105
                                                                                                 iPhone OS            1,173,410,709                   9.4%         +7.7         83
                                                                                                  Android                219,570,270                   1.8%        +1.6         36
                                                         Nokia OS
                                                                                             Windows Mobile OS             51,159,686                 0.4%       No Change      76
                                 24.4%                   Symbian OS                                RIM OS                  35,094,061                 0.3%       No Change      10
                                                                                                    Other             5,842,519,831                   46.9%          na         na
                                                         iPhone OS
  46.9%
                                                         Android

                                    16.9%                Windows Mobile OS

                                                         RIM OS
                         9.4%                            Other

           .3%
              .4% 1.8%


As smartphone penetration increases, Android and iPhone OS continue to quickly capture share (+9.3 share points combined)
of mobile ad inventory from the traditional strongholds of Nokia and Symbian OS (41.2% combined share).
  Android grew over 200MM impressions in just the past 90 days. This represents a 20X increase in monthly impressions to a 1.8% share.

  iPhone OS grew just under 1 billion impressions and now captures 9.4% of available impressions in the region.


      www.inmobi.com                                                                                                              Source:  InMobi Global Mobile Ad Network Statistics, October 2010
ASIA

Asia Manufacturer Share: October 2010
                                                                                                                                                                                Global 
                    Available Impressions                                                               Manufacturer Available Impressions           % Share       Pt Chg     Development 
                                                                                                                                                                                 Index
                                                                                                           Nokia                    
                                                                                                                                 7,096,800,821        57.0%         -4.0          118
                                                                                                          Samsung                   
                                                                                                                                 1,557,390,379        12.5%         +1.9           80
                    1%                                                                                  SonyEricsson                
                                                                                                                                 1,391,375,083        11.2%         -2.8          118
             3%
                          6%                                                                               Apple                    
                                                                                                                                 1,173,410,709         9.4%         +7.7           83
                                                                     Nokia
                                                                                                            LG                          
                                                                                                                                    310,155,155        2.5%         +0.4           71
                                                                     Samsung                               Nexian                     
                                                                                                                                   168,722,652         1.4%         -0.6          193
             9%
                                                                                                           Other                       
                                                                                                                                   759,728,015         6.1%         -2.5           na
                                                                     SonyEricsson

       11%                                                           Apple
                                                57%                  LG
             13%                                                     Nexian

                                                                     Other


Nokia (57%) continues to capture the majority of ad impressions in Asia, although a variety of smartphone manufacturers
combine to gain +10 share points (Samsung, Apple, LG).
  Apple becomes the fastest growing manufacturer in Asia, gaining +7.7 share pts in only 90 days. This brings Apple to 1.2 billion impressions in the market.

  Nokia’s -4.0 decline puts it at 7.1 billion impressions in Asia. This still represents over 25% of the global mobile ad ecosystem.

  In addition to Apple, Samsung also increased its share +1.9 pts of just under 350 million impressions.


      www.inmobi.com                                                                                                                   Source:  InMobi Global Mobile Ad Network Statistics, October 2010
ASIA

Asia Handset and Connected Device Detail: October 2010
                                                                                                                                 Global 
                                                       Manufacturer          Available Impressions % Share           Pt Chg    Development 
                                                                                                                                  Index
                                                        Apple iPhone                  
                                                                                  1,020,183,633             8.2%     +6.5          73
                                                        Nokia 3110c                     
                                                                                    586,539,706             4.7%      -0.1         153
                                                        Nokia 6300                       
                                                                                     361,196,294            2.9%      -0.2         107
                                                        Nokia N70                       
                                                                                    308,369,606             2.5%      -0.4         115
                                                        Nokia 7210                      
                                                                                    272,961,788             2.2%   No Change       180
                                                        Nokia 5130                      
                                                                                    242,926,226             2.0%   No Change       132
                                                   Nokia N2700 Classic                  
                                                                                     218,498,537            1.8%     +0.3          154
                                                        Nokia 5233                      
                                                                                    205,843,931             1.7%     +0.6          181
                                                         Nokia E63                      
                                                                                    205,442,166             1.6%      -0.1         123
                                                        Nokia 2600c                     
                                                                                     189,057,701            1.5%      -0.6         139
                                                        Nokia 2626                      
                                                                                     177,644,099            1.4%      -0.3         150
                                                    Samsung GT-S3310                    
                                                                                    160,988,647             1.3%     +0.2          189
                                                        Nokia N80                       
                                                                                     158,860,748            1.3%      -0.1         118
                                                       Nokia N2690                      
                                                                                    158,779,653             1.3%      n/a          175
                                                        Nokia 7610                      
                                                                                     148,182,921            1.2%      -0.2        139
                                                   SonyEricsson W200i                   
                                                                                    142,223,098             1.1%      -0.4         161
                                                        Nokia 6030                      
                                                                                    136,870,251             1.1%      -0.1        163
                                                        Nokia 6020                      
                                                                                    135,419,475             1.1%      n/a          119
                                                        Nokia 5300                       
                                                                                     132,517,733            1.1%      -0.2        162
                                                        Nokia 6233                       
                                                                                     131,198,583            1.1%   No Change      128


Apple iPhone (8.2%) becomes the #1 handset in the region.  
  The iPhone’s remarkable +6.5 share gain brings the device to just over 1.0 billion impressions in Asia.

  The second largest device, the Nokia 3110c, holds 4.7% share.

  Nokia devices dominate the top 10 handsets, representing 9 of top 10 devices.


      www.inmobi.com                                                                                                                Source:  InMobi Global Mobile Ad Network Statistics, October 2010
ASIA

Asia Regional Summary:  October 2010 
                      Available Impression Volume & Composition                                                       Top 3 OS Systems:  % Share Available Impressions
                                                                                 Global                                                                                                Global 
     Type                    July               October            % Chg       Development                                           July              October           Pt. Chg     Development 
                                                                                  Index                                                                                                 Index
    Total                
                        11,460,224,000        
                                             12,457,582,814        8.7%             na                  Nokia OS                 35.8%                  24.4%              -11.4         128
 Smartphone               1,523,003,912        2,241,896,823       47.2%            66                 Symbian OS                25.4%                  16.9%               -8.5         105
  Advanced                9,937,220,088       
                                             10,215,685,991        2.8%            113                  iPhone OS                1.7%                   9.4%               +7.7           83

                Top 5 Manufacturers:  % Share Available Impressions                                                       Top 10 Handsets: % Share Available Impressions
                                                                                 Global                                                                                            Global 
                             July               October           Pt. Chg      Development                                           July              October          Pt. Chg  Development 
                                                                                  Index                                                                                             Index
    Nokia                  61.0%                 57.0%              -4.0           118               Apple iPhone                    1.7%                8.2%            +6.5         73
   Samsung                 10.6%                 12.5%              +1.9            80               Nokia 3110c                     4.8%                4.7%             -0.1       153
 SonyEricsson              14.0%                 11.2%              -2.8           118                Nokia 6300                     3.1%                2.9%             -0.2       107
    Apple                   1.7%                 9.4%               +7.7            83                Nokia N70                      2.9%                2.5%             -0.4       115
     LG                     2.1%                 2.5%               +0.4            71                Nokia 7210                     2.2%                2.2%          No Change     180
                                                                                                      Nokia 5130                     2.0%                2.0%          No Change     132
                                                                                                  Nokia N2700 Classic                1.5%                1.8%            +0.3        154
                                                                                                      Nokia 5233                     1.1%                1.7%            +0.6        181
                                                                                                      Nokia E63                      1.7%                1.6%             -0.1       123
                                                                                                     Nokia 2600c                     2.1%                1.5%             -0.6       139


Asia mobile impression growth (+8.7%) is driven by 47% increase in smartphone inventory.
  Nokia still commands the majority of impressions in the region (57%) although Apple is growing very quickly (+7.7 share points).

  Apple iPhone becomes the #1 handset in the region with 8.2% share.

  Nokia and Symbian operating systems continue to lose share to iPhone OS and Android (+9.3 share points combined).


     www.inmobi.com                                                                                                                  Source:  InMobi Global Mobile Ad Network Statistics, October 2010
NEXT STEPS


These data are the second of a series of network reports that are released quarterly.
Additional regions and markets will be released throughout the quarter.

Release Schedule
Network data will be released at least once per quarter with the potential to increase frequency. The next planned release is
January 2011 data around February 28th, 2011.

Open Source Research: Getting Involved
Objective industry analysts and thought-leaders are encouraged to comment, question, and participate. We will be sure to consider
and update the research based on feedback and questions to improve the quality for all end users.


To participate, contact us at Research@inMobi.com.

To download the full reports, visit us at www.InMobi.com/research


    www.inmobi.com                                                                        Source: InMobi Global Mobile Ad Network Statistics, October 2010
MEASURES AND TERM DEFINITIONS
InMobi Global Research: Measures and Term Definitions
Measures:
Available Impressions: The total number of ad requests made to the InMobi network. Note this is the base measure for all analysis in this report given its
representation of mobile advertising activity.
% Share (of Available Impressions): The % of total available impressions in the specified region allocated to the inventory type, device, manufacturer, or OS
under analysis.
Global Development Index: An index of the % share of the inventory type, device, manufacturer, or OS under analysis in the specified region or country
relative to that same inventory type, device, manufacturer, or OS share globally. (For example, iPhone OS Share in Europe is 22.9% while globally its
8.2%. Indexing 22.9% to 8.2% gives us our EU Global Development Index of 279.)
Regional Development Index: An index of the % share of the inventory type, device, manufacturer, or OS under analysis in the specified country relative to
that same inventory type, device, manufacturer, or OS share in the relevant region.
% Chg: The percentage change in absolute value between two different time periods.
Pt Chg: The difference between two share percentages for an inventory type, device, manufacturer, or OS under analysis in different time periods.


Definitions:
Smartphone: Any phone with an iPhone OS, Android OS, RIM OS, webOS, Windows Mobile OS, Linux Smartphone OS, Palm OS, Nokia N & E Series
Phones, or Samsung Bada.
Advanced: Any phone with an OS or handset NOT included in the smart phone definition above. Note that feature phones are not capable of receiving
mobile display ads and
WAP (Wireless Application Protocol): Any impression served using Wireless Application Protocol (WAP) which is an open international standard for
application-layer network communications in a wireless-communication environment.
App (Application): Any impressions served to a Mobile application resident on the consumer mobile device.
OS (Operating System): The system software (programs and data) running on the mobile devices that manages the hardware and provides common
services for execution of various application software receiving the impression.
Handsets and Connected Device: The make and model of the mobile device receiving the impression.
Manufacturer: The manufacturer of the mobile device receiving the impression.
Other: An aggregation of any remaining impressions not specifically detailed previously.

InMobi Regional Definitions:
InMobi defines all regions per Wikipedia with the following modifications:
“Asia Pacific” excludes China and Japan and includes all remaining Asian countries plus the 15 Oceania countries as listed in Wikipedia.

Contact Information:
Readers are encouraged to contact us and/or follow us on www.Twitter.com/InMobi, Facebook by searching “InMobi” and looking for our logo, or follow
our company blog at www.inMobi.com/blog. You can also hear from us directly by contacting us at Research@InMobi.com.


   www.inmobi.com                                                                                          Source: InMobi Global Mobile Ad Network Statistics, October 2010

More Related Content

What's hot

A GLOBAL VIEW OF MOBILE ADVERTISING 2011
A GLOBAL VIEW OF MOBILE ADVERTISING 2011A GLOBAL VIEW OF MOBILE ADVERTISING 2011
A GLOBAL VIEW OF MOBILE ADVERTISING 2011Victoria Alexis
 
India now the largest mobile advertising market in Asia Pacific
India now the largest mobile advertising market in Asia PacificIndia now the largest mobile advertising market in Asia Pacific
India now the largest mobile advertising market in Asia PacificInMobi
 
Q3 2011 - Central/South America Report
Q3 2011 - Central/South America ReportQ3 2011 - Central/South America Report
Q3 2011 - Central/South America ReportInMobi
 
Q2 2011 – Global + Regional Report with Country Detail
Q2 2011 – Global + Regional Report with Country DetailQ2 2011 – Global + Regional Report with Country Detail
Q2 2011 – Global + Regional Report with Country DetailInMobi
 
QE July 2011 - Global Report
QE July 2011 - Global ReportQE July 2011 - Global Report
QE July 2011 - Global ReportInMobi
 
QE July 2011 - Europe Report
QE July 2011 - Europe ReportQE July 2011 - Europe Report
QE July 2011 - Europe ReportInMobi
 
MOBILE WORLD CONGRESS - DEVELOPERS AS INNOVATORS
MOBILE WORLD CONGRESS - DEVELOPERS AS INNOVATORS MOBILE WORLD CONGRESS - DEVELOPERS AS INNOVATORS
MOBILE WORLD CONGRESS - DEVELOPERS AS INNOVATORS InMobi
 
QE July 2011 - North America Region Report
QE July 2011 - North America Region ReportQE July 2011 - North America Region Report
QE July 2011 - North America Region ReportInMobi
 
Q3 2011 - North America Report
Q3 2011 - North America ReportQ3 2011 - North America Report
Q3 2011 - North America ReportInMobi
 
InMobi ad:tech London 21st September 2010
InMobi ad:tech London 21st September 2010InMobi ad:tech London 21st September 2010
InMobi ad:tech London 21st September 2010InMobi
 
Q3 2011 - APAC Report
Q3 2011 - APAC ReportQ3 2011 - APAC Report
Q3 2011 - APAC ReportInMobi
 
Q3 2011 - Africa Report
Q3 2011 - Africa ReportQ3 2011 - Africa Report
Q3 2011 - Africa ReportInMobi
 
InMobi iOSDevCamp 2011
InMobi iOSDevCamp 2011InMobi iOSDevCamp 2011
InMobi iOSDevCamp 2011InMobi
 
Q2 2011 - Europe Report
Q2 2011 - Europe ReportQ2 2011 - Europe Report
Q2 2011 - Europe ReportInMobi
 
Building Brand Awareness Through Real-world Gamification
Building Brand Awareness Through Real-world GamificationBuilding Brand Awareness Through Real-world Gamification
Building Brand Awareness Through Real-world GamificationInMobi
 
What Savvy Brand Marketers Must Know About Mobile
What Savvy Brand Marketers Must Know About MobileWhat Savvy Brand Marketers Must Know About Mobile
What Savvy Brand Marketers Must Know About MobileInMobi
 
Multi-Screening: The Who, What, and When for Marketers 6-12-13 10am IST
Multi-Screening: The Who, What, and When for Marketers 6-12-13 10am ISTMulti-Screening: The Who, What, and When for Marketers 6-12-13 10am IST
Multi-Screening: The Who, What, and When for Marketers 6-12-13 10am ISTInMobi
 
China Mobile Application Store - Connected Life Experiences on the Move
China Mobile Application Store - Connected Life Experiences on the MoveChina Mobile Application Store - Connected Life Experiences on the Move
China Mobile Application Store - Connected Life Experiences on the MoveCisco Service Provider
 
Mobile Advertising Mar 10
Mobile Advertising Mar 10Mobile Advertising Mar 10
Mobile Advertising Mar 10Exicon
 
State Of The Industry_Apps
State Of The Industry_AppsState Of The Industry_Apps
State Of The Industry_AppsQuattro Wireless
 

What's hot (20)

A GLOBAL VIEW OF MOBILE ADVERTISING 2011
A GLOBAL VIEW OF MOBILE ADVERTISING 2011A GLOBAL VIEW OF MOBILE ADVERTISING 2011
A GLOBAL VIEW OF MOBILE ADVERTISING 2011
 
India now the largest mobile advertising market in Asia Pacific
India now the largest mobile advertising market in Asia PacificIndia now the largest mobile advertising market in Asia Pacific
India now the largest mobile advertising market in Asia Pacific
 
Q3 2011 - Central/South America Report
Q3 2011 - Central/South America ReportQ3 2011 - Central/South America Report
Q3 2011 - Central/South America Report
 
Q2 2011 – Global + Regional Report with Country Detail
Q2 2011 – Global + Regional Report with Country DetailQ2 2011 – Global + Regional Report with Country Detail
Q2 2011 – Global + Regional Report with Country Detail
 
QE July 2011 - Global Report
QE July 2011 - Global ReportQE July 2011 - Global Report
QE July 2011 - Global Report
 
QE July 2011 - Europe Report
QE July 2011 - Europe ReportQE July 2011 - Europe Report
QE July 2011 - Europe Report
 
MOBILE WORLD CONGRESS - DEVELOPERS AS INNOVATORS
MOBILE WORLD CONGRESS - DEVELOPERS AS INNOVATORS MOBILE WORLD CONGRESS - DEVELOPERS AS INNOVATORS
MOBILE WORLD CONGRESS - DEVELOPERS AS INNOVATORS
 
QE July 2011 - North America Region Report
QE July 2011 - North America Region ReportQE July 2011 - North America Region Report
QE July 2011 - North America Region Report
 
Q3 2011 - North America Report
Q3 2011 - North America ReportQ3 2011 - North America Report
Q3 2011 - North America Report
 
InMobi ad:tech London 21st September 2010
InMobi ad:tech London 21st September 2010InMobi ad:tech London 21st September 2010
InMobi ad:tech London 21st September 2010
 
Q3 2011 - APAC Report
Q3 2011 - APAC ReportQ3 2011 - APAC Report
Q3 2011 - APAC Report
 
Q3 2011 - Africa Report
Q3 2011 - Africa ReportQ3 2011 - Africa Report
Q3 2011 - Africa Report
 
InMobi iOSDevCamp 2011
InMobi iOSDevCamp 2011InMobi iOSDevCamp 2011
InMobi iOSDevCamp 2011
 
Q2 2011 - Europe Report
Q2 2011 - Europe ReportQ2 2011 - Europe Report
Q2 2011 - Europe Report
 
Building Brand Awareness Through Real-world Gamification
Building Brand Awareness Through Real-world GamificationBuilding Brand Awareness Through Real-world Gamification
Building Brand Awareness Through Real-world Gamification
 
What Savvy Brand Marketers Must Know About Mobile
What Savvy Brand Marketers Must Know About MobileWhat Savvy Brand Marketers Must Know About Mobile
What Savvy Brand Marketers Must Know About Mobile
 
Multi-Screening: The Who, What, and When for Marketers 6-12-13 10am IST
Multi-Screening: The Who, What, and When for Marketers 6-12-13 10am ISTMulti-Screening: The Who, What, and When for Marketers 6-12-13 10am IST
Multi-Screening: The Who, What, and When for Marketers 6-12-13 10am IST
 
China Mobile Application Store - Connected Life Experiences on the Move
China Mobile Application Store - Connected Life Experiences on the MoveChina Mobile Application Store - Connected Life Experiences on the Move
China Mobile Application Store - Connected Life Experiences on the Move
 
Mobile Advertising Mar 10
Mobile Advertising Mar 10Mobile Advertising Mar 10
Mobile Advertising Mar 10
 
State Of The Industry_Apps
State Of The Industry_AppsState Of The Industry_Apps
State Of The Industry_Apps
 

Similar to Latest InMobi research finds smartphones impression growth outpacing advanced phones 3 to 1

InMobi Network Research Africa Q3 2011
InMobi Network Research Africa Q3 2011InMobi Network Research Africa Q3 2011
InMobi Network Research Africa Q3 2011Joel Rao
 
FabriQate - Mobile Scene in China
FabriQate - Mobile Scene in ChinaFabriQate - Mobile Scene in China
FabriQate - Mobile Scene in ChinaFabriQate
 
Korea Feb12 Media Kit
Korea Feb12 Media KitKorea Feb12 Media Kit
Korea Feb12 Media KitBrandonJung
 
Zoomy media international proposal
Zoomy media international proposalZoomy media international proposal
Zoomy media international proposal静 陆
 
Mobile apps and internet
Mobile apps and internetMobile apps and internet
Mobile apps and internetITDogadjaji.com
 
Mobile Applications
Mobile ApplicationsMobile Applications
Mobile ApplicationsShweta Jain
 
The App Frenzy Just A Short Lived Fad (2)
The App Frenzy   Just A Short Lived Fad (2)The App Frenzy   Just A Short Lived Fad (2)
The App Frenzy Just A Short Lived Fad (2)Laurent Viviez
 
MobilityCMS
MobilityCMSMobilityCMS
MobilityCMS7thMedia
 
Opera Mediaworks State of Mobile Advertising Q1 2013
Opera Mediaworks State of Mobile Advertising Q1 2013Opera Mediaworks State of Mobile Advertising Q1 2013
Opera Mediaworks State of Mobile Advertising Q1 2013Falguni Bhuta
 
Mobile Marketing- Indias Golden Goose
Mobile Marketing- Indias Golden GooseMobile Marketing- Indias Golden Goose
Mobile Marketing- Indias Golden GooseJeetendra Lalwani
 
Rossel mobile internet experience_20101126
Rossel mobile internet experience_20101126Rossel mobile internet experience_20101126
Rossel mobile internet experience_20101126Martins Frédéric
 
VisionMobile - The mobile market in 2011: new facts & old myths
VisionMobile - The mobile market in 2011: new facts & old myths VisionMobile - The mobile market in 2011: new facts & old myths
VisionMobile - The mobile market in 2011: new facts & old myths SlashData
 
Now and the future mobile marketing in china
Now and the future mobile marketing in chinaNow and the future mobile marketing in china
Now and the future mobile marketing in chinaMadhouse Inc.
 
Appsnack @ AdTech New Delhi - The 3Rs of Mobile Marketing in India
Appsnack @ AdTech New Delhi - The 3Rs of Mobile Marketing in IndiaAppsnack @ AdTech New Delhi - The 3Rs of Mobile Marketing in India
Appsnack @ AdTech New Delhi - The 3Rs of Mobile Marketing in IndiaExponential Interactive
 
Sitecore mobile whitepaperManaging the Mobile Rush: Smart Strategies for Mult...
Sitecore mobile whitepaperManaging the Mobile Rush: Smart Strategies for Mult...Sitecore mobile whitepaperManaging the Mobile Rush: Smart Strategies for Mult...
Sitecore mobile whitepaperManaging the Mobile Rush: Smart Strategies for Mult...LocalDirectgov
 
Managing the Mobile Rush: Smart Strategies for Multi‐channel Publishing
Managing the Mobile Rush: Smart Strategies for Multi‐channel PublishingManaging the Mobile Rush: Smart Strategies for Multi‐channel Publishing
Managing the Mobile Rush: Smart Strategies for Multi‐channel PublishingLocalDirectgov
 
10+1 myths about the mobile economy
10+1 myths about the mobile economy10+1 myths about the mobile economy
10+1 myths about the mobile economySlashData
 

Similar to Latest InMobi research finds smartphones impression growth outpacing advanced phones 3 to 1 (20)

InMobi Network Research Africa Q3 2011
InMobi Network Research Africa Q3 2011InMobi Network Research Africa Q3 2011
InMobi Network Research Africa Q3 2011
 
FabriQate - Mobile Scene in China
FabriQate - Mobile Scene in ChinaFabriQate - Mobile Scene in China
FabriQate - Mobile Scene in China
 
Korea Feb12 Media Kit
Korea Feb12 Media KitKorea Feb12 Media Kit
Korea Feb12 Media Kit
 
Zoomy media international proposal
Zoomy media international proposalZoomy media international proposal
Zoomy media international proposal
 
Mobile apps and internet
Mobile apps and internetMobile apps and internet
Mobile apps and internet
 
Tech Weekly 010711
Tech Weekly 010711Tech Weekly 010711
Tech Weekly 010711
 
Mobile Applications
Mobile ApplicationsMobile Applications
Mobile Applications
 
The App Frenzy Just A Short Lived Fad (2)
The App Frenzy   Just A Short Lived Fad (2)The App Frenzy   Just A Short Lived Fad (2)
The App Frenzy Just A Short Lived Fad (2)
 
MobilityCMS
MobilityCMSMobilityCMS
MobilityCMS
 
Opera Mediaworks State of Mobile Advertising Q1 2013
Opera Mediaworks State of Mobile Advertising Q1 2013Opera Mediaworks State of Mobile Advertising Q1 2013
Opera Mediaworks State of Mobile Advertising Q1 2013
 
Mobile Marketing- Indias Golden Goose
Mobile Marketing- Indias Golden GooseMobile Marketing- Indias Golden Goose
Mobile Marketing- Indias Golden Goose
 
Rossel mobile internet experience_20101126
Rossel mobile internet experience_20101126Rossel mobile internet experience_20101126
Rossel mobile internet experience_20101126
 
VisionMobile - The mobile market in 2011: new facts & old myths
VisionMobile - The mobile market in 2011: new facts & old myths VisionMobile - The mobile market in 2011: new facts & old myths
VisionMobile - The mobile market in 2011: new facts & old myths
 
Now and the future mobile marketing in china
Now and the future mobile marketing in chinaNow and the future mobile marketing in china
Now and the future mobile marketing in china
 
Appsnack @ AdTech New Delhi - The 3Rs of Mobile Marketing in India
Appsnack @ AdTech New Delhi - The 3Rs of Mobile Marketing in IndiaAppsnack @ AdTech New Delhi - The 3Rs of Mobile Marketing in India
Appsnack @ AdTech New Delhi - The 3Rs of Mobile Marketing in India
 
Smartphone app market monitor r2g
Smartphone app market monitor r2gSmartphone app market monitor r2g
Smartphone app market monitor r2g
 
Sitecore mobile whitepaperManaging the Mobile Rush: Smart Strategies for Mult...
Sitecore mobile whitepaperManaging the Mobile Rush: Smart Strategies for Mult...Sitecore mobile whitepaperManaging the Mobile Rush: Smart Strategies for Mult...
Sitecore mobile whitepaperManaging the Mobile Rush: Smart Strategies for Mult...
 
Managing the Mobile Rush: Smart Strategies for Multi‐channel Publishing
Managing the Mobile Rush: Smart Strategies for Multi‐channel PublishingManaging the Mobile Rush: Smart Strategies for Multi‐channel Publishing
Managing the Mobile Rush: Smart Strategies for Multi‐channel Publishing
 
10+1 myths about the mobile economy
10+1 myths about the mobile economy10+1 myths about the mobile economy
10+1 myths about the mobile economy
 
iFront 2010 prezentacija na Jure Sustersic
iFront 2010 prezentacija na Jure SustersiciFront 2010 prezentacija na Jure Sustersic
iFront 2010 prezentacija na Jure Sustersic
 

More from InMobi

Responding to Coronavirus: How marketers can leverage digital responsibly
Responding to Coronavirus: How marketers can leverage digital responsiblyResponding to Coronavirus: How marketers can leverage digital responsibly
Responding to Coronavirus: How marketers can leverage digital responsiblyInMobi
 
2020: Celebrating the Era of the Connected Consumer
2020: Celebrating the Era of the Connected Consumer2020: Celebrating the Era of the Connected Consumer
2020: Celebrating the Era of the Connected ConsumerInMobi
 
Winning the Indian Festive Shopper in 2019
Winning the Indian Festive Shopper in 2019Winning the Indian Festive Shopper in 2019
Winning the Indian Festive Shopper in 2019InMobi
 
The Changing Face of the Indian Mobile User
The Changing Face of the Indian Mobile UserThe Changing Face of the Indian Mobile User
The Changing Face of the Indian Mobile UserInMobi
 
Unlocking the True Potential of Data on Mobile
Unlocking the True Potential of Data on MobileUnlocking the True Potential of Data on Mobile
Unlocking the True Potential of Data on MobileInMobi
 
InMobi State of Mobile Video Advertising Report 2018
InMobi State of Mobile Video Advertising Report 2018InMobi State of Mobile Video Advertising Report 2018
InMobi State of Mobile Video Advertising Report 2018InMobi
 
Neural Field aware Factorization Machine
Neural Field aware Factorization MachineNeural Field aware Factorization Machine
Neural Field aware Factorization MachineInMobi
 
The Essential Mediation Toolkit - Korean
The Essential Mediation Toolkit - KoreanThe Essential Mediation Toolkit - Korean
The Essential Mediation Toolkit - KoreanInMobi
 
A Comprehensive Guide for App Marketers
A Comprehensive Guide for App MarketersA Comprehensive Guide for App Marketers
A Comprehensive Guide for App MarketersInMobi
 
A Cure for Ad-Fraud: Turning Fraud Detection into Fraud Prevention
A Cure for Ad-Fraud: Turning Fraud Detection into Fraud PreventionA Cure for Ad-Fraud: Turning Fraud Detection into Fraud Prevention
A Cure for Ad-Fraud: Turning Fraud Detection into Fraud PreventionInMobi
 
[Webinar] driving accountability in mobile advertising
[Webinar] driving accountability in mobile advertising[Webinar] driving accountability in mobile advertising
[Webinar] driving accountability in mobile advertisingInMobi
 
The Brand Marketer's Guide to Mobile Video Viewability
The Brand Marketer's Guide to Mobile Video ViewabilityThe Brand Marketer's Guide to Mobile Video Viewability
The Brand Marketer's Guide to Mobile Video ViewabilityInMobi
 
Top 2017 Mobile Advertising Trends in Indonesia
Top 2017 Mobile Advertising Trends in IndonesiaTop 2017 Mobile Advertising Trends in Indonesia
Top 2017 Mobile Advertising Trends in IndonesiaInMobi
 
Mobile marketing strategy guide
Mobile marketing strategy guide Mobile marketing strategy guide
Mobile marketing strategy guide InMobi
 
InMobi Yearbook 2016
InMobi Yearbook 2016InMobi Yearbook 2016
InMobi Yearbook 2016InMobi
 
Boost Retention on Mobile and Keep Users Coming Back for More!
Boost Retention on Mobile and Keep Users Coming Back for More!Boost Retention on Mobile and Keep Users Coming Back for More!
Boost Retention on Mobile and Keep Users Coming Back for More!InMobi
 
Building Mobile Creatives that Deliver Real Results
Building Mobile Creatives that Deliver Real ResultsBuilding Mobile Creatives that Deliver Real Results
Building Mobile Creatives that Deliver Real ResultsInMobi
 
Everything you need to know about mobile video ads in india and apac
Everything you need to know about mobile video ads in india and apacEverything you need to know about mobile video ads in india and apac
Everything you need to know about mobile video ads in india and apacInMobi
 
The Golden Age of Mobile Video Advertising | Global
The Golden Age of Mobile Video Advertising | GlobalThe Golden Age of Mobile Video Advertising | Global
The Golden Age of Mobile Video Advertising | GlobalInMobi
 
Everything a developer needs to know about the mobile video ads
Everything a developer needs to know about the mobile video ads Everything a developer needs to know about the mobile video ads
Everything a developer needs to know about the mobile video ads InMobi
 

More from InMobi (20)

Responding to Coronavirus: How marketers can leverage digital responsibly
Responding to Coronavirus: How marketers can leverage digital responsiblyResponding to Coronavirus: How marketers can leverage digital responsibly
Responding to Coronavirus: How marketers can leverage digital responsibly
 
2020: Celebrating the Era of the Connected Consumer
2020: Celebrating the Era of the Connected Consumer2020: Celebrating the Era of the Connected Consumer
2020: Celebrating the Era of the Connected Consumer
 
Winning the Indian Festive Shopper in 2019
Winning the Indian Festive Shopper in 2019Winning the Indian Festive Shopper in 2019
Winning the Indian Festive Shopper in 2019
 
The Changing Face of the Indian Mobile User
The Changing Face of the Indian Mobile UserThe Changing Face of the Indian Mobile User
The Changing Face of the Indian Mobile User
 
Unlocking the True Potential of Data on Mobile
Unlocking the True Potential of Data on MobileUnlocking the True Potential of Data on Mobile
Unlocking the True Potential of Data on Mobile
 
InMobi State of Mobile Video Advertising Report 2018
InMobi State of Mobile Video Advertising Report 2018InMobi State of Mobile Video Advertising Report 2018
InMobi State of Mobile Video Advertising Report 2018
 
Neural Field aware Factorization Machine
Neural Field aware Factorization MachineNeural Field aware Factorization Machine
Neural Field aware Factorization Machine
 
The Essential Mediation Toolkit - Korean
The Essential Mediation Toolkit - KoreanThe Essential Mediation Toolkit - Korean
The Essential Mediation Toolkit - Korean
 
A Comprehensive Guide for App Marketers
A Comprehensive Guide for App MarketersA Comprehensive Guide for App Marketers
A Comprehensive Guide for App Marketers
 
A Cure for Ad-Fraud: Turning Fraud Detection into Fraud Prevention
A Cure for Ad-Fraud: Turning Fraud Detection into Fraud PreventionA Cure for Ad-Fraud: Turning Fraud Detection into Fraud Prevention
A Cure for Ad-Fraud: Turning Fraud Detection into Fraud Prevention
 
[Webinar] driving accountability in mobile advertising
[Webinar] driving accountability in mobile advertising[Webinar] driving accountability in mobile advertising
[Webinar] driving accountability in mobile advertising
 
The Brand Marketer's Guide to Mobile Video Viewability
The Brand Marketer's Guide to Mobile Video ViewabilityThe Brand Marketer's Guide to Mobile Video Viewability
The Brand Marketer's Guide to Mobile Video Viewability
 
Top 2017 Mobile Advertising Trends in Indonesia
Top 2017 Mobile Advertising Trends in IndonesiaTop 2017 Mobile Advertising Trends in Indonesia
Top 2017 Mobile Advertising Trends in Indonesia
 
Mobile marketing strategy guide
Mobile marketing strategy guide Mobile marketing strategy guide
Mobile marketing strategy guide
 
InMobi Yearbook 2016
InMobi Yearbook 2016InMobi Yearbook 2016
InMobi Yearbook 2016
 
Boost Retention on Mobile and Keep Users Coming Back for More!
Boost Retention on Mobile and Keep Users Coming Back for More!Boost Retention on Mobile and Keep Users Coming Back for More!
Boost Retention on Mobile and Keep Users Coming Back for More!
 
Building Mobile Creatives that Deliver Real Results
Building Mobile Creatives that Deliver Real ResultsBuilding Mobile Creatives that Deliver Real Results
Building Mobile Creatives that Deliver Real Results
 
Everything you need to know about mobile video ads in india and apac
Everything you need to know about mobile video ads in india and apacEverything you need to know about mobile video ads in india and apac
Everything you need to know about mobile video ads in india and apac
 
The Golden Age of Mobile Video Advertising | Global
The Golden Age of Mobile Video Advertising | GlobalThe Golden Age of Mobile Video Advertising | Global
The Golden Age of Mobile Video Advertising | Global
 
Everything a developer needs to know about the mobile video ads
Everything a developer needs to know about the mobile video ads Everything a developer needs to know about the mobile video ads
Everything a developer needs to know about the mobile video ads
 

Latest InMobi research finds smartphones impression growth outpacing advanced phones 3 to 1

  • 1. A GLOBAL VIEW OF MOBILE ADVERTISING:               OCTOBER 2010 REPORT - ASIA PACIFIC MARKET SECOND RELEASE:  INMOBI NETWORK DATA  Release Date: 6 January, 2011 The World’s Largest Independent Mobile Ad Network To download the full report, visit us at www.InMobi.com/research  www.inmobi.com research@inmobi.com
  • 2. NET WORK DATA Network Data: Specifications and Representation Specifications Data in this report are sourced from our global mobile advertising network which served 24.1 billion impressions in October 2010. With 102 countries receiving over 10 million impressions in October 2010, we are able to claim one of the broadest and most representative networks in the world. Exact specifications are as follows: • Global Available Impressions in July 2010: 20.3 Billion • Global Available Impressions in October 2010: 24.1 Billion • Regions Represented: Africa, Asia Pacific, Europe, Middle East, North America, and South America • Countries Represented: 102 countries with over 10 million impressions in October 2010 • Base Measure: Available Impressions • Reports: Market Summary, Manufacturer Share, OS Share, and Top Handsets & Connected Devices • Time Periods: October 2010 with change versus July 2010 Representation InMobi is committed to an independent and transparent leadership position in mobile advertising. With that in mind, the following issues are present in this data. Mobile Advertising Market Definition: This report covers mobile display advertising only including both WAP and APP. SMS/Text and Search are NOT included in this synopsis. Scale and Time In Market: Representation within the network is a function of the both scale and time in market. Readers can expect more fluctation and variance in younger, smaller markets for the company. Publisher Mix: As with any ad network, market representation is a function of the publisher mix. We have over 5,000 publishers of all sizes and content types, but changes to the publisher mix in a given market could impact the data. Advertiser Mix: Similar to publisher mix, the advertiser mix could impact the numbers in our network, although to a much lesser extent than publishers. www.inmobi.com Source: InMobi Global Mobile Ad Network Statistics, October 2010
  • 3. ASIA Asia Regional Profile: October 2010 Asia mobile ad impressions grew by just under 1  billion impressions in 90 days (+8.7%). Smartphones primarily drove Asia impression growth on the InMobi  network, growing 47.2%.  With mobile phone proliferation across  Asia, Smartphones increasingly become the primary digital media  screen for a large portion of the worldʼs population. Smartphone gains (+719 million impressions) were  primarily driven by the Apple iPhone. The Apple iPhone increased +6.5 share points in just 90 days.  This  puts it as the clear number 1 handset in the region with over 1  billion impressions monthly.  As iPhone penetration increases, we  can expect Apple to be the dominant smartphone OS in the region  and continue taking impression share from the historically Nokia  and Symbian OS region. With 2.2 billion smartphone impressions, smart- phones in Asia represent nearly 10% of the global  mobile ad ecosystem. Android and iPhone OS are leading the push of smartphone  impressions in Asia, capturing +9.3 additional share points in the  region.  This highlights a significant opportunity for advertisers to  reach consumers with engaging advertising experiences in emerg- ing markets. Available Impression Volume & Composition Global  Type July October % Chg Development  Index Total    11,460,224,000    12,457,582,814 8.7% na Smartphone    1,523,003,912    2,241,896,823 47.2% 66 Advanced    9,937,220,088    10,215,685,991 2.8% 113 www.inmobi.com Source:  InMobi Global Mobile Ad Network Statistics, October 2010
  • 4. ASIA Asia OS Shares: October 2010 Global  Available Impressions OS Available Impressions % Share Pt Chg Development  Index Nokia OS        3,034,806,820 24.4% -11.4 128 Symbian OS         2,101,021,437 16.9% -8.5 105 iPhone OS        1,173,410,709 9.4% +7.7 83 Android            219,570,270 1.8% +1.6 36 Nokia OS Windows Mobile OS             51,159,686 0.4% No Change 76 24.4% Symbian OS RIM OS             35,094,061 0.3% No Change 10 Other        5,842,519,831 46.9% na na iPhone OS 46.9% Android 16.9% Windows Mobile OS RIM OS 9.4% Other .3% .4% 1.8% As smartphone penetration increases, Android and iPhone OS continue to quickly capture share (+9.3 share points combined) of mobile ad inventory from the traditional strongholds of Nokia and Symbian OS (41.2% combined share). Android grew over 200MM impressions in just the past 90 days. This represents a 20X increase in monthly impressions to a 1.8% share. iPhone OS grew just under 1 billion impressions and now captures 9.4% of available impressions in the region. www.inmobi.com Source:  InMobi Global Mobile Ad Network Statistics, October 2010
  • 5. ASIA Asia Manufacturer Share: October 2010 Global  Available Impressions Manufacturer Available Impressions % Share Pt Chg Development  Index Nokia         7,096,800,821 57.0% -4.0 118 Samsung         1,557,390,379 12.5% +1.9 80 1% SonyEricsson         1,391,375,083 11.2% -2.8 118 3% 6% Apple         1,173,410,709 9.4% +7.7 83 Nokia LG            310,155,155 2.5% +0.4 71 Samsung Nexian           168,722,652 1.4% -0.6 193 9% Other           759,728,015 6.1% -2.5 na SonyEricsson 11% Apple 57% LG 13% Nexian Other Nokia (57%) continues to capture the majority of ad impressions in Asia, although a variety of smartphone manufacturers combine to gain +10 share points (Samsung, Apple, LG). Apple becomes the fastest growing manufacturer in Asia, gaining +7.7 share pts in only 90 days. This brings Apple to 1.2 billion impressions in the market. Nokia’s -4.0 decline puts it at 7.1 billion impressions in Asia. This still represents over 25% of the global mobile ad ecosystem. In addition to Apple, Samsung also increased its share +1.9 pts of just under 350 million impressions. www.inmobi.com Source:  InMobi Global Mobile Ad Network Statistics, October 2010
  • 6. ASIA Asia Handset and Connected Device Detail: October 2010 Global  Manufacturer Available Impressions % Share Pt Chg Development  Index Apple iPhone          1,020,183,633 8.2% +6.5 73 Nokia 3110c            586,539,706 4.7% -0.1 153 Nokia 6300             361,196,294 2.9% -0.2 107 Nokia N70            308,369,606 2.5% -0.4 115 Nokia 7210            272,961,788 2.2% No Change 180 Nokia 5130            242,926,226 2.0% No Change 132 Nokia N2700 Classic            218,498,537 1.8% +0.3 154 Nokia 5233            205,843,931 1.7% +0.6 181 Nokia E63            205,442,166 1.6% -0.1 123 Nokia 2600c            189,057,701 1.5% -0.6 139 Nokia 2626            177,644,099 1.4% -0.3 150 Samsung GT-S3310            160,988,647 1.3% +0.2 189 Nokia N80            158,860,748 1.3% -0.1 118 Nokia N2690            158,779,653 1.3% n/a 175 Nokia 7610            148,182,921 1.2% -0.2 139 SonyEricsson W200i            142,223,098 1.1% -0.4 161 Nokia 6030            136,870,251 1.1% -0.1 163 Nokia 6020            135,419,475 1.1% n/a 119 Nokia 5300             132,517,733 1.1% -0.2 162 Nokia 6233             131,198,583 1.1% No Change 128 Apple iPhone (8.2%) becomes the #1 handset in the region.   The iPhone’s remarkable +6.5 share gain brings the device to just over 1.0 billion impressions in Asia. The second largest device, the Nokia 3110c, holds 4.7% share. Nokia devices dominate the top 10 handsets, representing 9 of top 10 devices. www.inmobi.com Source:  InMobi Global Mobile Ad Network Statistics, October 2010
  • 7. ASIA Asia Regional Summary:  October 2010  Available Impression Volume & Composition Top 3 OS Systems:  % Share Available Impressions Global  Global  Type July October % Chg Development  July October Pt. Chg Development  Index Index Total    11,460,224,000    12,457,582,814 8.7% na Nokia OS 35.8% 24.4% -11.4 128 Smartphone    1,523,003,912    2,241,896,823 47.2% 66 Symbian OS 25.4% 16.9% -8.5 105 Advanced    9,937,220,088    10,215,685,991 2.8% 113 iPhone OS 1.7% 9.4% +7.7 83 Top 5 Manufacturers:  % Share Available Impressions Top 10 Handsets: % Share Available Impressions Global  Global  July October Pt. Chg Development  July October Pt. Chg Development  Index Index Nokia 61.0% 57.0% -4.0 118 Apple iPhone 1.7% 8.2% +6.5 73 Samsung 10.6% 12.5% +1.9 80 Nokia 3110c 4.8% 4.7% -0.1 153 SonyEricsson 14.0% 11.2% -2.8 118 Nokia 6300 3.1% 2.9% -0.2 107 Apple 1.7% 9.4% +7.7 83 Nokia N70 2.9% 2.5% -0.4 115 LG 2.1% 2.5% +0.4 71 Nokia 7210 2.2% 2.2% No Change 180 Nokia 5130 2.0% 2.0% No Change 132 Nokia N2700 Classic 1.5% 1.8% +0.3 154 Nokia 5233 1.1% 1.7% +0.6 181 Nokia E63 1.7% 1.6% -0.1 123 Nokia 2600c 2.1% 1.5% -0.6 139 Asia mobile impression growth (+8.7%) is driven by 47% increase in smartphone inventory. Nokia still commands the majority of impressions in the region (57%) although Apple is growing very quickly (+7.7 share points). Apple iPhone becomes the #1 handset in the region with 8.2% share. Nokia and Symbian operating systems continue to lose share to iPhone OS and Android (+9.3 share points combined). www.inmobi.com Source:  InMobi Global Mobile Ad Network Statistics, October 2010
  • 8. NEXT STEPS These data are the second of a series of network reports that are released quarterly. Additional regions and markets will be released throughout the quarter. Release Schedule Network data will be released at least once per quarter with the potential to increase frequency. The next planned release is January 2011 data around February 28th, 2011. Open Source Research: Getting Involved Objective industry analysts and thought-leaders are encouraged to comment, question, and participate. We will be sure to consider and update the research based on feedback and questions to improve the quality for all end users. To participate, contact us at Research@inMobi.com. To download the full reports, visit us at www.InMobi.com/research www.inmobi.com Source: InMobi Global Mobile Ad Network Statistics, October 2010
  • 9. MEASURES AND TERM DEFINITIONS InMobi Global Research: Measures and Term Definitions Measures: Available Impressions: The total number of ad requests made to the InMobi network. Note this is the base measure for all analysis in this report given its representation of mobile advertising activity. % Share (of Available Impressions): The % of total available impressions in the specified region allocated to the inventory type, device, manufacturer, or OS under analysis. Global Development Index: An index of the % share of the inventory type, device, manufacturer, or OS under analysis in the specified region or country relative to that same inventory type, device, manufacturer, or OS share globally. (For example, iPhone OS Share in Europe is 22.9% while globally its 8.2%. Indexing 22.9% to 8.2% gives us our EU Global Development Index of 279.) Regional Development Index: An index of the % share of the inventory type, device, manufacturer, or OS under analysis in the specified country relative to that same inventory type, device, manufacturer, or OS share in the relevant region. % Chg: The percentage change in absolute value between two different time periods. Pt Chg: The difference between two share percentages for an inventory type, device, manufacturer, or OS under analysis in different time periods. Definitions: Smartphone: Any phone with an iPhone OS, Android OS, RIM OS, webOS, Windows Mobile OS, Linux Smartphone OS, Palm OS, Nokia N & E Series Phones, or Samsung Bada. Advanced: Any phone with an OS or handset NOT included in the smart phone definition above. Note that feature phones are not capable of receiving mobile display ads and WAP (Wireless Application Protocol): Any impression served using Wireless Application Protocol (WAP) which is an open international standard for application-layer network communications in a wireless-communication environment. App (Application): Any impressions served to a Mobile application resident on the consumer mobile device. OS (Operating System): The system software (programs and data) running on the mobile devices that manages the hardware and provides common services for execution of various application software receiving the impression. Handsets and Connected Device: The make and model of the mobile device receiving the impression. Manufacturer: The manufacturer of the mobile device receiving the impression. Other: An aggregation of any remaining impressions not specifically detailed previously. InMobi Regional Definitions: InMobi defines all regions per Wikipedia with the following modifications: “Asia Pacific” excludes China and Japan and includes all remaining Asian countries plus the 15 Oceania countries as listed in Wikipedia. Contact Information: Readers are encouraged to contact us and/or follow us on www.Twitter.com/InMobi, Facebook by searching “InMobi” and looking for our logo, or follow our company blog at www.inMobi.com/blog. You can also hear from us directly by contacting us at Research@InMobi.com. www.inmobi.com Source: InMobi Global Mobile Ad Network Statistics, October 2010