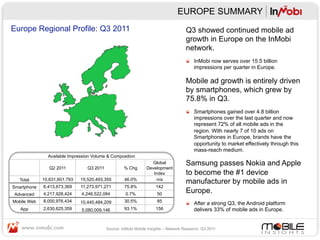
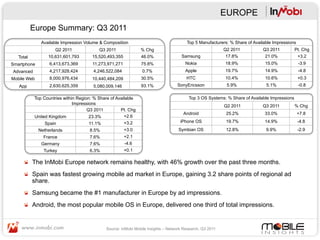
A GLOBAL VIEW OF MOBILE ADVERTISING:
        Europe Regional Summary Q3 2011

              InMobi Mobile Insights - Network Data

                  Release date: October 25th, 2011
ABOUT THE RESEARCH

Project Background
After launching in 2007 in Asia, InMobi quickly grew to become the world's largest independent
mobile advertising network. In the third quarter of 2011, we served 138.4 billion impressions in 165
markets worldwide. With a physical presence in 5 continents, over 5,500 publisher partners, and a
broad, independent market footprint, InMobi is well positioned to provide an objective,
comprehensive, and representative view of the mobile advertising market.

Research Objectives
We have three goals with this research:
1.  Help educate the market. Statistics and information about the state of mobile
    advertising are lacking in most regions of the world.
2.  Track consumer opinions regarding mobile advertising. With any emerging
    medium, the consumer perspective is critical to overall market success. We see
    a need for trending across regions in this area.
3.  Collaborate with industry thought leaders to increase market insight and improve
    information quality ongoing. As a global independent company, we value
    partnerships that will strengthen our understanding of the market. Researchers,
    thought-leaders, and analysts are encouraged to contact us and apply for full
    partner access.
                                               Beginning July 2011, InMobi is moving towards
 Contact Information                           quarterly data views which will highlight broader
 www.inmobi.com/research                        industry trends and provide an overview of the
 research@inmobi.com
                                                       global mobile advertising market. 	
  
 Twitter: @inmobi
NETWORK DATA
Specifications
Data in this report are sourced from our global mobile advertising network which served 138.4 billion
impressions in the third quarter of 2011. With 165 countries receiving over 50.4 billion impressions in
September, we are able to claim one of the broadest and most representative networks in the world. Exact
specifications are as follows:
•     Global Available Impressions in Quarter 3, 2011: 138.4 billion
•     Regions Represented: Africa, Asia Pacific, Europe, Middle East, North America, and South America
•     Countries Represented: 131 countries with over 10 million impressions per month
•     Base Measure: Available Impressions
•     Reports: Market Summary, Manufacturer Share, OS Share, and Top Handsets & Connected Devices
•     Time Periods: Q2 2011 (April – June 2011), Q3 2011 (July – September 2011)
•     Comparisons: Q3 2011 versus Q2 2011

Representation
InMobi is committed to an independent and transparent leadership position in mobile advertising. With that in mind,
the following issues are present in this data.
Mobile Advertising Market Definition: This report covers mobile display advertising only including both Mobile Web
(WAP) and APP. SMS/Text and Search are NOT included in this synopsis.
Scale and Time In Market: Representation within the network is a function of the both scale and time in market.
Readers can expect more fluctuation and variance in younger, smaller markets for the company.
Publisher Mix: As with any ad network, market representation is a function of the publisher mix. We have over
5,000 publishers of all sizes and content types, but changes to the publisher mix in a given market could impact the
data.
Advertiser Mix: Similar to publisher mix, the advertiser mix could impact the numbers in our network, although to a
much lesser extent than publishers.
EUROPE SUMMARY
Europe Regional Profile: Q3 2011                                                     Q3 showed continued mobile ad
                                                                                     growth in Europe on the InMobi
                                                                                     network.
                                                                                     "   InMobi now serves over 15.5 billion
                                                                                         impressions per quarter in Europe.

                                                                                     Mobile ad growth is entirely driven
                                                                                     by smartphones, which grew by
                                                                                     75.8% in Q3.
                                                                                     "   Smartphones gained over 4.8 billion
                                                                                         impressions over the last quarter and now
                                                                                         represent 72% of all mobile ads in the
                                                                                         region. With nearly 7 of 10 ads on
                                                                                         Smartphones in Europe, brands have the
                                                                                         opportunity to market effectively through this
                                                                                         mass-reach medium.
               Available Impression Volume & Composition
                                                                  Global             Samsung passes Nokia and Apple
                Q2 2011          Q3 2011            % Chg       Development
                                                                   Index             to become the #1 device
   Total     10,631,601,793   15,520,493,355        46.0%           n/a
                                                                                     manufacturer by mobile ads in
Smartphone   6,413,673,369    11,273,971,271        75.8%            142
Advanced     4,217,928,424    4,246,522,084          0.7%            50
                                                                                     Europe.
Mobile Web   8,000,976,434    10,440,484,209        30.5%            85
                                                                                     "   After a strong Q3, the Android platform
   App       2,630,625,359    5,080,009,146         93.1%            156                 delivers 33% of mobile ads in Europe.


                                           Source: InMobi Mobile Insights – Network Research, Q3 2011
EUROPE
      Europe OS Share: Q3 2011

            Available Impressions
                                                                                                                               Global
                                            Android                       OS              Impressions     % Share   Pt. Chg Development
                                                                                                                               Index

                                 33%	
      iPhone OS                   Android           5,120,359,997    33.0%     +7.8      147
  36%	
  
                                            Symbian OS                iPhone OS           2,316,876,617    14.9%     -4.8      136

                                                                     Symbian OS           1,536,220,208    9.9%      -2.9       56
                                            Nokia OS
                                                                       Nokia OS            904,316,977     5.8%      -1.7       32
                                            Others
                                                                        Others            5,642,719,556    36.4%     +1.6       n/a
        6%	
               15%	
  
                 10%	


Android continues to grow and remains the top mobile platform in the region, with an
increase of 7.8 share points in Q3. iPhone OS and Symbian lost share in Q3.
"  In Q4 2010 and Q1 2011 Android growth far outpaced the market; this trend reversed in Q2, partially because of the strength
    of the Apple iPad. In Q3 Android growth continued.

"  Android and iPhone OS combined represent almost half of ad impressions delivered in Europe.


                                           Source: InMobi Mobile Insights – Network Research, Q3 2011
EUROPE
 Europe Manufacturer Share: Q3 2011

                             Available Impressions                                                                                             Global
                                                                                    Manufacturer         Impressions    % Share   Pt. Chg   Development
                                                                                                                                               Index
                                                         Samsung                      Samsung           3,261,277,052   21.0%      +3.2         117
                                     21%	
               Nokia                          Nokia           2,325,210,178   15.0%      -3.9         42
         29%	
                                           Apple
                                                                                        Apple           2,316,876,617   14.9%      -4.8         136
                                                         HTC
                                                                                         HTC            1,651,407,634   10.6%      +0.3         180
                                                         SonyEricsson
                                                                                    SonyEricsson         788,283,082     5.1%      -0.8         89
                                                         LG
                                               15%	
                                      LG             487,715,717     3.1%      -0.5         76
                                                         Motorola
1%	
                                                     Others                        Motorola          183,900,732     1.2%      -1.0         45
3%	
     5%	
  
                                                                                        Others          4,505,822,343   29.0%      +7.6         n/a
                   11%	
         15%	


     Samsung became the #1 mobile phone manufacturer by share of ad impressions in Q3.
     "  Samsung gained 3.2 share points while Nokia and Apple lost 3.9 and 4.8 points, respectively.

     "  Devices from the top three manufacturers (Samsung, Nokia and Apple) in Europe represent 50% of all mobile ads in the
         region.


                                                         Source: InMobi Mobile Insights – Network Research, Q3 2011
EUROPE
Europe Handset and Connected Device Detail: Q3 2011

                                                                                                                Global
                          Handset                        Impressions              % Share          Pt. Chg   Development
                                                                                                                Index
                       Apple iPhone 4                   1,112,059,797               7.2%             +0.2        174
                     Samsung GT-I9000                    759,629,959                4.9%             +0.1        412
                       HTC Desire S                      473,919,160                3.1%             +3.1        325
                     Samsung GT-I9100                    418,257,477                2.7%             +2.2        376
                        Apple iPad I                     401,690,652                2.6%             +0.4        187
                        HTC Desire                       335,822,853                2.2%             -2.1        454
                  Apple iPod Generation IV               317,757,528                2.0%             +0.1        140
                    Samsung GT-S5830                     279,166,617                1.8%             +1.8        363
                        HTC Wildfire                     268,890,880                1.7%             +1.4        556
                        HTC 001HT                        266,835,741                1.7%             +1.7        127
                     SonyEricsson E15i                   195,350,043                1.3%             +0.9        349
                        Nokia 6300                       188,340,463                1.2%             -0.4        67
                         Nokia X6                        167,199,821                1.1%             +0.6        180


3 of the top 7 devices in the European mobile ecosystem by ad impression are Apple
devices. The iPhone remains the #1 device in the region.
"  All the top ten devices over-index considerably, demonstrating the unique composition of smartphone devices in the Europe
    mobile landscape.


                                             Source: InMobi Mobile Insights – Network Research, Q3 2011
EUROPE
           Europe Summary: Q3 2011
               Available Impression Volume & Composition                                Top 5 Manufacturers: % Share of Available Impressions
                      Q2 2011              Q3 2011              % Chg                                      Q2 2011          Q3 2011           Pt. Chg
   Total          10,631,601,793        15,520,493,355          46.0%                 Samsung               17.8%            21.0%             +3.2
Smartphone         6,413,673,369        11,273,971,271          75.8%                  Nokia               18.9%             15.0%              -3.9
Advanced           4,217,928,424        4,246,522,084            0.7%                  Apple               19.7%             14.9%              -4.8
Mobile Web         8,000,976,434        10,440,484,209          30.5%                   HTC                10.4%             10.6%              +0.3
   App             2,630,625,359        5,080,009,146           93.1%              SonyEricsson             5.9%              5.1%              -0.8

            Top Countries within Region: % Share of Available                            Top 3 OS Systems: % Share of Available Impressions
                               Impressions
                                                                                                           Q2 2011          Q3 2011           % Chg
                                      Q3 2011         Pt. Chg
                                                                                      Android               25.2%            33.0%              +7.8
            United Kingdom             23.3%            +2.6
                Spain                 11.1%              +3.2                        iPhone OS              19.7%            14.9%              -4.8
             Netherlands              8.5%               +3.0                       Symbian OS              12.8%             9.9%              -2.9
                France                7.6%               +2.1
               Germany                7.6%               -4.6
                Turkey                6.3%               +0.1

      "   The InMobi Europe network remains healthy, with 46% growth over the past three months.
      "   Spain was fastest growing mobile ad market in Europe, gaining 3.2 share points of regional ad
          share.
      "   Samsung became the #1 manufacturer in Europe by ad impressions.
      "   Android, the most popular mobile OS in Europe, delivered one third of total impressions.


                                              Source: InMobi Mobile Insights – Network Research, Q3 2011
MEASURES AND TERM DEFINITIONS

Measures:
Available Impressions: The total number of ads requests made to the InMobi network
% Share (of Available Impressions): The % of total available impressions in the specified region allocated to the inventory type, device,
manufacturer, or OS under analysis.
Global Development Index: An index of the % share of the inventory type, device, manufacturer, or OS under analysis in the specified
region or country relative to that same inventory type, device, manufacturer, or OS share globally.
Regional Development Index: Global Development Index: An index of the % share of the inventory type, device, manufacturer, or OS
under analysis in the specified country relative to that same inventory type, device, manufacturer, or OS share in the relevant region.
% Chg: The percentage change in absolute value between two different time periods.
Pt Chg: The difference between two share percentages for an inventory type, device, manufacturer, or OS under analysis in different time
periods.


Definitions:
Smartphone: Any impression served to an iPhone OS, Android OS, RIM OS, webOS, Windows Mobile OS, Linux Smartphone OS, Palm
OS, Nokia N & E Series Phones, or Samsung Bada.
Advanced: Any impression served to any OS or handset not included in the smart phone definition above.
Mobile Web: Any impression served using Wireless Application Protocol (WAP) which is an open international standard for application-
layer network communications in a wireless-communication environment.
App (Application): Any impressions served to a mobile application resident on the consumer mobile device.
Carrier: The mobile network operator (MNO), carrier service provider (CSP), wireless service provider, wireless carrier, or cellular
company providing service for mobile phone subscriber served the impression.
OS (Operating System): The system software (programs and data) running on the mobile devices that manages the hardware and
provides common services for execution of various application software receiving the impression.
Handsets and Connected Device: The make and model of the mobile device receiving the impression.
Manufacturer: The OEM manufacturer of the mobile device receiving the impression.
Other: An aggregation of any remaining impressions not specifically detailed previously. Typically an aggregation of everything under 1%
share.


InMobi Regional Definitions:
InMobi defines all regions per Wikipedia with the following modifications:
“Asia Pacific” includes the 15 Oceania countries as listed in Wikipedia.
“South America” includes South & Central Americas as listed in Wikipedia.
NEXT STEPS

This data is part of a series of network reports that are released monthly.
Additional regions and markets will be released throughout the quarter.

Release Schedule
Once a quarter InMobi will release a full data report which will include global, regional and country
data views. The next full release is planned for mid January. Infographics with monthly data will be
available in November and December. Monthly data updates including key information by market will
be released via our mailing lists and website.

While we move to a quarterly release schedule, we will still continue to release insightful data on key
markets across regions on a monthly basis. These releases will shed light on emerging trends and
unique developments specific to those key markets.

Open Source Research: Getting Involved
Objective industry analysts and thought-leaders are encouraged to comment, question, and
participate. We will be sure to consider and update the research based on feedback and questions
to improve the quality for all end users.

To join our monthly research mailing list, contact us at Research@InMobi.com

To download the full reports, visit us at www.InMobi.com/research

Q3 2011 - Europe Report

  • 1.
    A GLOBAL VIEWOF MOBILE ADVERTISING: Europe Regional Summary Q3 2011 InMobi Mobile Insights - Network Data Release date: October 25th, 2011
  • 2.
    ABOUT THE RESEARCH ProjectBackground After launching in 2007 in Asia, InMobi quickly grew to become the world's largest independent mobile advertising network. In the third quarter of 2011, we served 138.4 billion impressions in 165 markets worldwide. With a physical presence in 5 continents, over 5,500 publisher partners, and a broad, independent market footprint, InMobi is well positioned to provide an objective, comprehensive, and representative view of the mobile advertising market. Research Objectives We have three goals with this research: 1.  Help educate the market. Statistics and information about the state of mobile advertising are lacking in most regions of the world. 2.  Track consumer opinions regarding mobile advertising. With any emerging medium, the consumer perspective is critical to overall market success. We see a need for trending across regions in this area. 3.  Collaborate with industry thought leaders to increase market insight and improve information quality ongoing. As a global independent company, we value partnerships that will strengthen our understanding of the market. Researchers, thought-leaders, and analysts are encouraged to contact us and apply for full partner access. Beginning July 2011, InMobi is moving towards Contact Information quarterly data views which will highlight broader www.inmobi.com/research industry trends and provide an overview of the research@inmobi.com global mobile advertising market.   Twitter: @inmobi
  • 3.
    NETWORK DATA Specifications Data inthis report are sourced from our global mobile advertising network which served 138.4 billion impressions in the third quarter of 2011. With 165 countries receiving over 50.4 billion impressions in September, we are able to claim one of the broadest and most representative networks in the world. Exact specifications are as follows: • Global Available Impressions in Quarter 3, 2011: 138.4 billion • Regions Represented: Africa, Asia Pacific, Europe, Middle East, North America, and South America • Countries Represented: 131 countries with over 10 million impressions per month • Base Measure: Available Impressions • Reports: Market Summary, Manufacturer Share, OS Share, and Top Handsets & Connected Devices • Time Periods: Q2 2011 (April – June 2011), Q3 2011 (July – September 2011) • Comparisons: Q3 2011 versus Q2 2011 Representation InMobi is committed to an independent and transparent leadership position in mobile advertising. With that in mind, the following issues are present in this data. Mobile Advertising Market Definition: This report covers mobile display advertising only including both Mobile Web (WAP) and APP. SMS/Text and Search are NOT included in this synopsis. Scale and Time In Market: Representation within the network is a function of the both scale and time in market. Readers can expect more fluctuation and variance in younger, smaller markets for the company. Publisher Mix: As with any ad network, market representation is a function of the publisher mix. We have over 5,000 publishers of all sizes and content types, but changes to the publisher mix in a given market could impact the data. Advertiser Mix: Similar to publisher mix, the advertiser mix could impact the numbers in our network, although to a much lesser extent than publishers.
  • 4.
    EUROPE SUMMARY Europe RegionalProfile: Q3 2011 Q3 showed continued mobile ad growth in Europe on the InMobi network. "   InMobi now serves over 15.5 billion impressions per quarter in Europe. Mobile ad growth is entirely driven by smartphones, which grew by 75.8% in Q3. "   Smartphones gained over 4.8 billion impressions over the last quarter and now represent 72% of all mobile ads in the region. With nearly 7 of 10 ads on Smartphones in Europe, brands have the opportunity to market effectively through this mass-reach medium. Available Impression Volume & Composition Global Samsung passes Nokia and Apple Q2 2011 Q3 2011 % Chg Development Index to become the #1 device Total 10,631,601,793 15,520,493,355 46.0% n/a manufacturer by mobile ads in Smartphone 6,413,673,369 11,273,971,271 75.8% 142 Advanced 4,217,928,424 4,246,522,084 0.7% 50 Europe. Mobile Web 8,000,976,434 10,440,484,209 30.5% 85 "   After a strong Q3, the Android platform App 2,630,625,359 5,080,009,146 93.1% 156 delivers 33% of mobile ads in Europe. Source: InMobi Mobile Insights – Network Research, Q3 2011
  • 5.
    EUROPE Europe OS Share: Q3 2011 Available Impressions Global Android OS Impressions % Share Pt. Chg Development Index 33%   iPhone OS Android 5,120,359,997 33.0% +7.8 147 36%   Symbian OS iPhone OS 2,316,876,617 14.9% -4.8 136 Symbian OS 1,536,220,208 9.9% -2.9 56 Nokia OS Nokia OS 904,316,977 5.8% -1.7 32 Others Others 5,642,719,556 36.4% +1.6 n/a 6%   15%   10%   Android continues to grow and remains the top mobile platform in the region, with an increase of 7.8 share points in Q3. iPhone OS and Symbian lost share in Q3. "  In Q4 2010 and Q1 2011 Android growth far outpaced the market; this trend reversed in Q2, partially because of the strength of the Apple iPad. In Q3 Android growth continued. "  Android and iPhone OS combined represent almost half of ad impressions delivered in Europe. Source: InMobi Mobile Insights – Network Research, Q3 2011
  • 6.
    EUROPE Europe ManufacturerShare: Q3 2011 Available Impressions Global Manufacturer Impressions % Share Pt. Chg Development Index Samsung Samsung 3,261,277,052 21.0% +3.2 117 21%   Nokia Nokia 2,325,210,178 15.0% -3.9 42 29%   Apple Apple 2,316,876,617 14.9% -4.8 136 HTC HTC 1,651,407,634 10.6% +0.3 180 SonyEricsson SonyEricsson 788,283,082 5.1% -0.8 89 LG 15%   LG 487,715,717 3.1% -0.5 76 Motorola 1%   Others Motorola 183,900,732 1.2% -1.0 45 3%   5%   Others 4,505,822,343 29.0% +7.6 n/a 11%   15%   Samsung became the #1 mobile phone manufacturer by share of ad impressions in Q3. "  Samsung gained 3.2 share points while Nokia and Apple lost 3.9 and 4.8 points, respectively. "  Devices from the top three manufacturers (Samsung, Nokia and Apple) in Europe represent 50% of all mobile ads in the region. Source: InMobi Mobile Insights – Network Research, Q3 2011
  • 7.
    EUROPE Europe Handset andConnected Device Detail: Q3 2011 Global Handset Impressions % Share Pt. Chg Development Index Apple iPhone 4 1,112,059,797 7.2% +0.2 174 Samsung GT-I9000 759,629,959 4.9% +0.1 412 HTC Desire S 473,919,160 3.1% +3.1 325 Samsung GT-I9100 418,257,477 2.7% +2.2 376 Apple iPad I 401,690,652 2.6% +0.4 187 HTC Desire 335,822,853 2.2% -2.1 454 Apple iPod Generation IV 317,757,528 2.0% +0.1 140 Samsung GT-S5830 279,166,617 1.8% +1.8 363 HTC Wildfire 268,890,880 1.7% +1.4 556 HTC 001HT 266,835,741 1.7% +1.7 127 SonyEricsson E15i 195,350,043 1.3% +0.9 349 Nokia 6300 188,340,463 1.2% -0.4 67 Nokia X6 167,199,821 1.1% +0.6 180 3 of the top 7 devices in the European mobile ecosystem by ad impression are Apple devices. The iPhone remains the #1 device in the region. "  All the top ten devices over-index considerably, demonstrating the unique composition of smartphone devices in the Europe mobile landscape. Source: InMobi Mobile Insights – Network Research, Q3 2011
  • 8.
    EUROPE Europe Summary: Q3 2011 Available Impression Volume & Composition Top 5 Manufacturers: % Share of Available Impressions Q2 2011 Q3 2011 % Chg Q2 2011 Q3 2011 Pt. Chg Total 10,631,601,793 15,520,493,355 46.0% Samsung 17.8% 21.0% +3.2 Smartphone 6,413,673,369 11,273,971,271 75.8% Nokia 18.9% 15.0% -3.9 Advanced 4,217,928,424 4,246,522,084 0.7% Apple 19.7% 14.9% -4.8 Mobile Web 8,000,976,434 10,440,484,209 30.5% HTC 10.4% 10.6% +0.3 App 2,630,625,359 5,080,009,146 93.1% SonyEricsson 5.9% 5.1% -0.8 Top Countries within Region: % Share of Available Top 3 OS Systems: % Share of Available Impressions Impressions Q2 2011 Q3 2011 % Chg Q3 2011 Pt. Chg Android 25.2% 33.0% +7.8 United Kingdom 23.3% +2.6 Spain 11.1% +3.2 iPhone OS 19.7% 14.9% -4.8 Netherlands 8.5% +3.0 Symbian OS 12.8% 9.9% -2.9 France 7.6% +2.1 Germany 7.6% -4.6 Turkey 6.3% +0.1 "   The InMobi Europe network remains healthy, with 46% growth over the past three months. "   Spain was fastest growing mobile ad market in Europe, gaining 3.2 share points of regional ad share. "   Samsung became the #1 manufacturer in Europe by ad impressions. "   Android, the most popular mobile OS in Europe, delivered one third of total impressions. Source: InMobi Mobile Insights – Network Research, Q3 2011
  • 9.
    MEASURES AND TERMDEFINITIONS Measures: Available Impressions: The total number of ads requests made to the InMobi network % Share (of Available Impressions): The % of total available impressions in the specified region allocated to the inventory type, device, manufacturer, or OS under analysis. Global Development Index: An index of the % share of the inventory type, device, manufacturer, or OS under analysis in the specified region or country relative to that same inventory type, device, manufacturer, or OS share globally. Regional Development Index: Global Development Index: An index of the % share of the inventory type, device, manufacturer, or OS under analysis in the specified country relative to that same inventory type, device, manufacturer, or OS share in the relevant region. % Chg: The percentage change in absolute value between two different time periods. Pt Chg: The difference between two share percentages for an inventory type, device, manufacturer, or OS under analysis in different time periods. Definitions: Smartphone: Any impression served to an iPhone OS, Android OS, RIM OS, webOS, Windows Mobile OS, Linux Smartphone OS, Palm OS, Nokia N & E Series Phones, or Samsung Bada. Advanced: Any impression served to any OS or handset not included in the smart phone definition above. Mobile Web: Any impression served using Wireless Application Protocol (WAP) which is an open international standard for application- layer network communications in a wireless-communication environment. App (Application): Any impressions served to a mobile application resident on the consumer mobile device. Carrier: The mobile network operator (MNO), carrier service provider (CSP), wireless service provider, wireless carrier, or cellular company providing service for mobile phone subscriber served the impression. OS (Operating System): The system software (programs and data) running on the mobile devices that manages the hardware and provides common services for execution of various application software receiving the impression. Handsets and Connected Device: The make and model of the mobile device receiving the impression. Manufacturer: The OEM manufacturer of the mobile device receiving the impression. Other: An aggregation of any remaining impressions not specifically detailed previously. Typically an aggregation of everything under 1% share. InMobi Regional Definitions: InMobi defines all regions per Wikipedia with the following modifications: “Asia Pacific” includes the 15 Oceania countries as listed in Wikipedia. “South America” includes South & Central Americas as listed in Wikipedia.
  • 10.
    NEXT STEPS This datais part of a series of network reports that are released monthly. Additional regions and markets will be released throughout the quarter. Release Schedule Once a quarter InMobi will release a full data report which will include global, regional and country data views. The next full release is planned for mid January. Infographics with monthly data will be available in November and December. Monthly data updates including key information by market will be released via our mailing lists and website. While we move to a quarterly release schedule, we will still continue to release insightful data on key markets across regions on a monthly basis. These releases will shed light on emerging trends and unique developments specific to those key markets. Open Source Research: Getting Involved Objective industry analysts and thought-leaders are encouraged to comment, question, and participate. We will be sure to consider and update the research based on feedback and questions to improve the quality for all end users. To join our monthly research mailing list, contact us at Research@InMobi.com To download the full reports, visit us at www.InMobi.com/research