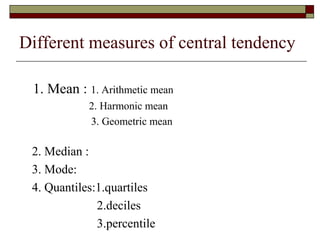
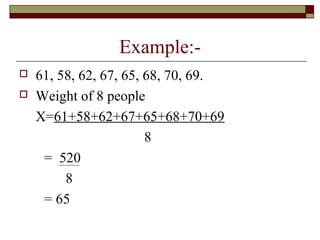
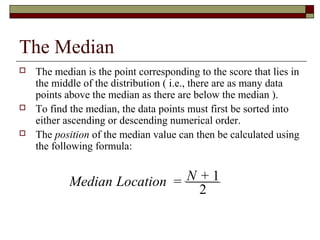
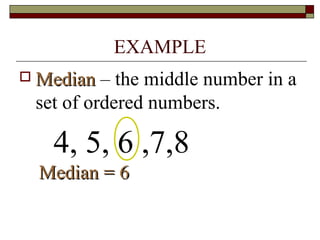
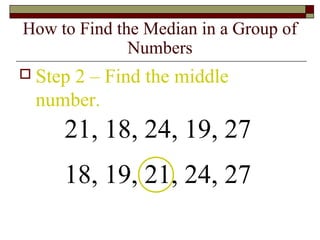
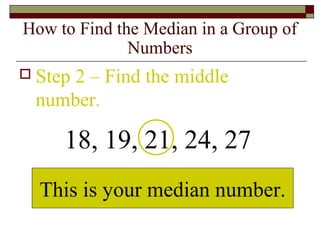
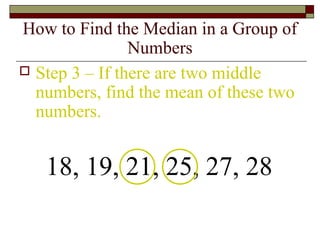
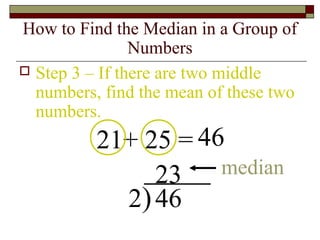
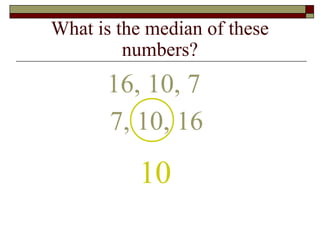
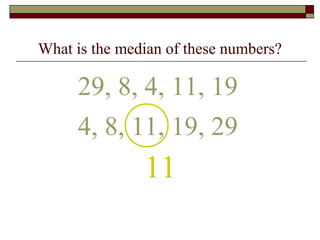
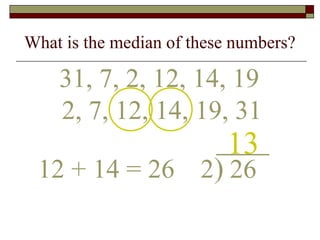
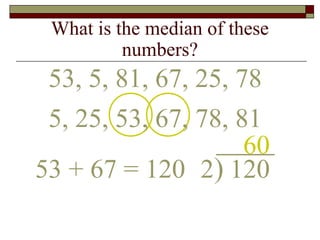
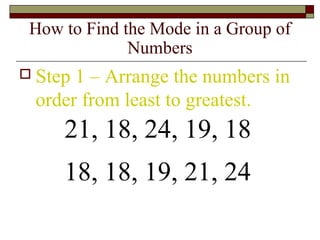
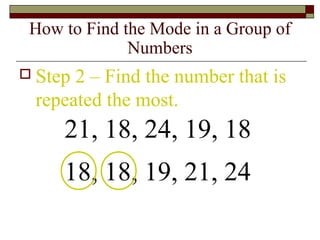
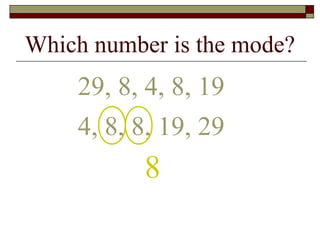
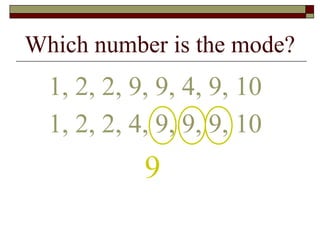
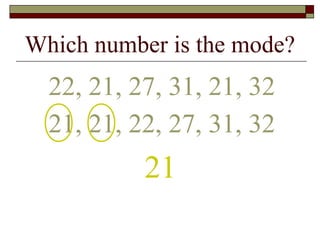
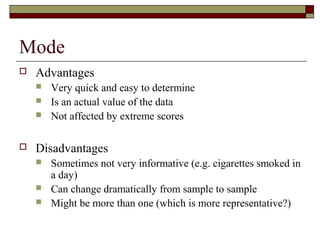
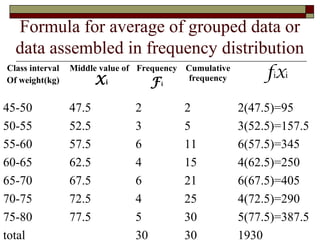
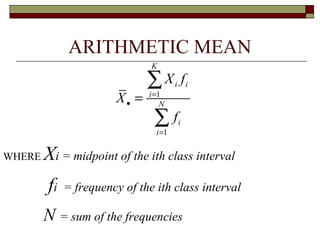
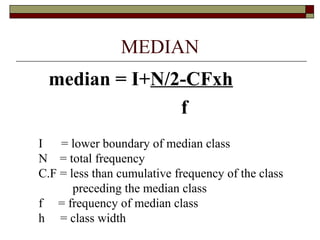
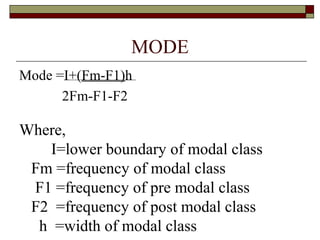
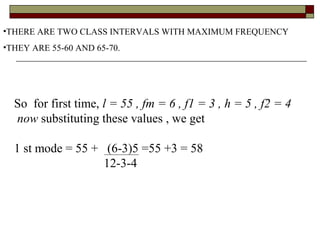
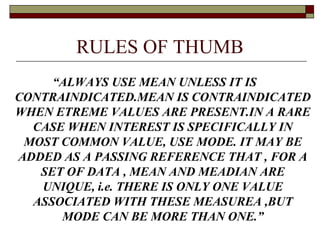
This document discusses various measures of central tendency including the mean, median, and mode. It provides definitions and formulas for calculating each measure. The mean is the average and is calculated by summing all values and dividing by the total number of data points. The median is the middle value when data is arranged in order. The mode is the value that occurs most frequently in the data set. Examples are given to demonstrate calculating each measure. The document also discusses advantages and limitations of each central tendency measure.
Measure of Central Tendency (Mean, Median, Mode and Quantiles)Salman Khan
A measure of central tendency is a summary statistic that represents the center point or typical value of a dataset. These measures indicate where most values in a distribution fall and are also referred to as the central location of a distribution. You can think of it as the tendency of data to cluster around a middle value. In statistics, the three most common measures of central tendency are the mean, median, and mode. Each of these measures calculates the location of the central point using a different method.
Measures of Central Tendency
Requirements of good measures of central tendency
mean, median, mode
skewness of distribution
relation between mean, median,mode
A measure of central tendency (also referred to as measures of center or central location) is a summary measure that attempts to describe a whole set of data with a single value that represents the middle or center of its distribution. The are some limitations to using the mode. In some distributions, the mode may not reflect the centre of the distribution very well. When the distribution of retirement age is ordered from lowest to highest value, it is easy to see that the centre of the distribution is 57 years, but the mode is lower, at 54 years.
A measure of central tendency (also referred to as measures of centre or central location) is a summary measure that attempts to describe a whole set of data with a single value that represents the middle or centre of its distribution.
Measures of Central Tendency-Mean, Median , Mode- Dr. Vikramjit SinghVikramjit Singh
This presentation discusses in details about different measures of central tendency like- mean, median, mode, Geometric Mean, Harmonic Mean and Weighted Mean.
Best practices for project execution and deliveryCLIVE MINCHIN
A select set of project management best practices to keep your project on-track, on-cost and aligned to scope. Many firms have don't have the necessary skills, diligence, methods and oversight of their projects; this leads to slippage, higher costs and longer timeframes. Often firms have a history of projects that simply failed to move the needle. These best practices will help your firm avoid these pitfalls but they require fortitude to apply.
buy old yahoo accounts buy yahoo accountsSusan Laney
As a business owner, I understand the importance of having a strong online presence and leveraging various digital platforms to reach and engage with your target audience. One often overlooked yet highly valuable asset in this regard is the humble Yahoo account. While many may perceive Yahoo as a relic of the past, the truth is that these accounts still hold immense potential for businesses of all sizes.
How to Implement a Real Estate CRM SoftwareSalesTown
To implement a CRM for real estate, set clear goals, choose a CRM with key real estate features, and customize it to your needs. Migrate your data, train your team, and use automation to save time. Monitor performance, ensure data security, and use the CRM to enhance marketing. Regularly check its effectiveness to improve your business.
Building Your Employer Brand with Social MediaLuanWise
Presented at The Global HR Summit, 6th June 2024
In this keynote, Luan Wise will provide invaluable insights to elevate your employer brand on social media platforms including LinkedIn, Facebook, Instagram, X (formerly Twitter) and TikTok. You'll learn how compelling content can authentically showcase your company culture, values, and employee experiences to support your talent acquisition and retention objectives. Additionally, you'll understand the power of employee advocacy to amplify reach and engagement – helping to position your organization as an employer of choice in today's competitive talent landscape.
At Techbox Square, in Singapore, we're not just creative web designers and developers, we're the driving force behind your brand identity. Contact us today.
Event Report - SAP Sapphire 2024 Orlando - lots of innovation and old challengesHolger Mueller
Holger Mueller of Constellation Research shares his key takeaways from SAP's Sapphire confernece, held in Orlando, June 3rd till 5th 2024, in the Orange Convention Center.
Taurus Zodiac Sign: Unveiling the Traits, Dates, and Horoscope Insights of th...my Pandit
Dive into the steadfast world of the Taurus Zodiac Sign. Discover the grounded, stable, and logical nature of Taurus individuals, and explore their key personality traits, important dates, and horoscope insights. Learn how the determination and patience of the Taurus sign make them the rock-steady achievers and anchors of the zodiac.
The 10 Most Influential Leaders Guiding Corporate Evolution, 2024.pdfthesiliconleaders
In the recent edition, The 10 Most Influential Leaders Guiding Corporate Evolution, 2024, The Silicon Leaders magazine gladly features Dejan Štancer, President of the Global Chamber of Business Leaders (GCBL), along with other leaders.
Top mailing list providers in the USA.pptxJeremyPeirce1
Discover the top mailing list providers in the USA, offering targeted lists, segmentation, and analytics to optimize your marketing campaigns and drive engagement.
Personal Brand Statement:
As an Army veteran dedicated to lifelong learning, I bring a disciplined, strategic mindset to my pursuits. I am constantly expanding my knowledge to innovate and lead effectively. My journey is driven by a commitment to excellence, and to make a meaningful impact in the world.
3.0 Project 2_ Developing My Brand Identity Kit.pptxtanyjahb
A personal brand exploration presentation summarizes an individual's unique qualities and goals, covering strengths, values, passions, and target audience. It helps individuals understand what makes them stand out, their desired image, and how they aim to achieve it.
2. BIOSTATISTICS
Statistics is the science of the collection,
organization, and interpretation of data.
Biostatistics (a contraction of biology and
statistics; sometimes referred to
as biometry or biometrics) is the application
of statistics to a wide range of topics in biology.
3. INTRODUCTION
Classification of data are helpful in reducing
and understanding the bulk of the large mass
data.
But they are descriptive.
So need arises,to find a constant which will be
representative of a group.
4. MEASURES OF CENTRAL TENDANCY
OR AVERAGE
MEASURES OF VARIATION
MEASUREA OF SKEWNESS AND
KURTOSIS
5. Different measures of central tendency
1. Mean : 1. Arithmetic mean
2. Harmonic mean
3. Geometric mean
2. Median :
3. Mode:
4. Quantiles:1.quartiles
2.deciles
3.percentile
6. AVERAGE
By careful observation of data, it can be
noticed that observations tend to cluster
around central value.
This is called central tendency of that group.
This central value is known as a average.
7. The Mean
The most commonly used
measure of central tendency is
called the mean ( denoted
for a sample, and µ for a
population )
The mean is the same of what
many of us call the ‘average’,
and it is calculated in the
following manner .
X
Population
Sample
x
N
x
x
n
µ =
=
∑
∑
8. Arithmetic mean
It is commonly used measure of central
tendency.
It is sum all observations divided by number
of observations
9. For ungrouped data
Mean of ‘n’ observations x1,x2…….xn is
given by
A.M.= X1+X2+…….+Xn
n
= sum of observations
Number of observations
11. MERITS OF A.M.
it is easy to calculate and understand.
it is based on all observations.
it is familiar to common man and rigidly defined.
it is capable of further mathematical treatment.
it is least affected by sampling fluctuations hence
more stable.
12. DEMERITS OF A.M.
Used only for quantitative data not for
qualitative data like caste, religion, sex.
Unduly affected by extreme observation.
Can’t be used open ended frequency
distribution.
sometimes A.M may not be an observation in
data.
Can’t be determined graphically.
13. GEOMETRIC MEAN(GM)
When data contains few extremely large or small
values in such case arithmetic mean is unsuitable
for data
GM of n observation is defined as ‘n’th root of the
product of n observation.
Simple arithmetic mean of the logarithmic value of
individual values.
logarithmic value of this log is the geometric mean
14. HARMONIC MEAN:
It is reciprocal of arithmetic mean of
reciprocal observations.
15. FOR THE NUMERICAL VALUES OF 1,2,3,4,5, CALCULATE
AND COMPARE THE AM , GM , HM .
AM = 1+2+3+4+5 = 15 = 3.0
5 5
GM = 1/5(log1+log2+log3+log4+log5)
= 1/5(0+0.3010+0.4771+0.6020+0.6989)
= 1/5(2.07918) = 0.415836
= antilog 0.415836 = 2.60517
HM = 1 = 5 =2.242
1/5(1/1+1/2+1/3+1/4+1/5) 2.23
16. The Median
Median Location = N + 1
2
The median is the point corresponding to the score that lies in
the middle of the distribution ( i.e., there are as many data
points above the median as there are below the median ).
To find the median, the data points must first be sorted into
either ascending or descending numerical order.
The position of the median value can then be calculated using
the following formula:
17. EXAMPLE
MedianMedian – the middle number in a
set of ordered numbers.
4, 5, 6 ,7,8
Median = 6Median = 6
18. How to Find the Median in a Group of
Numbers
Step 1 – Arrange the numbers in
order from least to greatest.
21, 18, 24, 19, 27
18, 19, 21, 24, 27
19. How to Find the Median in a Group of
Numbers
Step 2 – Find the middle
number.
21, 18, 24, 19, 27
18, 19, 21, 24, 27
20. How to Find the Median in a Group of
Numbers
Step 2 – Find the middle
number.
18, 19, 21, 24, 27
This is your median number.
21. How to Find the Median in a Group of
Numbers
Step 3 – If there are two middle
numbers, find the mean of these two
numbers.
18, 19, 21, 25, 27, 28
22. How to Find the Median in a Group of
Numbers
Step 3 – If there are two middle
numbers, find the mean of these two
numbers.
21+ 25 = 46
2)46
23 median
23. What is the median of these
numbers?
16, 10, 7
10
7, 10, 16
24. What is the median of these numbers?
29, 8, 4, 11, 19
11
4, 8, 11, 19, 29
25. What is the median of these numbers?
31, 7, 2, 12, 14, 19
13
2, 7, 12, 14, 19, 31
12 + 14 = 26 2) 26
26. What is the median of these
numbers?
53, 5, 81, 67, 25, 78
60
53 + 67 = 120 2) 120
5, 25, 53, 67, 78, 81
27. Merits of Median
Like mean, median is simple to understand
Median is not affected by extreme items
Median never gives absurd or fallacious
results
Median is specially useful in qualitative
phenomena
28. Limitations
It is not suitable for algebraic treatment
The arrangement of the items in the ascending
order or descending order becomes very
tedious sometimes
It cannot be used for computing other
statistical measures such as S.D or correlation
29. The Mode
The mode is simply the value of the relevant variable
that occurs most often (i.e., has the highest
frequency) in the sample
Note that if you have done a frequency histogram,
you can often identify the mode simply by finding
the value with the highest bar.
Modes in particular are probably best applied to
nominal data
30. Definition
A la modeA la mode – the most popular
or that which is in fashion.
Baseball caps are a la mode today.
31. How to Find the Mode in a Group of
Numbers
Step 1 – Arrange the numbers in
order from least to greatest.
21, 18, 24, 19, 18
18, 18, 19, 21, 24
32. How to Find the Mode in a Group of
Numbers
Step 2 – Find the number that is
repeated the most.
21, 18, 24, 19, 18
18, 18, 19, 21, 24
34. Which number is the mode?
1, 2, 2, 9, 9, 4, 9, 10
9
1, 2, 2, 4, 9, 9, 9, 10
35. Which number is the mode?
22, 21, 27, 31, 21, 32
21
21, 21, 22, 27, 31, 32
36. Mode
Advantages
Very quick and easy to determine
Is an actual value of the data
Not affected by extreme scores
Disadvantages
Sometimes not very informative (e.g. cigarettes smoked in
a day)
Can change dramatically from sample to sample
Might be more than one (which is more representative?)
37. Formula for average of grouped data or
data assembled in frequency distribution
Class interval
Of weight(kg)
Middle value of
Xi
Frequency
Fi
Cumulative
frequency fiXi
45-50 47.5 2 2 2(47.5)=95
50-55 52.5 3 5 3(52.5)=157.5
55-60 57.5 6 11 6(57.5)=345
60-65 62.5 4 15 4(62.5)=250
65-70 67.5 6 21 6(67.5)=405
70-75 72.5 4 25 4(72.5)=290
75-80 77.5 5 30 5(77.5)=387.5
total 30 30 1930
38. ARITHMETIC MEAN
1
1
K
i i
i
N
i
i
X f
X
f
=
•
=
=
∑
∑
WHERE Xi = midpoint of the ith class interval
fi = frequency of the ith class interval
N = sum of the frequencies
39. MEDIAN
median = I+N/2-CFxh
f
I = lower boundary of median class
N = total frequency
C.F = less than cumulative frequency of the class
preceding the median class
f = frequency of median class
h = class width
41. •THERE ARE TWO CLASS INTERVALS WITH MAXIMUM FREQUENCY
•THEY ARE 55-60 AND 65-70.
So for first time, l = 55 , fm = 6 , f1 = 3 , h = 5 , f2 = 4
now substituting these values , we get
1 st mode = 55 + (6-3)5 =55 +3 = 58
12-3-4
42. RULES OF THUMB
“ALWAYS USE MEAN UNLESS IT IS
CONTRAINDICATED.MEAN IS CONTRAINDICATED
WHEN ETREME VALUES ARE PRESENT.IN A RARE
CASE WHEN INTEREST IS SPECIFICALLY IN
MOST COMMON VALUE, USE MODE. IT MAY BE
ADDED AS A PASSING REFERENCE THAT , FOR A
SET OF DATA , MEAN AND MEADIAN ARE
UNIQUE, i.e. THERE IS ONLY ONE VALUE
ASSOCIATED WITH THESE MEASUREA ,BUT
MODE CAN BE MORE THAN ONE.”