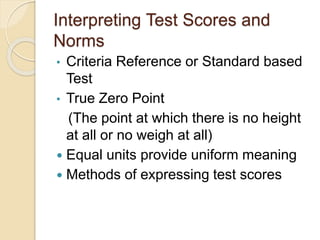
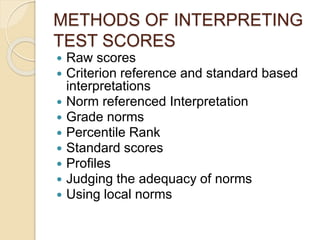
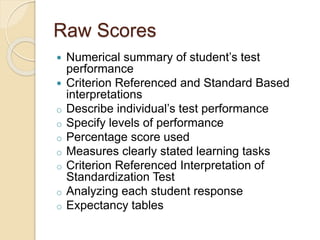
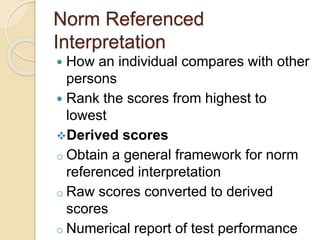
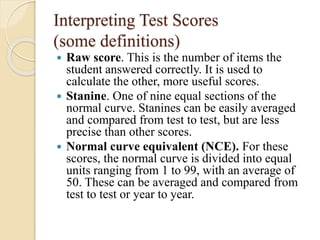
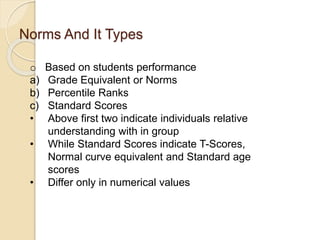
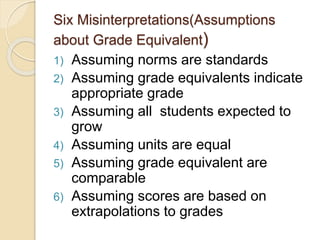
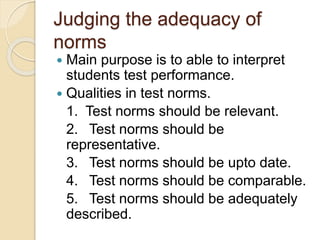
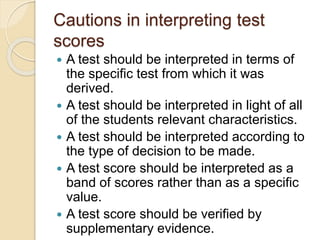
The document discusses various methods for interpreting test scores, including raw scores, criterion-referenced interpretations, norm-referenced interpretations, grade norms, percentile ranks, standard scores, and profiles. It defines these terms and explains how to apply them, such as comparing an individual's performance to others through percentile ranks or measuring how far a score is from the average using standard deviations for standard scores. The document cautions that test scores should be interpreted based on the specific test and characteristics of the student, and verified with other evidence, not viewed as a single value.

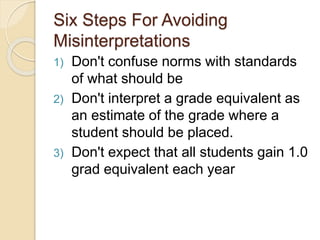
![Percentile Rank
at or below . . .
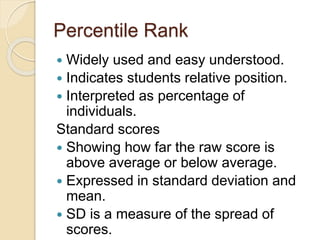
Percentiles and Percentile Rank
◦ Definition: % of cases “at or below”
◦ As we noted earlier, these two terms are different
conceptually, however, in practice often both terms are
used interchangeably.
◦ Strengths:
Easy to describe
Easy to compute
◦ Weaknesses
Confusion with a “percentage-right score”
Inequality of units [see next slide]
15](https://image.slidesharecdn.com/sixstepsforavoidingmisinterpretations-150226094054-conversion-gate01/85/Six-steps-for-avoiding-misinterpretations-15-320.jpg)


![Norms[1]](https://cdn.slidesharecdn.com/ss_thumbnails/norms1-110821093015-phpapp01-thumbnail.jpg?width=640&height=640&fit=bounds)


