Data Approximation in Mathematical Modelling Regression Analysis and Curve Fi...Dr.Summiya Parveen
Outline of the lecture:
Introduction of Regression
Application of Regression
Regression Techniques
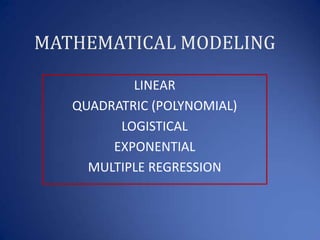
Types of Regression
Goodness of fit
MATLAB/MATHEMATICA implementation with some example
Regression analysis is a form of predictive modelling technique which investigates the relationship between a dependent (target) and independent variable (s) (predictor). This technique is used for forecasting, time series modelling and finding the casual effect relationship between the variables. Regression analysis is an important tool for modelling and analysing data. Here, we fit a curve / line to the data points in such a manner that the differences between the distances of data points from the curve or line is minimized.
By DR. SUMMIYA PARVEEN
Data Approximation in Mathematical Modelling Regression Analysis and Curve Fi...Dr.Summiya Parveen
Outline of the lecture:
Introduction of Regression
Application of Regression
Regression Techniques
Types of Regression
Goodness of fit
MATLAB/MATHEMATICA implementation with some example
Regression analysis is a form of predictive modelling technique which investigates the relationship between a dependent (target) and independent variable (s) (predictor). This technique is used for forecasting, time series modelling and finding the casual effect relationship between the variables. Regression analysis is an important tool for modelling and analysing data. Here, we fit a curve / line to the data points in such a manner that the differences between the distances of data points from the curve or line is minimized.
By DR. SUMMIYA PARVEEN
Applied Numerical Methods Curve Fitting: Least Squares Regression, InterpolationBrian Erandio
Correction with the misspelled langrange.
and credits to the owners of the pictures (Fantasmagoria01, eugene-kukulka, vooga, and etc.) . I do not own all of the pictures used as background sorry to those who aren't tagged.
The presentation contains topics from Applied Numerical Methods with MATHLAB for Engineers and Scientist 6th and International Edition.
Least Square Optimization and Sparse-Linear SolverJi-yong Kwon
Short slide that explains about the least square problem and its practical solution, including Poisson Image editing example and brief introduction of sparse linear solver.
This Presentation Is Specially Made For Those Engineering Students Who are In Gujarat Technological University. This Presentation Clears Your All Doubts About Basics Fundamentals of Numerical Integration. Also You Will Learn Different Types Of Error Formula To Solve the Numerical Integration Sum.
Subject Title: Engineering Numerical Analysis
Subject Code: ID-302
Contents of this chapter:
Mathematical preliminaries,
Solution of equations in one variable,
Interpolation and polynomial Approximation,
Numerical differentiation and integration,
Initial value problems for ordinary differential equations,
Direct methods for solving linear systems,
Iterative techniques in Matrix algebra,
Solution of non-linear equations.
Approximation theory;
Eigen values and vector;
Comparing the methods of Estimation of Three-Parameter Weibull distributionIOSRJM
Weibull distribution has many applications in engineering and plays an important role in reliability. Estimation of the location, scale and shape parameters of this distribution for both censored and non censored samples were considered by several authors. In this paper we compare Graphical oriented methods, “trial and error” approach, the approach of Jiang/Murthy and Maximum likelihood method developed by Bain & Engelhard for sample sets containing uncensored and censored sample. Importance of each method is discussed.
YouTube Link: https://youtu.be/UoHu27xoTyc
** Machine Learning Engineer Masters Program: https://www.edureka.co/machine-learning-certification-training **
This Edureka PPT on Least Squares Regression Method will help you understand the math behind Regression Analysis and how it can be implemented using Python.
Follow us to never miss an update in the future.
YouTube: https://www.youtube.com/user/edurekaIN
Instagram: https://www.instagram.com/edureka_learning/
Facebook: https://www.facebook.com/edurekaIN/
Twitter: https://twitter.com/edurekain
LinkedIn: https://www.linkedin.com/company/edureka
Castbox: https://castbox.fm/networks/505?country=in
Linear regression [Theory and Application (In physics point of view) using py...ANIRBANMAJUMDAR18
Machine-learning models are behind many recent technological advances, including high-accuracy translations of the text and self-driving cars. They are also increasingly used by researchers to help in solving physics problems, like Finding new phases of matter, Detecting interesting outliers
in data from high-energy physics experiments, Founding astronomical objects are known as gravitational lenses in maps of the night sky etc. The rudimentary algorithm that every Machine Learning enthusiast starts with is a linear regression algorithm. In statistics, linear regression is a linear approach to modelling the relationship between a scalar response (or dependent variable) and one or more explanatory variables (or independent
variables). Linear regression analysis (least squares) is used in a physics lab to prepare the computer-aided report and to fit data. In this article, the application is made to experiment: 'DETERMINATION OF DIELECTRIC CONSTANT OF NON-CONDUCTING LIQUIDS'. The entire computation is made through Python 3.6 programming language in this article.
A TRIANGLE-TRIANGLE INTERSECTION ALGORITHM csandit
The intersection between 3D objects plays a prominent role in spatial reasoning, geometric
modeling and computer vision. Detection of possible intersection between objects can be based
on the objects’ triangulated boundaries, leading to computing triangle-triangle intersection.
Traditionally there are separate algorithms for cross intersection and coplanar intersection.
There is no single algorithm that can intersect both types of triangles without resorting to
special cases. Herein we present a complete design and implementation of a single algorithm
independent of the type of intersection. Additionally, this algorithm first detects, then intersects
and classifies the intersections using barycentric coordinates. This work is directly applicable to
(1) Mobile Network Computing and Spatial Reasoning, and (2) CAD/CAM geometric modeling
where curves of intersection between a pair of surfaces is required for numerical control (NC)
machines. Three experiments of the algorithm implementation are presented as a proof this
feasibility.
Developing visual material can help to recall memory and also be a quick way to show lots of information. Visualization helps us remember (like when we try to picture where we’ve parked our car, and what's in our cupboards when writing a shopping list). We can create diagrams and visual aids depicting module materials and put them up around the house so that we are constantly reminded of our learning
MIXTURES OF TRAINED REGRESSION CURVES MODELS FOR HANDWRITTEN ARABIC CHARACTER...gerogepatton
In this paper, we demonstrate how regression curves can be used to recognize 2D non-rigid handwritten shapes. Each shape is represented by a set of non-overlapping uniformly distributed landmarks. The underlying models utilize 2nd order of polynomials to model shapes within a training set. To estimate the regression models, we need to extract the required coefficients which describe the variations for a set of shape class. Hence, a least square method is used to estimate such modes. We proceed then, by training these coefficients using the apparatus Expectation Maximization algorithm. Recognition is carried out by finding the least error landmarks displacement with respect to the model curves. Handwritten isolated Arabic characters are used to evaluate our approach.
Dear students get fully solved assignments
Send your semester & Specialization name to our mail id :
help.mbaassignments@gmail.com
or
call us at : 08263069601
For more info visit us at: http://www.siliconmentor.com/
Support vector machines are widely used binary classifiers known for its ability to handle high dimensional data that classifies data by separating classes with a hyper-plane that maximizes the margin between them. The data points that are closest to hyper-plane are known as support vectors. Thus the selected decision boundary will be the one that minimizes the generalization error (by maximizing the margin between classes).
Biological screening of herbal drugs: Introduction and Need for
Phyto-Pharmacological Screening, New Strategies for evaluating
Natural Products, In vitro evaluation techniques for Antioxidants, Antimicrobial and Anticancer drugs. In vivo evaluation techniques
for Anti-inflammatory, Antiulcer, Anticancer, Wound healing, Antidiabetic, Hepatoprotective, Cardio protective, Diuretics and
Antifertility, Toxicity studies as per OECD guidelines
A Strategic Approach: GenAI in EducationPeter Windle
Artificial Intelligence (AI) technologies such as Generative AI, Image Generators and Large Language Models have had a dramatic impact on teaching, learning and assessment over the past 18 months. The most immediate threat AI posed was to Academic Integrity with Higher Education Institutes (HEIs) focusing their efforts on combating the use of GenAI in assessment. Guidelines were developed for staff and students, policies put in place too. Innovative educators have forged paths in the use of Generative AI for teaching, learning and assessments leading to pockets of transformation springing up across HEIs, often with little or no top-down guidance, support or direction.
This Gasta posits a strategic approach to integrating AI into HEIs to prepare staff, students and the curriculum for an evolving world and workplace. We will highlight the advantages of working with these technologies beyond the realm of teaching, learning and assessment by considering prompt engineering skills, industry impact, curriculum changes, and the need for staff upskilling. In contrast, not engaging strategically with Generative AI poses risks, including falling behind peers, missed opportunities and failing to ensure our graduates remain employable. The rapid evolution of AI technologies necessitates a proactive and strategic approach if we are to remain relevant.
The Roman Empire A Historical Colossus.pdfkaushalkr1407
The Roman Empire, a vast and enduring power, stands as one of history's most remarkable civilizations, leaving an indelible imprint on the world. It emerged from the Roman Republic, transitioning into an imperial powerhouse under the leadership of Augustus Caesar in 27 BCE. This transformation marked the beginning of an era defined by unprecedented territorial expansion, architectural marvels, and profound cultural influence.
The empire's roots lie in the city of Rome, founded, according to legend, by Romulus in 753 BCE. Over centuries, Rome evolved from a small settlement to a formidable republic, characterized by a complex political system with elected officials and checks on power. However, internal strife, class conflicts, and military ambitions paved the way for the end of the Republic. Julius Caesar’s dictatorship and subsequent assassination in 44 BCE created a power vacuum, leading to a civil war. Octavian, later Augustus, emerged victorious, heralding the Roman Empire’s birth.
Under Augustus, the empire experienced the Pax Romana, a 200-year period of relative peace and stability. Augustus reformed the military, established efficient administrative systems, and initiated grand construction projects. The empire's borders expanded, encompassing territories from Britain to Egypt and from Spain to the Euphrates. Roman legions, renowned for their discipline and engineering prowess, secured and maintained these vast territories, building roads, fortifications, and cities that facilitated control and integration.
The Roman Empire’s society was hierarchical, with a rigid class system. At the top were the patricians, wealthy elites who held significant political power. Below them were the plebeians, free citizens with limited political influence, and the vast numbers of slaves who formed the backbone of the economy. The family unit was central, governed by the paterfamilias, the male head who held absolute authority.
Culturally, the Romans were eclectic, absorbing and adapting elements from the civilizations they encountered, particularly the Greeks. Roman art, literature, and philosophy reflected this synthesis, creating a rich cultural tapestry. Latin, the Roman language, became the lingua franca of the Western world, influencing numerous modern languages.
Roman architecture and engineering achievements were monumental. They perfected the arch, vault, and dome, constructing enduring structures like the Colosseum, Pantheon, and aqueducts. These engineering marvels not only showcased Roman ingenuity but also served practical purposes, from public entertainment to water supply.
Palestine last event orientationfvgnh .pptxRaedMohamed3
An EFL lesson about the current events in Palestine. It is intended to be for intermediate students who wish to increase their listening skills through a short lesson in power point.
Instructions for Submissions thorugh G- Classroom.pptxJheel Barad
This presentation provides a briefing on how to upload submissions and documents in Google Classroom. It was prepared as part of an orientation for new Sainik School in-service teacher trainees. As a training officer, my goal is to ensure that you are comfortable and proficient with this essential tool for managing assignments and fostering student engagement.
Operation “Blue Star” is the only event in the history of Independent India where the state went into war with its own people. Even after about 40 years it is not clear if it was culmination of states anger over people of the region, a political game of power or start of dictatorial chapter in the democratic setup.
The people of Punjab felt alienated from main stream due to denial of their just demands during a long democratic struggle since independence. As it happen all over the word, it led to militant struggle with great loss of lives of military, police and civilian personnel. Killing of Indira Gandhi and massacre of innocent Sikhs in Delhi and other India cities was also associated with this movement.
Introduction to AI for Nonprofits with Tapp NetworkTechSoup
Dive into the world of AI! Experts Jon Hill and Tareq Monaur will guide you through AI's role in enhancing nonprofit websites and basic marketing strategies, making it easy to understand and apply.
2. Fitting a Curve to a Scatter Plot of Data Points Regression Modeling: From a known set of data points, (x, y), an equation of a curve is developed that “best fits” the points. The least-squares method is used to determine the best fitting equation for the specified data points. Basically, the least-squares regression technique minimizes the squared "errors" between the actual data points and the corresponding points on the curve.
3. Least-Squares Method the sum of the differences in the distances from the point to the line is minimized resulting in an equation that best fits the given data points
4. Linear Regression: Equation of a Line Fit an equation of a line through the points y = mx + b is the result m = slope of the line, b = y-intercept (0, b) Methods to generate the line equation: EXCEL function (Stats -> LnReg) Calculators: TI 83+ Internet Resources Paper and Pencil Method
5. Goodness of Fit A number from 0 to 1.0 (fraction) that indicates how well the curve fits the data 1.0 indicates a perfect fit 0.0 indicates no fit Residual Error: The difference in the predicted value of y and the actual value of y Regression analysis attempts to minimize the residual error.
6. Quadratic Regression Graph of data points generally follow a parabolic path Equation of parabola is a better predictor of the data