Download to read offline
![International Journal of Artificial Intelligence and Applications (IJAIA), Vol.10, No.3, May 2019
DOI : 10.5121/ijaia.2019.10305 49
MIXTURES OF TRAINED REGRESSION CURVES
MODELS FOR HANDWRITTEN ARABIC CHARACTER
RECOGNITION
Abdullah A. Al-Shaher1
1
Department of Computer and Information Systems
College of Business Studies, Public Authority for
Applied Education and Training, Kuwait
ABSTRACT
In this paper, we demonstrate how regression curves can be used to recognize 2D non-rigid handwritten
shapes. Each shape is represented by a set of non-overlapping uniformly distributed landmarks. The
underlying models utilize 2nd order of polynomials to model shapes within a training set. To estimate the
regression models, we need to extract the required coefficients which describe the variations for a set of
shape class. Hence, a least square method is used to estimate such modes. We proceed then, by training these
coefficients using the apparatus Expectation Maximization algorithm. Recognition is carried out by finding
the least error landmarks displacement with respect to the model curves. Handwritten isolated Arabic
characters are used to evaluate our approach.
KEYWORDS
Shape Recognition, Arabic Handwritten Characters, Regression Curves, Expectation Maximization
Algorithm.
1.INTRODUCTION
Shape recognition has been the focus of many researchers for the past seven decades [1] and
attracted many communities in the field of pattern recognition [2], artificial intelligence[3], signal
processing [4], image analysis [5], and computer vision [6]. The difficulties arise when the shape
under study exhibits a high degree in variation: as in handwritten characters [7], digits [8], face
detection [9], and gesture authentication [10]. For a single data, shape variation is limited and
cannot be captured ultimately due to the fact that single data does not provide sufficient information
and knowledge about the data; therefore, multiple existence of data provides better understanding
of shape analysis and manifested by mixture models [11]. Because of the existence of multivariate
data under study, there is always the need to estimate the parameters which describe the data that is
encapsulated within a mixture of shapes.
The literature demonstrates many statistical and structural approaches to various algorithms to
model shape variations using supervised and unsupervised learning [12] algorithms. Precisely, the
powerful Expectation Maximization Algorithm of Dempster [13] has widely been used for such
cases. The EM Algorithm revolves around two step procedures. The expectation E step revolves
around estimating the parameters of a log-likelihood function and passes it to the Maximization M](https://image.slidesharecdn.com/10319ijaia052-190726085303/75/MIXTURES-OF-TRAINED-REGRESSION-CURVES-MODELS-FOR-HANDWRITTEN-ARABIC-CHARACTER-RECOGNITION-1-2048.jpg)
![International Journal of Artificial Intelligence and Applications (IJAIA), Vol.10, No.3, May 2019
50
step. In a maximization (M) step, the algorithm computes parameters maximizing the expected
log-likelihood found on the E step. The process is iterative one until all parameters come to
unchanged. For instance, Jojic and Frey [14] have used the EM algorithm to fit mixture models to
the appearances manifolds for faces. Bishop and Winn [15] have used a mixture of principal
components analyzers to learn and synthesize variations in facial appearance. Vasconcelos and
Lippman [16] have used the EM Algorithm to learn queries for content-based image retrieval. In
general, several authors have used the EM algorithm to track multiple moving objects [17]. Revov
et al. [18] have developed a generative model which can be used for handwritten character
recognition. Their method employs the EM algorithm to model the distribution of sample points.
Curves are widely used in research by the computer vision society [1] [2] [3] [4] [5]. Curvatures are
mainly used to distinguish different shapes such as characters [6], digits, faces [2], and topographic
maps [3]. Curve fitting [18][19] is the process of constructing a 2nd order or higher mathematical
function that best fits to a series of landmark points. A related topic is a regression analysis which
stresses on probabilistic conclusion on how uncertainty occurs when fitting a curve to a set of data
landmarks with marginal errors. Regression curves are applied in data visualization [12][13] to
capture the values of a function with missing data [14] and to gain relationship between multiple
variables.
In this paper, we demonstrate how curves are used to recognize 2D handwritten shapes by applying
2nd order of polynomial quadratic function to a set of landmark points presented in a shape. We
then train such curves to capture the optimal characteristics of multiple shapes in the training set.
Handwritten Arabic characters are used and tested in this investigation.
2.REGRESSION CURVES
We would like to extract the best fit modes that describe the shapes under study, hence, multiple
image shapes are required and explained through training sets of class shape ω and complete sets
of shape classes denoted by Ω. Let us assume that each training set is represented by the following
2D training patterns as a long vector
= ( , , . . , , , , , . . , , , , , . . , , ) (1)
Our model here is a polynomial of a higher order.In this example, we choose 2nd
order of quadratic
curves. Consider the following generic form for polynomial of order j
= + + ( ) + ( ) + ⋯ + ( )
= + ( )
(2)
The nonlinear regression above requires the estimation of the coefficients thatbest fit the sample
shape land marks, we approach the least square error between the data y and f(x) in
= ( !) = ( − ( )) + ( − ( )) + ( − ( )) + ( #
− ( # ))
(3)](https://image.slidesharecdn.com/10319ijaia052-190726085303/75/MIXTURES-OF-TRAINED-REGRESSION-CURVES-MODELS-FOR-HANDWRITTEN-ARABIC-CHARACTER-RECOGNITION-2-2048.jpg)

![International Journal of Artificial Intelligence and Applications (IJAIA), Vol.10, No.3, May 2019
52
A =
(
)
)
* + ∑$ ∑$
∑$
∑$
∑$
∑$ ∑$ ∑
#$
,
-
-
.
,
X = / 0,
B = 4
∑$
∑$
∑$
5
(11)
solving X to find the coefficients A, B in
= 16
∗ 2 (12)
The outcome would be the coefficients a0, a1, a2. We follow the similar procedure to find the
coefficient sets of the remaining landmark points.With these coefficients models at hand, it is
possible to project them in order to generate a sample shape similar to those in the training patterns.
The extracted coefficients are then plugged in to a set of corresponding coordinate points which
results in a new shape in
8 = (9 , = ∗ : + ∗ : + : ;
<, 9 ,
= ∗ : + ∗ : + : ;
< , .. , 9 , = ( ) ∗ :=
+ ∗ :=
+ :=;
<)
(13)
3.LEARNING REGRESSION CURVES
It has been acknowledge that when using learning algorithms to train models of suchcase, the
outcome is trained models with superior performance to those of untrained models Bishop [19]. In
this stage, we are concerned with capturing the optimal curve coefficients which describe the
patterns variations under testing; hence, training is required , thereby, fitting the Gaussian mixtures
to curve coefficient models to a set of shape curve patterns. The previous approaches consider
producing variations in shapes in a linear fashion. To obtain more complex shape variations, we
have to proceed by employing non-linear deformation to a set of curve coefficients. Unsupervised
learning is encapsulated in a framework of the apparatus Expectation Maximization EM
Algorithm.The idea is borrowed from Cootes[20] who was the pioneer in constructing point
distribution models; however, the algorithm introduced by Cootes[20] is transformed to learn
regression curves coefficientsαtsimilar to that approach of AlShaher [21]. Suppose that a set of
curve coefficients αt for a set of training patterns is t = (1 … T ) where T is the complete set of
training curves is represented in a long vector of coefficients :
>: = ( : , : , : ;
, : , : , : ;
, . . . , :?@ :?@
) (14)
The mean vector of coefficient patterns is represented by
A =
1
+
>:
$
:
(15)](https://image.slidesharecdn.com/10319ijaia052-190726085303/75/MIXTURES-OF-TRAINED-REGRESSION-CURVES-MODELS-FOR-HANDWRITTEN-ARABIC-CHARACTER-RECOGNITION-4-2048.jpg)
![International Journal of Artificial Intelligence and Applications (IJAIA), Vol.10, No.3, May 2019
54
TF
(KL )
=
1
+
C(>:|AF
(K)
, ∑F
(K )
)
$
:
(20)
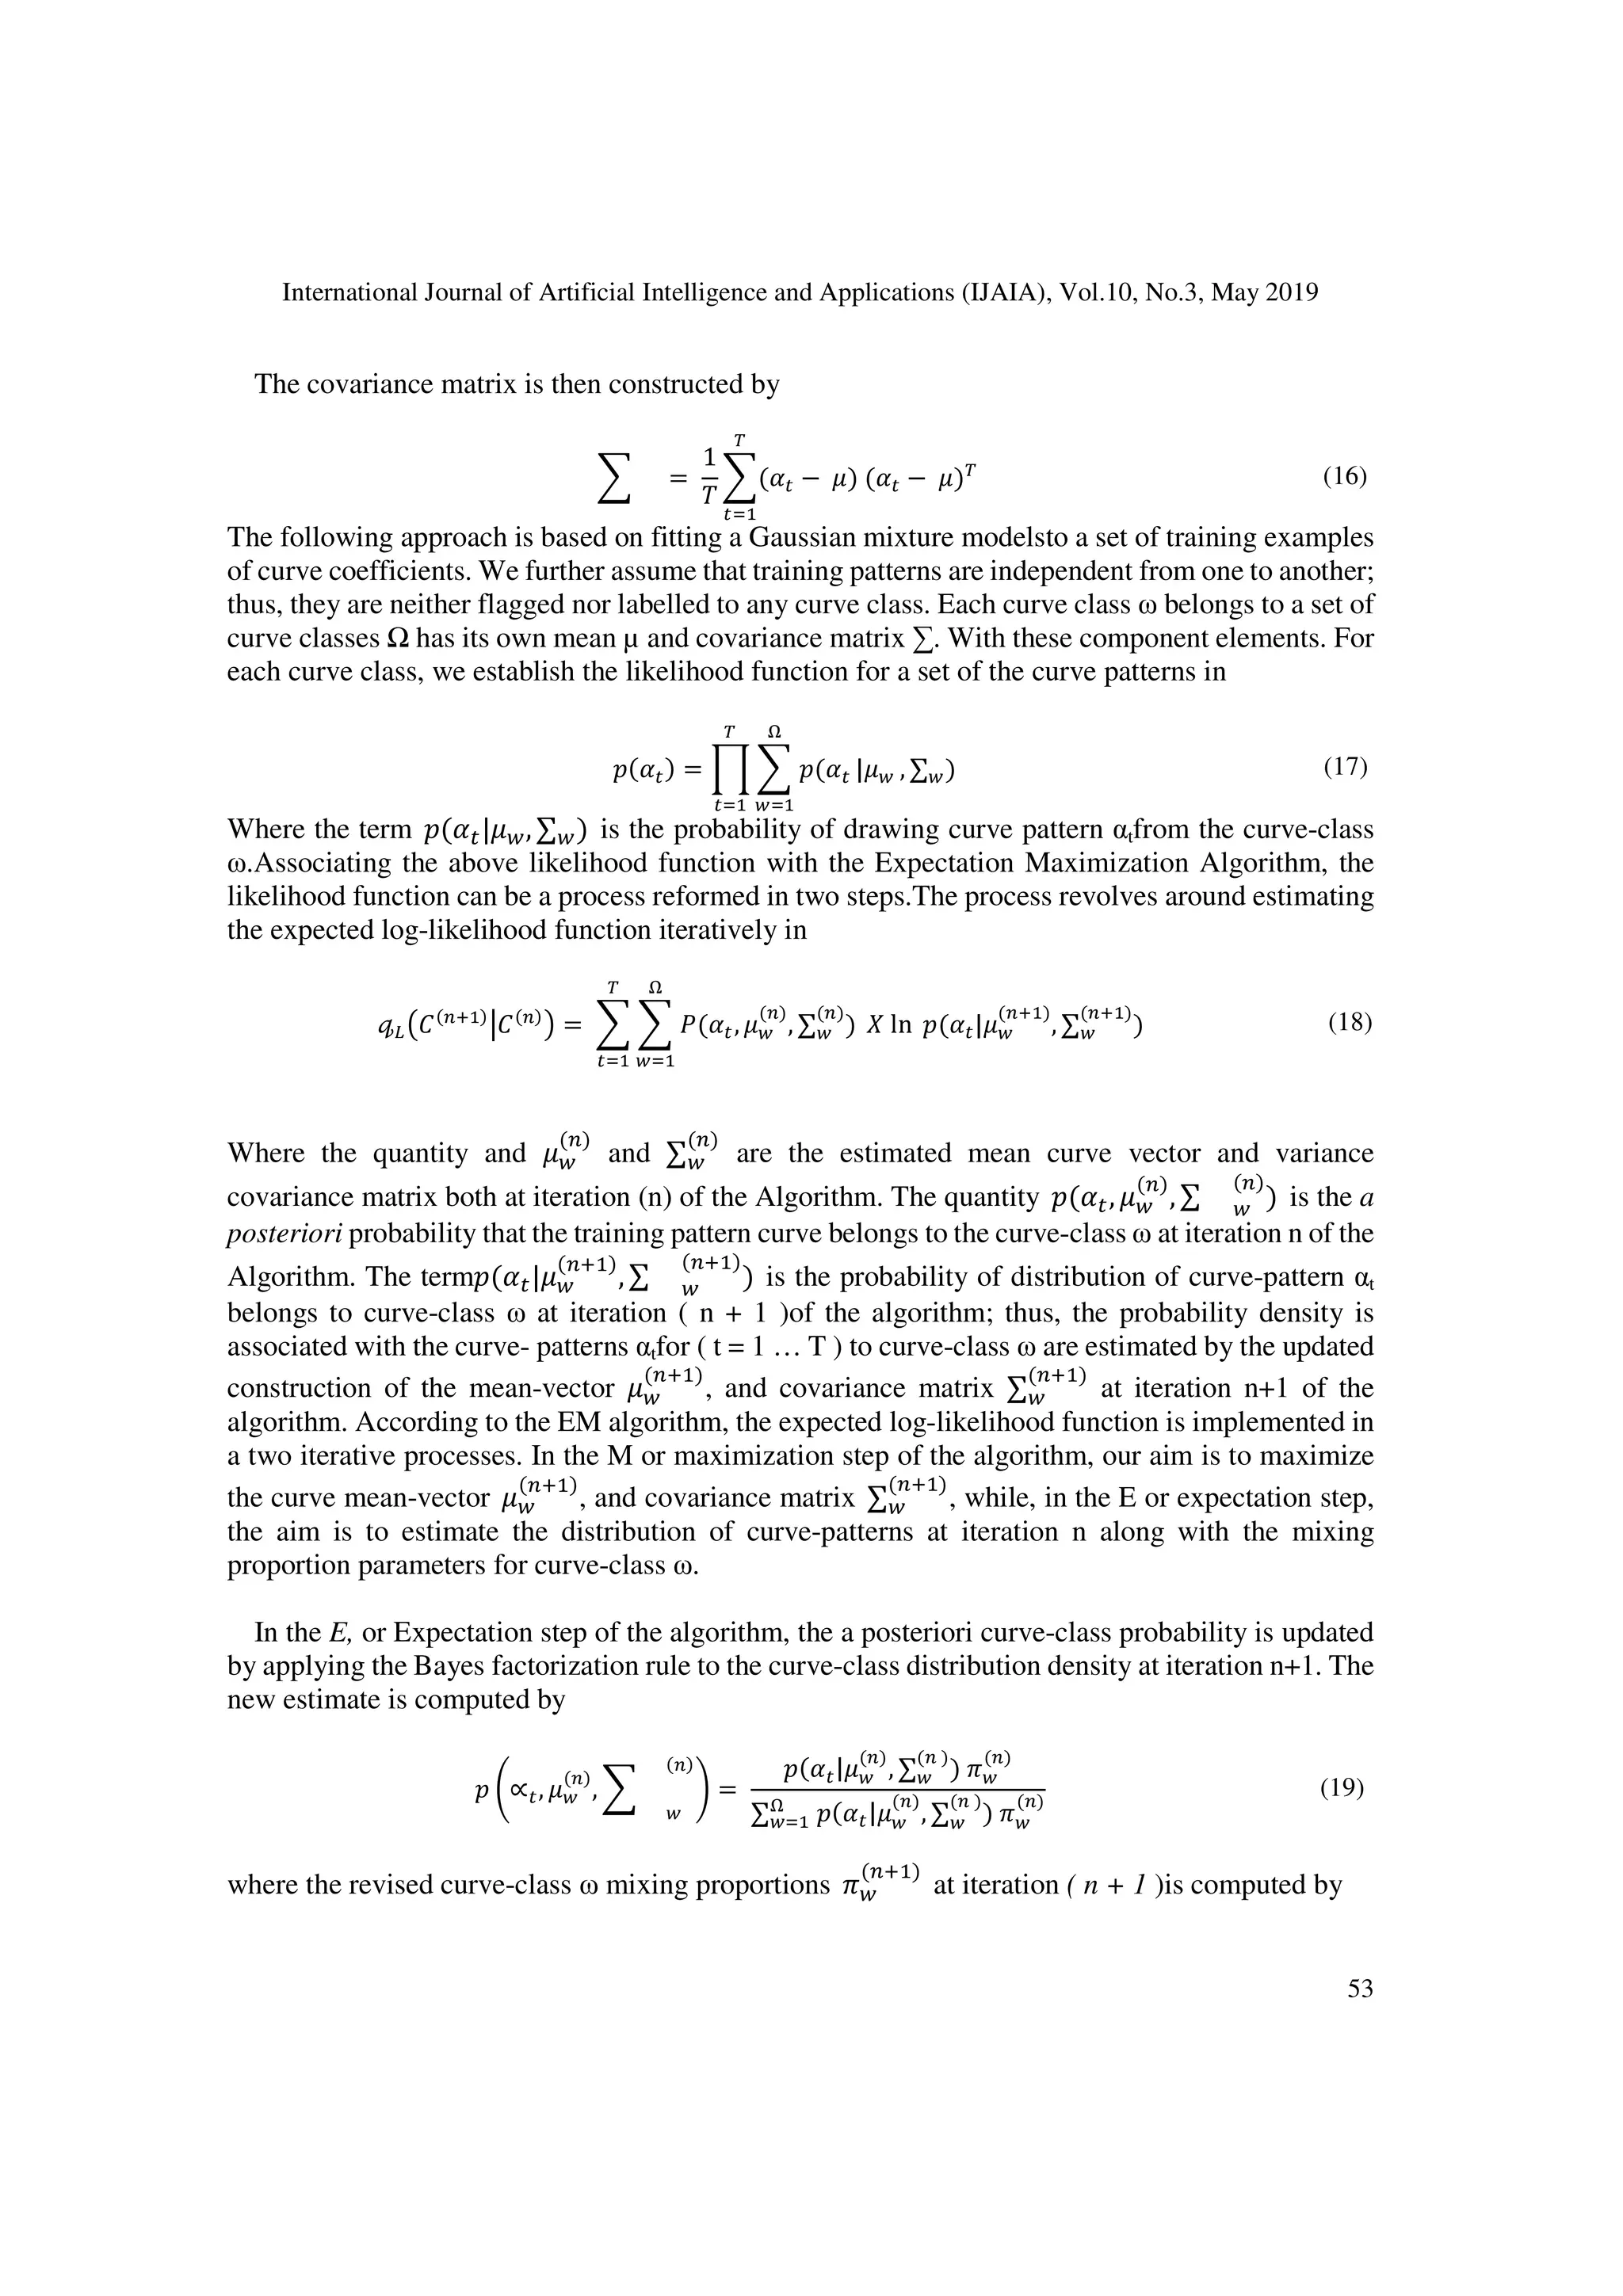
With that at hand, the distributed curve-pattern αt to the class-curve ω is Gaussian distribution and
is classified according to
C Q>:UAF
(K)
,
F
(K)
S =
1
(2T)IW| ∑ F
(K)
|
exp /−
1
2
>: − AF
(K) $
Q
F
(K)
S
6
(>: − AF
(K)
)0 (21)
In the M, or Maximization step, our goal is to maximize the curve-class ω parameters. The updated
curve mean-vector AF
(KL )
estimate is computed using the following
AF
(KL )
= C(>:, AF
(K)
, ∑F
(K)
)>:
$
:
(22)
And the new estimate of the curve-class covariance matrix is weighted by
∑F
(KL )
= C Q>:, AF
(K)
,
F
(K)
S
$
:
(>: − AF
(K)
) >: − AF
(K) $
(23)
Both E, and M steps are iteratively converged, the outcome of the learning stage is a set of
curve-class ω parameters such as AF
(K)
[ ∑F
(K )
, hence the complete set of all curve-class Ω are
computed and ready to be used for recognition.
With the stroke and shape point distribution models to hand, our recognition method proceeds in a
hierarchical manner.
4.RECOGNITION
In this stage, we focus on utilizing the parameters extracted from the learning phase to obtain in
shape recognition. Here, we assume that the testing shapes
() = ( :?
K
!
]
:
, :?
), ^ℎ (` = 1 . . [), ( = 1 . . ) (24)
Hence, each testing pattern is represented by
a: = ( : , : , : , : , … :?
, :?
) for (t = 1 .. X ) (25)
Such testing patterns are classified according to computing the new point position of the testing
data χ after projecting the sequence of curve-coefficients by](https://image.slidesharecdn.com/10319ijaia052-190726085303/75/MIXTURES-OF-TRAINED-REGRESSION-CURVES-MODELS-FOR-HANDWRITTEN-ARABIC-CHARACTER-RECOGNITION-6-2048.jpg)
![International Journal of Artificial Intelligence and Applications (IJAIA), Vol.10, No.3, May 2019
57
200 187 13 93.5% 200 181 19
90.5
%
200 196 4 98% 200 190 10 95%
200 180 20 90% 200 182 18 91%
200 178 22 89% 200 193 7
96.5
%
6.CONCLUSION
In this paper, we have proved how Regression Curves can be utilized to model the variation of
Handwritten Arabic characters. A 2nd order of Polynomials curves are injected along the skeleton
of the proposed shape under study, where the appropriate set of curve-coefficients which describe
the shape were extracted. We, then have used the Apparatus of the Expectation Maximization
Algorithm to train the set of extracted set of curve-coefficients within a probabilistic framework to
capture the optimal shape variations coefficients. The set of best fitted parameters are then
projected to recognize handwritten shapes using Bayes rule of factorization. The proposed
approach has been evaluated on sets of Handwritten Arabic Shapes for multiple different writers by
which we have achieved a recognition rate of nearly 94% on corrected registered shape classes.
7. ACKNOWLEDGMENT
I would like to express my sincere gratitude to the Public Authority for Applied Education and
Training ( Research Department ) for their full funding to this research. Research project number
BS-17-06 under the title "Arabic Character Recognition". Their kind support including hardware,
software, books, and conference fees allowed me to investigate and conduct this research with
significant results. Their attention permitted me to contribute a good result to the literature of
Pattern Recognition field specifically in recognizing handwritten Arabic characters.
REFERENCES
[1] J. Wood, "Invariant pattern recognition: A review," Pattern Recognition, vol. 29, no. 1, 1996, 1-17.
[2] Anil, K. Jain,Robert P.W. Duin, and Jianchang Mao:“Statistical Pattern Recognition: A Review”, IEEE
Pattern Analysis and Machine Intelligence, vol 22, No. 1, PP 4-37, 2000.
[3] P.F. Baldi and K. Hornik, "Learning in linear neural networks: A survey," IEEE Transactions on Neural
Networks, vol. 6, no. 4, 1995, 837-858.
[4] T.Y. Kong and A. Rosenfeld, "Digital topology: introduction and survey," Computer Vision, Graphics,
and Image Processing, vol. 48, no. 3, pp. 357-393, 1989.
[5] T.R. Reed and J.M.H. Dubuf, "A review of recent texture segmentation and feature extraction
techniques," CVGIP - Image Understanding, vol. 57, no. 3, pp. 359-372, 1993.
[6] S. Sarkar and K.L. Boyer, "Perceptual organization in computer vision - a review and a proposal for a
classifactory structure", IEEE Transactions on Systems Man and Cybernetics, vol. 23, no. 2, 1993,
382-399.](https://image.slidesharecdn.com/10319ijaia052-190726085303/75/MIXTURES-OF-TRAINED-REGRESSION-CURVES-MODELS-FOR-HANDWRITTEN-ARABIC-CHARACTER-RECOGNITION-9-2048.jpg)
![International Journal of Artificial Intelligence and Applications (IJAIA), Vol.10, No.3, May 2019
58
[7] Lorigo L. M., Govindaraju V., “Offline Arabic Handwriting Recognition: A Survey”, IEEE Trans
Pattern Anal Mach Intelligence, Vol: 28(5): PP 712-24, 2006.
[8] Ishani Patel, ViragJagtap, Ompriya Kale, “A Survey on Feature Extraction Methods for Handwritten
Digits Recognition”, International Journal of Computer Applications, Vol107, No12, PP 11-17, 2014.
[9] Muhammad Sharif, Farah Naz, Mussarat Yasmin, Muhammad AlyasShahid, AmjadRehman, “Face
Recognition: A Survey”, Journal of Engineering Science and Technology Review, Vol 10, No 2, PP
166-177, 2017.
[10] Rafiqul Zaman Khan, Noor Adnan Ibraheem, “HAND GESTURE RECOGNITION: A LITERATURE
REVIEW “,International Journal of Artificial Intelligence & Applications, Vol.3, No.4, pp 161-174,
2012.
[11] Bruce George Lindsay, Mary L. Lesperance , “A review of semiparametric mixture models”, Journal of
Statistical Planning and Inference, Vol: 47 , No: 1 PP 29-39 , 1995.
[12] Christopher M. Bishop, “Neural Networks for Pattern Recognition”, Clarendon Press, 1995, ISSN
0198538642.
[13] A. Dempster, N. Laird, D. Rubin, Maximum likelihood from incomplete data via the em algorithm, J.
Roy. Statist. Soc. Ser. 39 (1977) 1–38
[14] J. Brendan, N. Jojic, Estimating mixture models of images and inferring spatial transformations using
the em algorithm, IEEE Comput. Vision Pattern Recognition 2 (1999) 416–422.
[15] C. Bishop, J. Winn, Non-linear Bayesian image modelling, Proceedings of Sixth European
[16] N. Vasconcelos, A. Lippman, A probabilistic architecture for content-based image retrieval,
Proceedings of International Conference on Computer Vision and Pattern Recognition, 2000, pp.
216–221.
[17] B. North, A. Blake, Using expectation-maximisation to learn dynamical models from visual data,
Image Vision Computing. 17 (8) (1999) 611–616.
[18] M. Revow, C. Williams, G.E. Hinton, Using generative models for handwritten digit recognition, IEEE
Trans. Pattern Anal. Mach. Intell. 20 (2) (1996) 592–606
[19] Christopher M. Bishop, Pattern Recognition and Machine Learning, Springer Science, and Business
Media, 2006.
[20] T. Cootes, C. Taylor, A mixture model for representing shape variations. Image and Vision Computing,
17(1999) 403-409
[21] AlShaher Abdullah, Hancock Edwin, Learning mixtures of Point Distribution models with the EM
algorithm. Pattern Recognition, 36(2003) 2805-2818.](https://image.slidesharecdn.com/10319ijaia052-190726085303/75/MIXTURES-OF-TRAINED-REGRESSION-CURVES-MODELS-FOR-HANDWRITTEN-ARABIC-CHARACTER-RECOGNITION-10-2048.jpg)

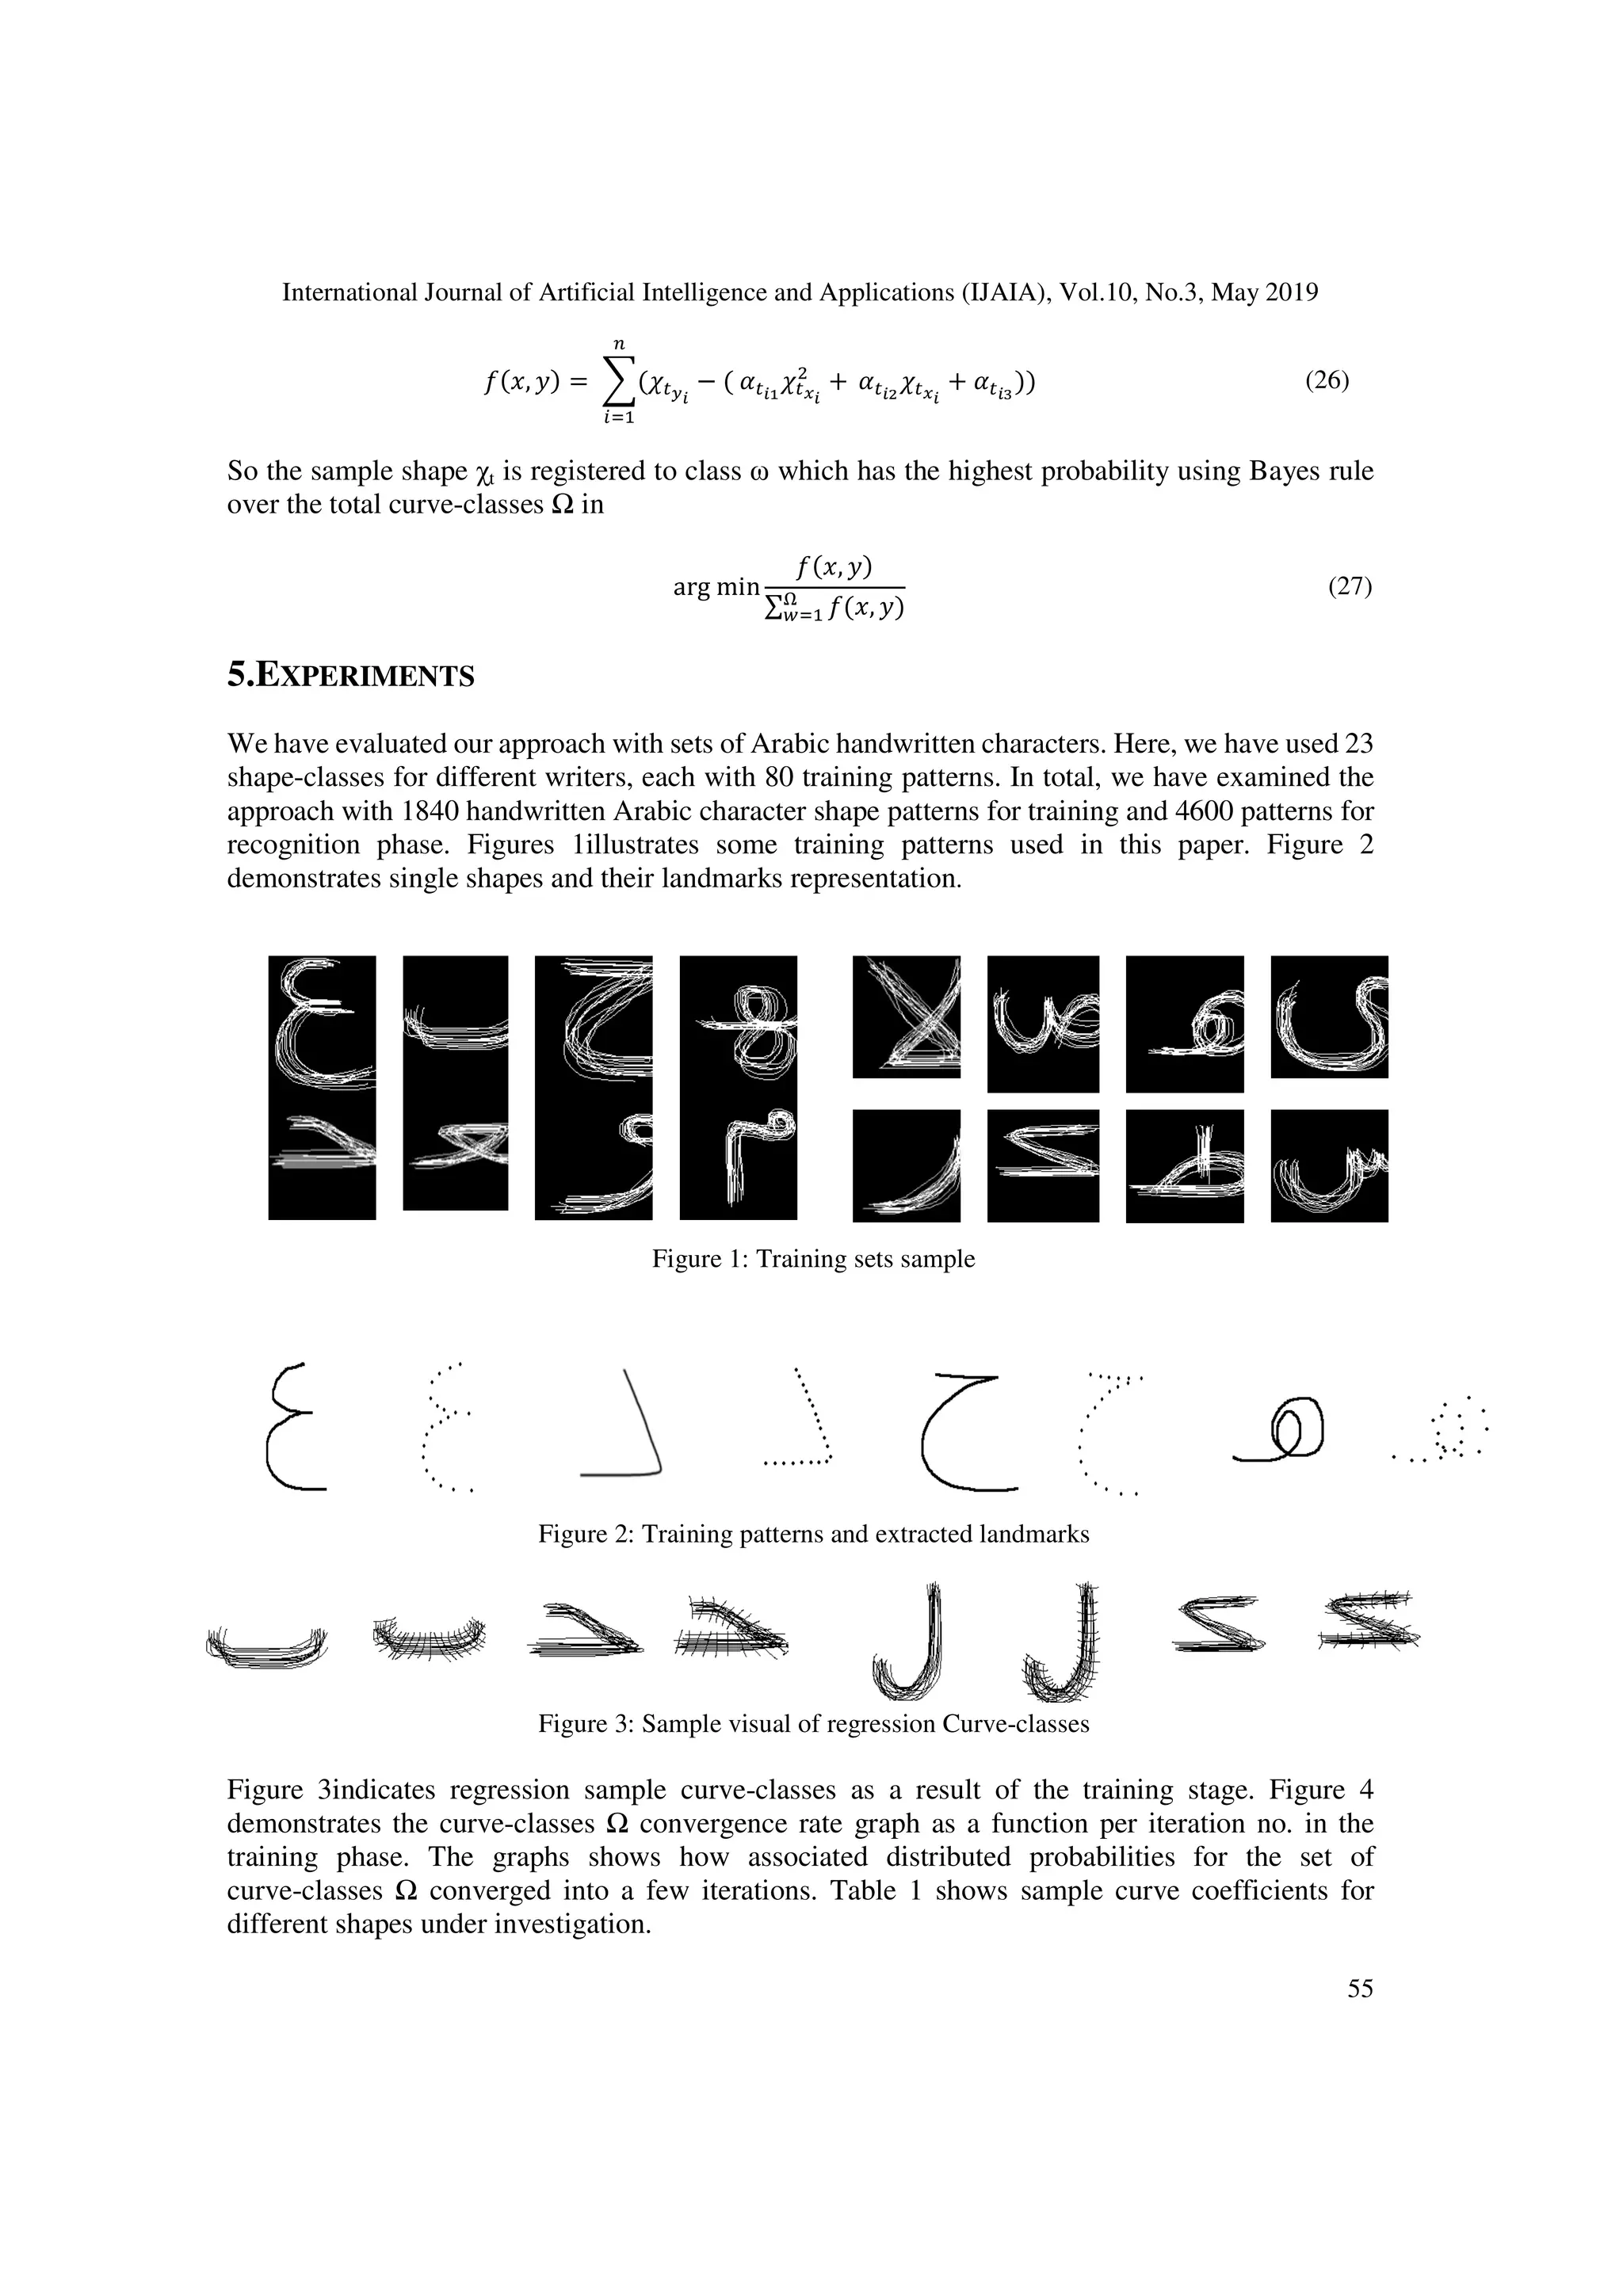
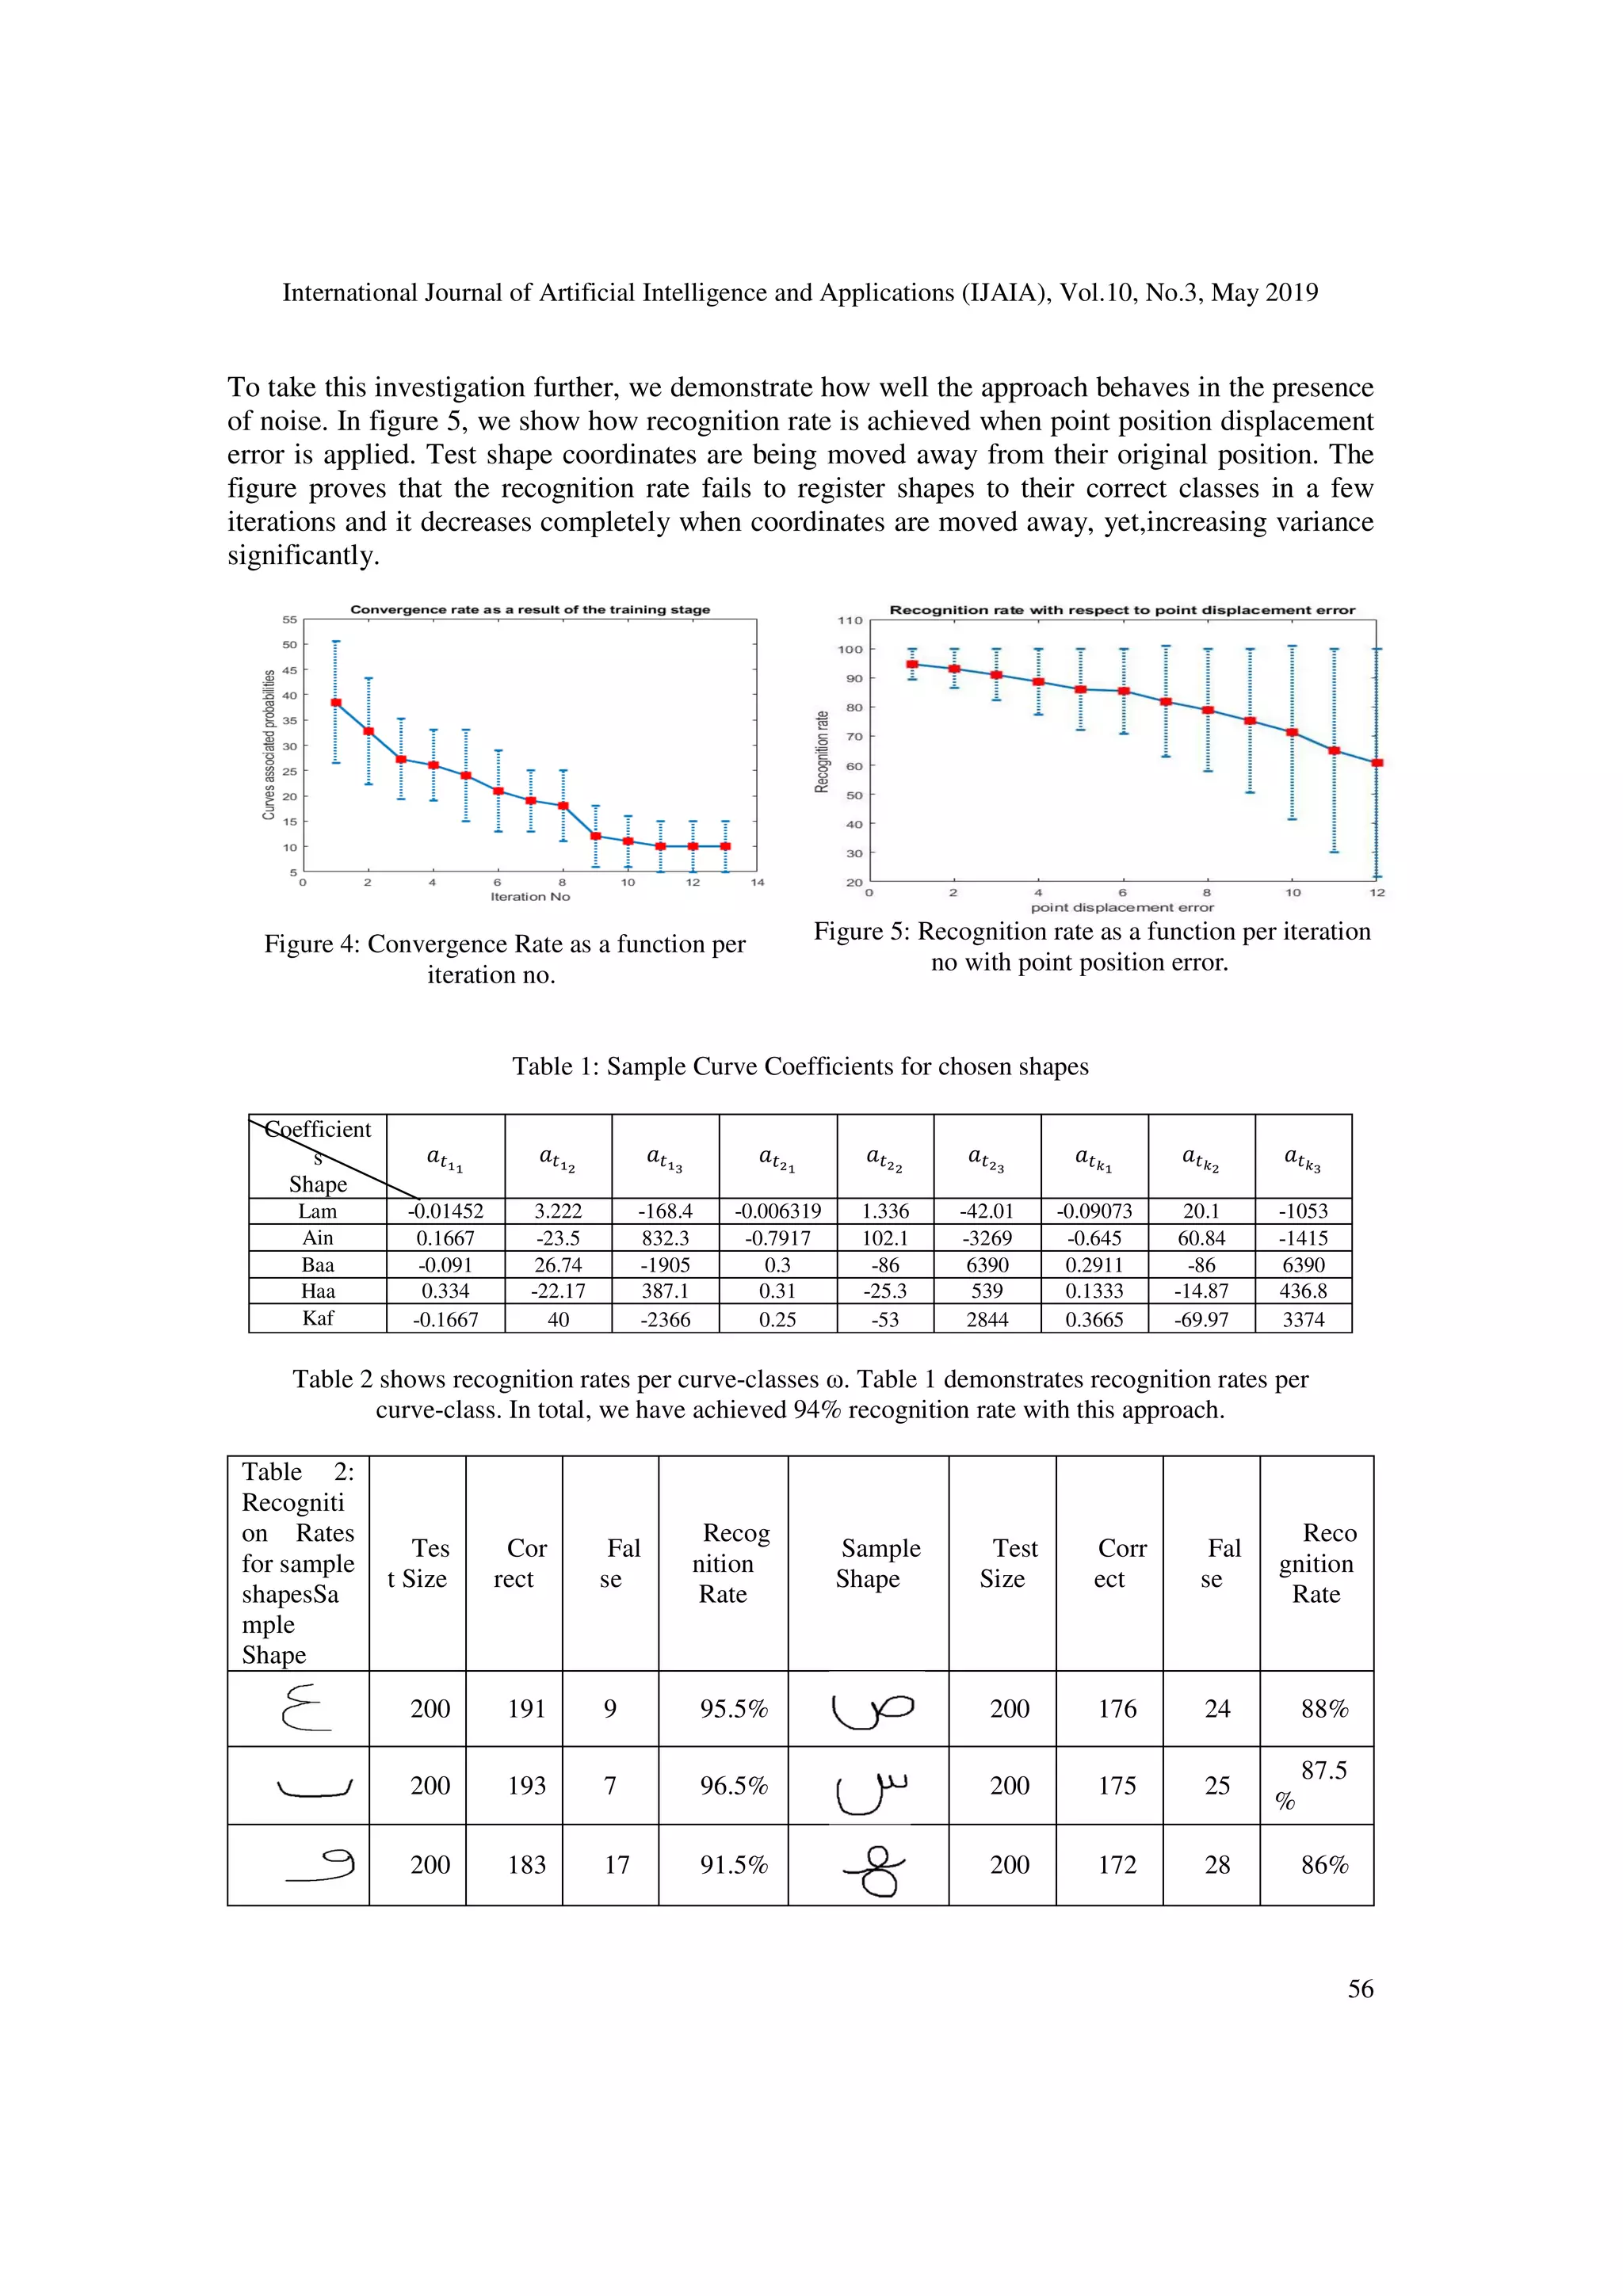
This paper presents a method for recognizing 2D non-rigid handwritten Arabic characters using regression curves modeled by 2nd order polynomials. It employs the expectation maximization algorithm to train regression models based on extracted coefficients from a training set of character shapes. The effectiveness of the approach is evaluated through experiments with a significant number of training and recognition patterns, showcasing its potential in handling variations and noise in handwritten character recognition.