Downloaded 129 times
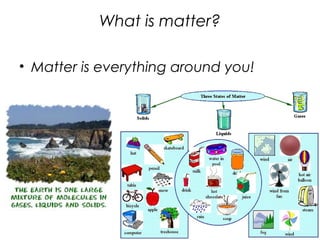
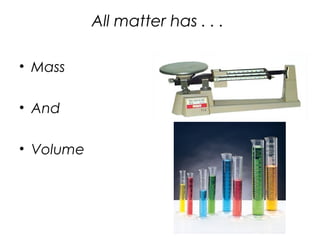
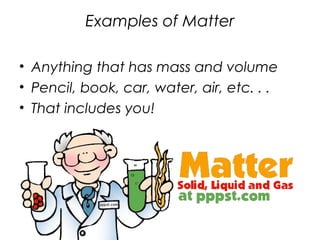
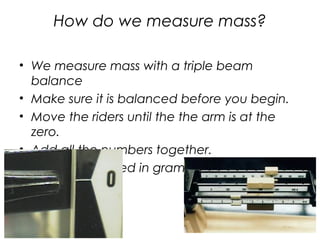
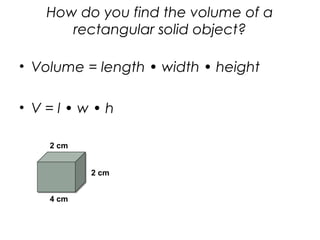
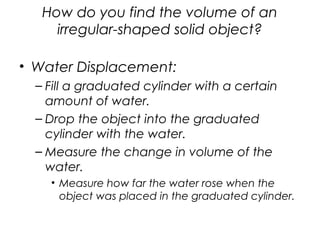
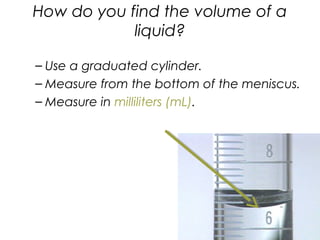
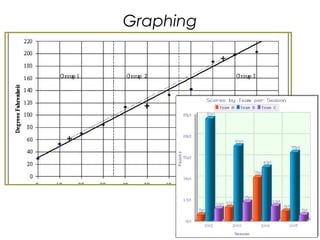
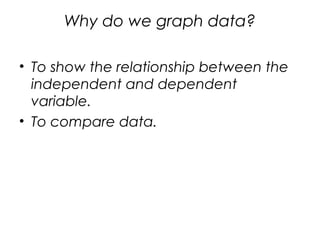
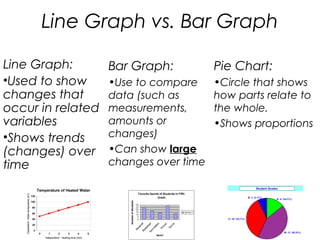

This document defines matter and discusses how to measure its mass and volume. It explains that matter is anything that has mass and takes up space, and provides examples like pencils, books, and cars. Mass is the amount of matter in an object and is measured using a balance scale. Volume is the amount of space an object occupies and can be found using formulas for different shapes or water displacement. Graphs are used to show relationships between variables and different types like line graphs track changes over time while bar graphs compare amounts.


