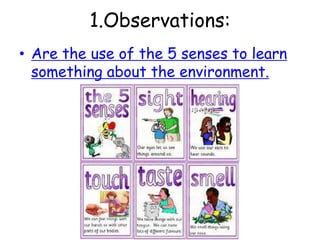
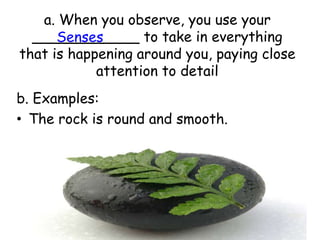
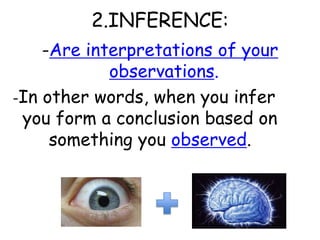
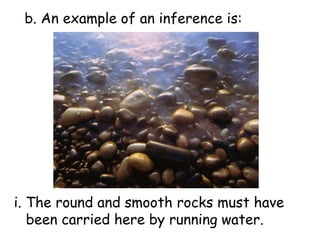
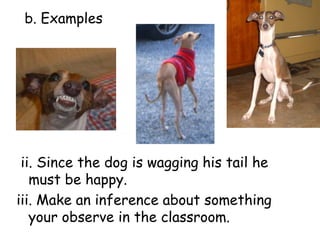
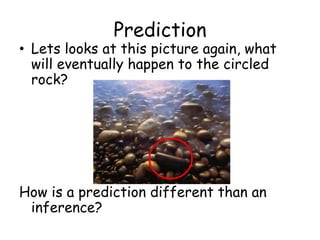
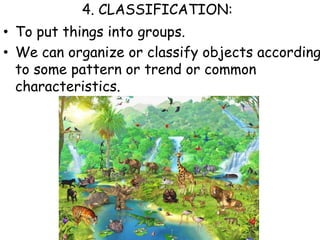
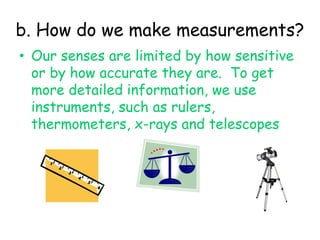
1. The document introduces several key concepts in science including observations, inferences, predictions, classification, measurements, and more. It discusses how scientists use their senses to make observations and then form inferences and predictions.
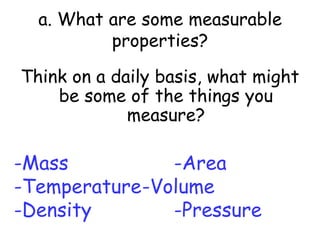
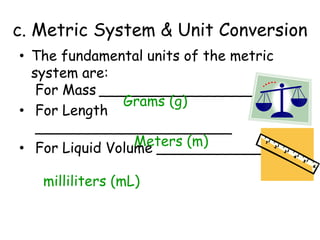
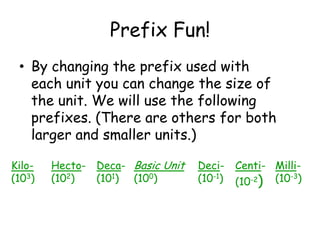
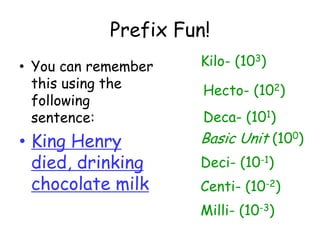
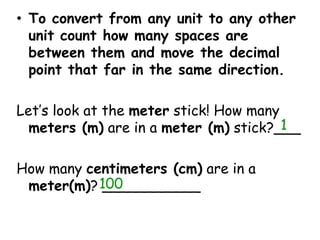
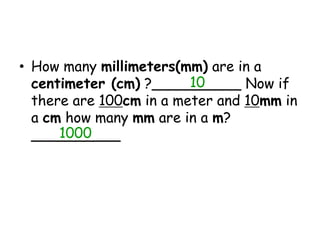
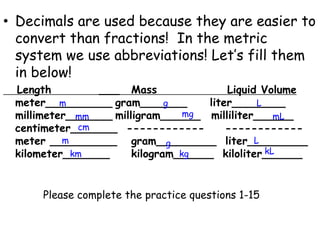
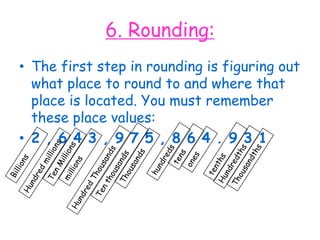
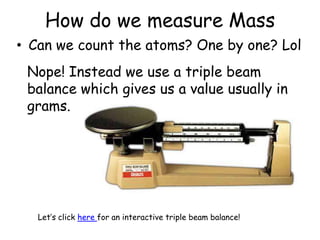
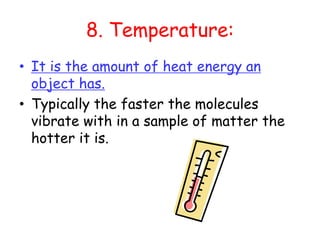
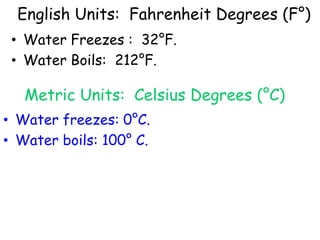
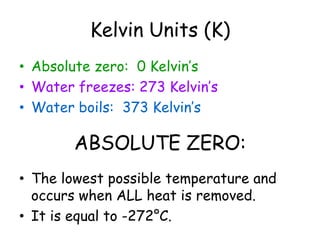
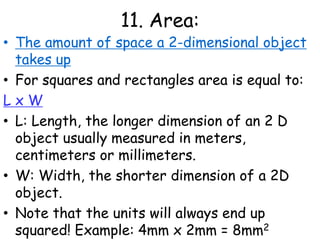
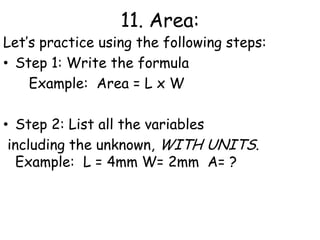
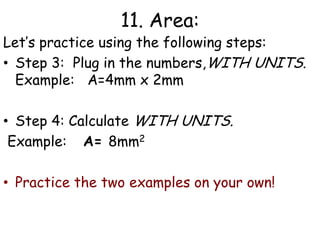
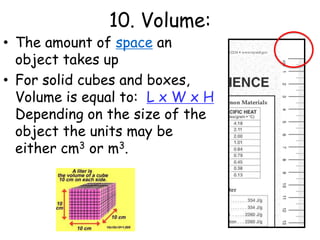
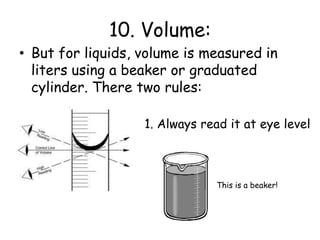
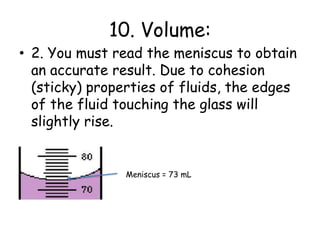
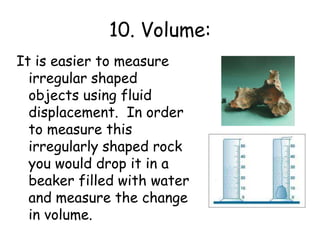
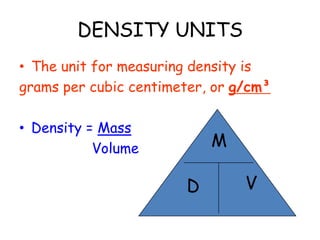
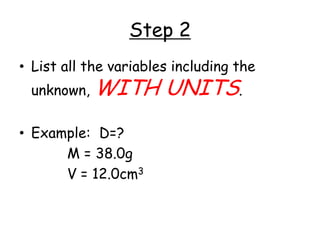
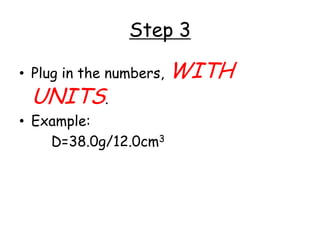
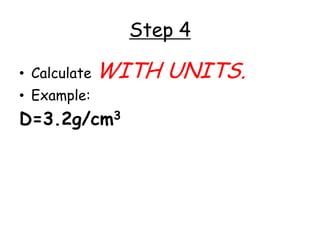
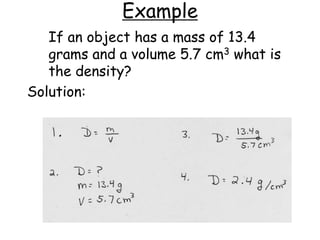
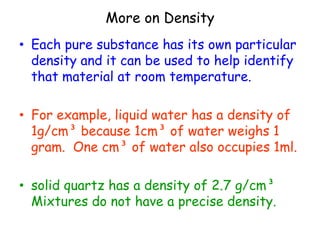
2. Various scientific terms are defined such as area, volume, density, temperature, and pressure. Formulas are provided for calculating concepts like area, volume, and density.
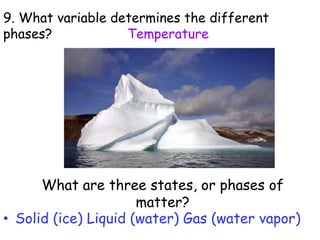
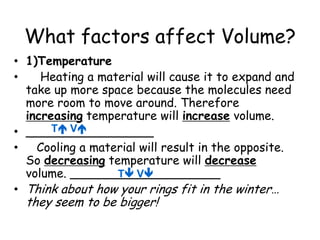
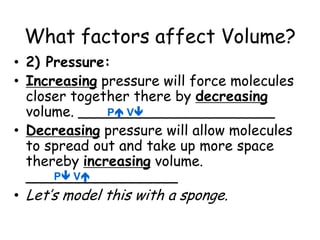
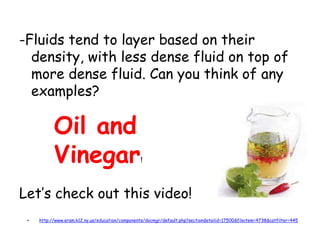
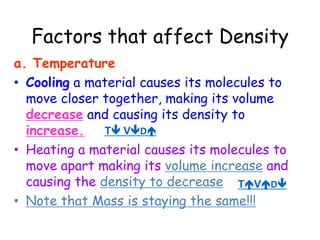
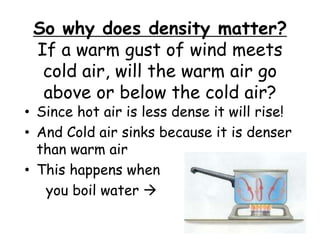
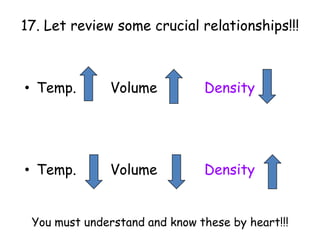
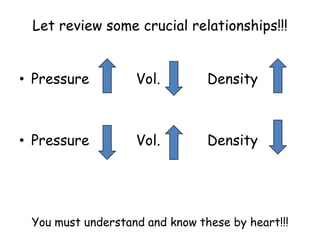
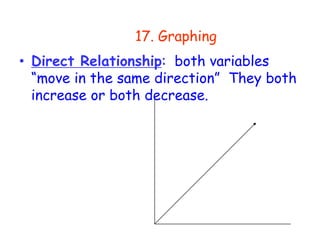
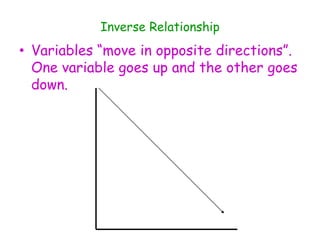
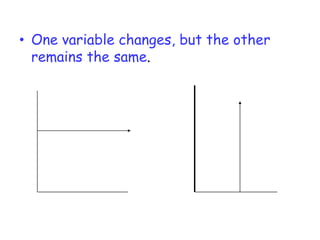
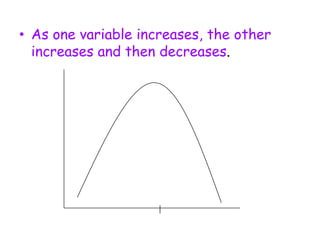
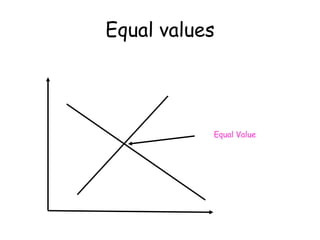
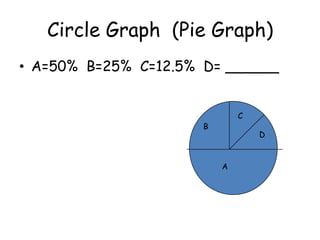
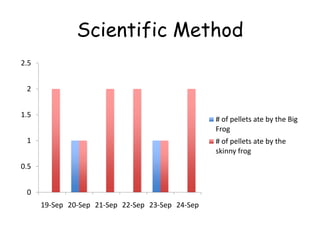
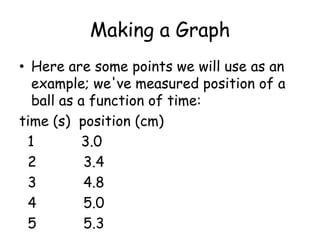
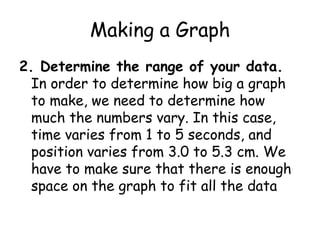
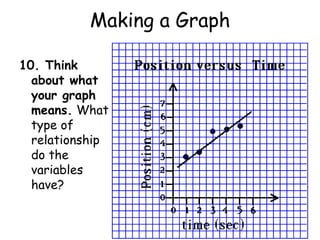
3. The relationships between different variables are explored, such as how temperature, pressure, and phase affect volume and density. Graphs including line graphs, circle graphs, and bar graphs are also introduced.