


This document discusses Markov analysis and its applications. A Markov analysis looks at a sequence of dependent random events and models how the probability of a future event depends on the current state. It can generate new random sequences that resemble the original data. The document provides examples of Markov chains, which are systems that can be in different states and transition between states according to fixed probabilities. Markov chains are useful for modeling consumer behavior, market share predictions, sales forecasting, and other applications. The document also discusses limitations of Markov models.
Introduction of Markov Analysis and its applications presented by a group of students.
Definition and characteristics of Markov processes; dependency of events on previous occurrences.
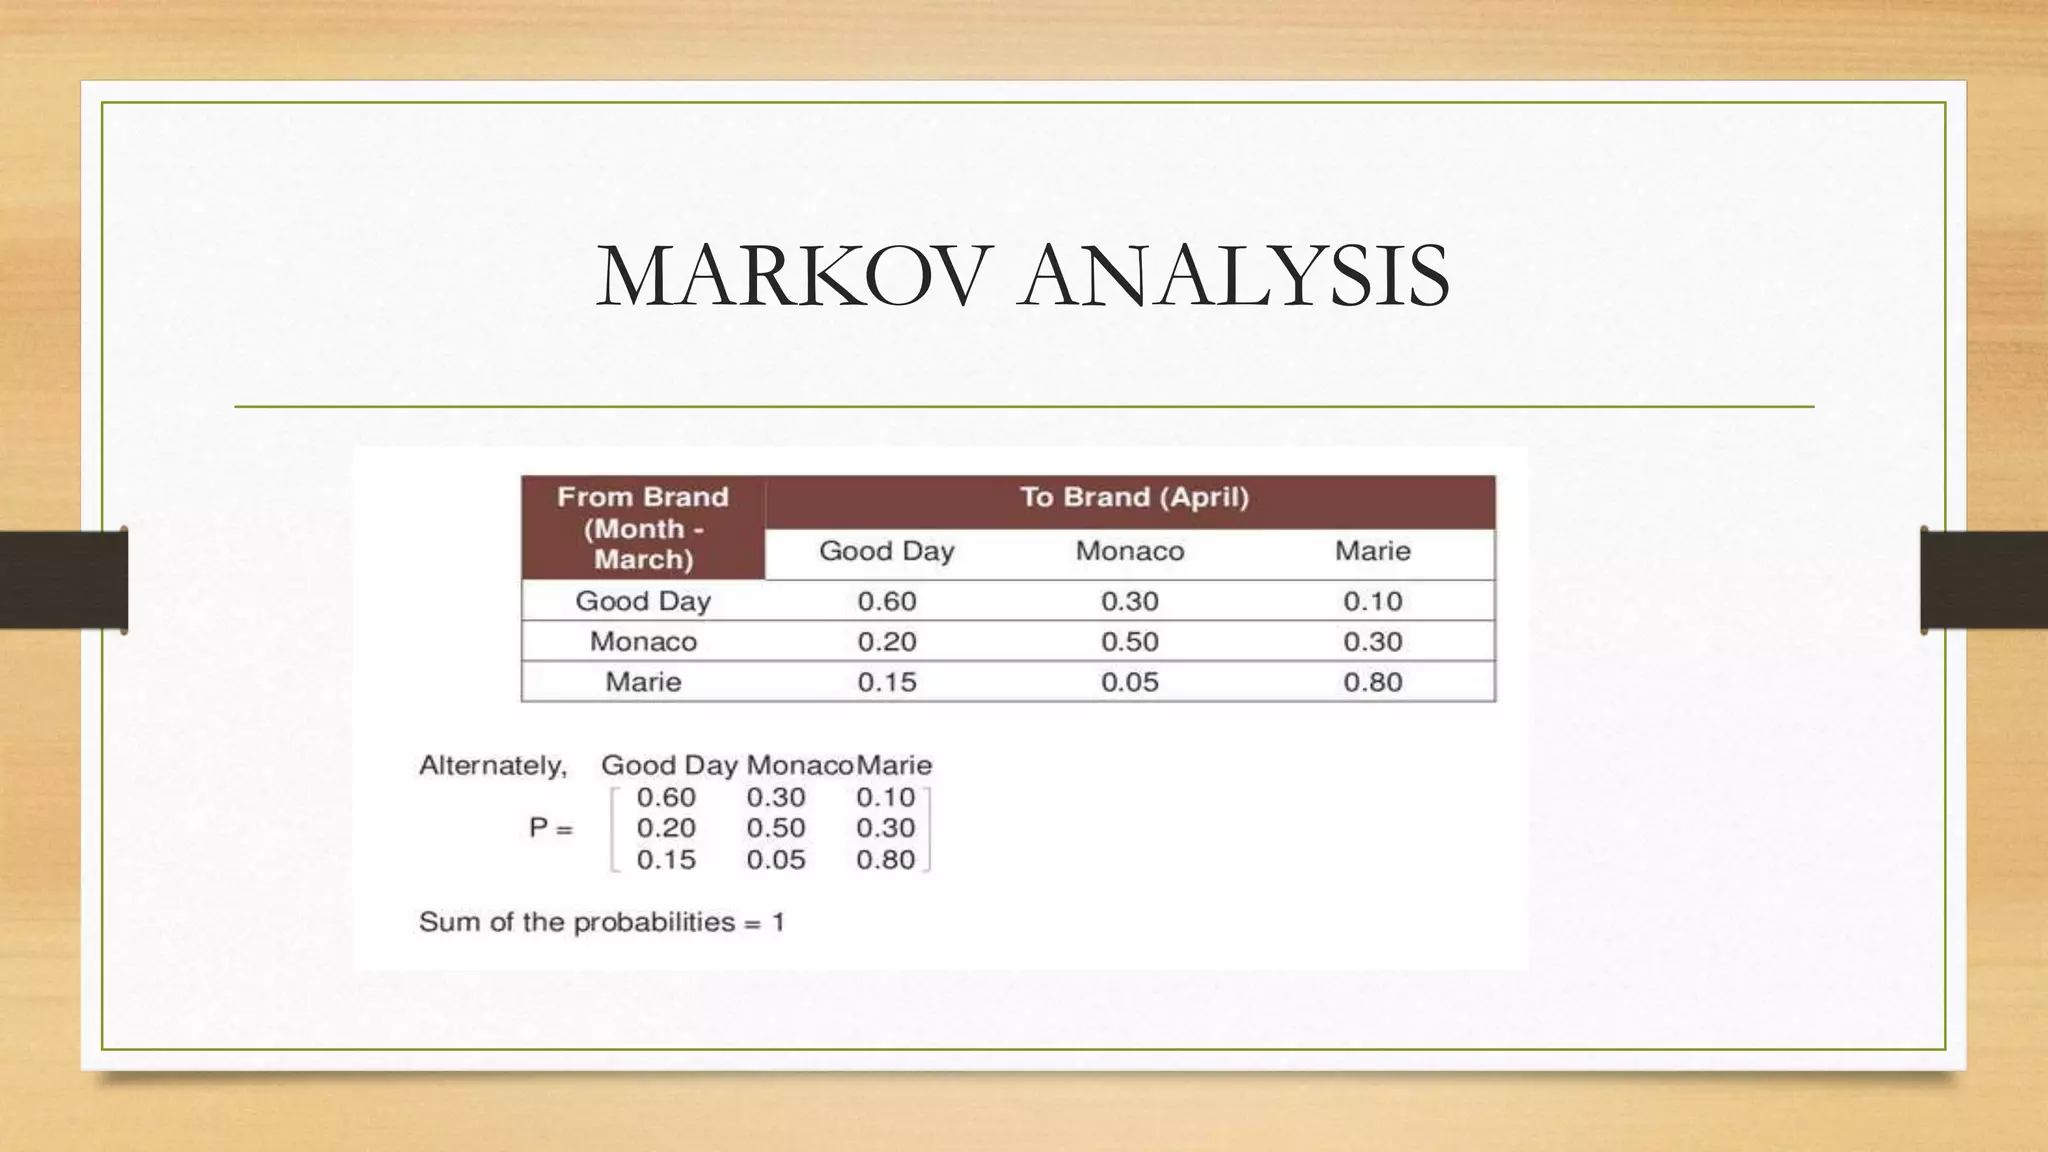
Description of Markov chain with transition probabilities showing movement between states.
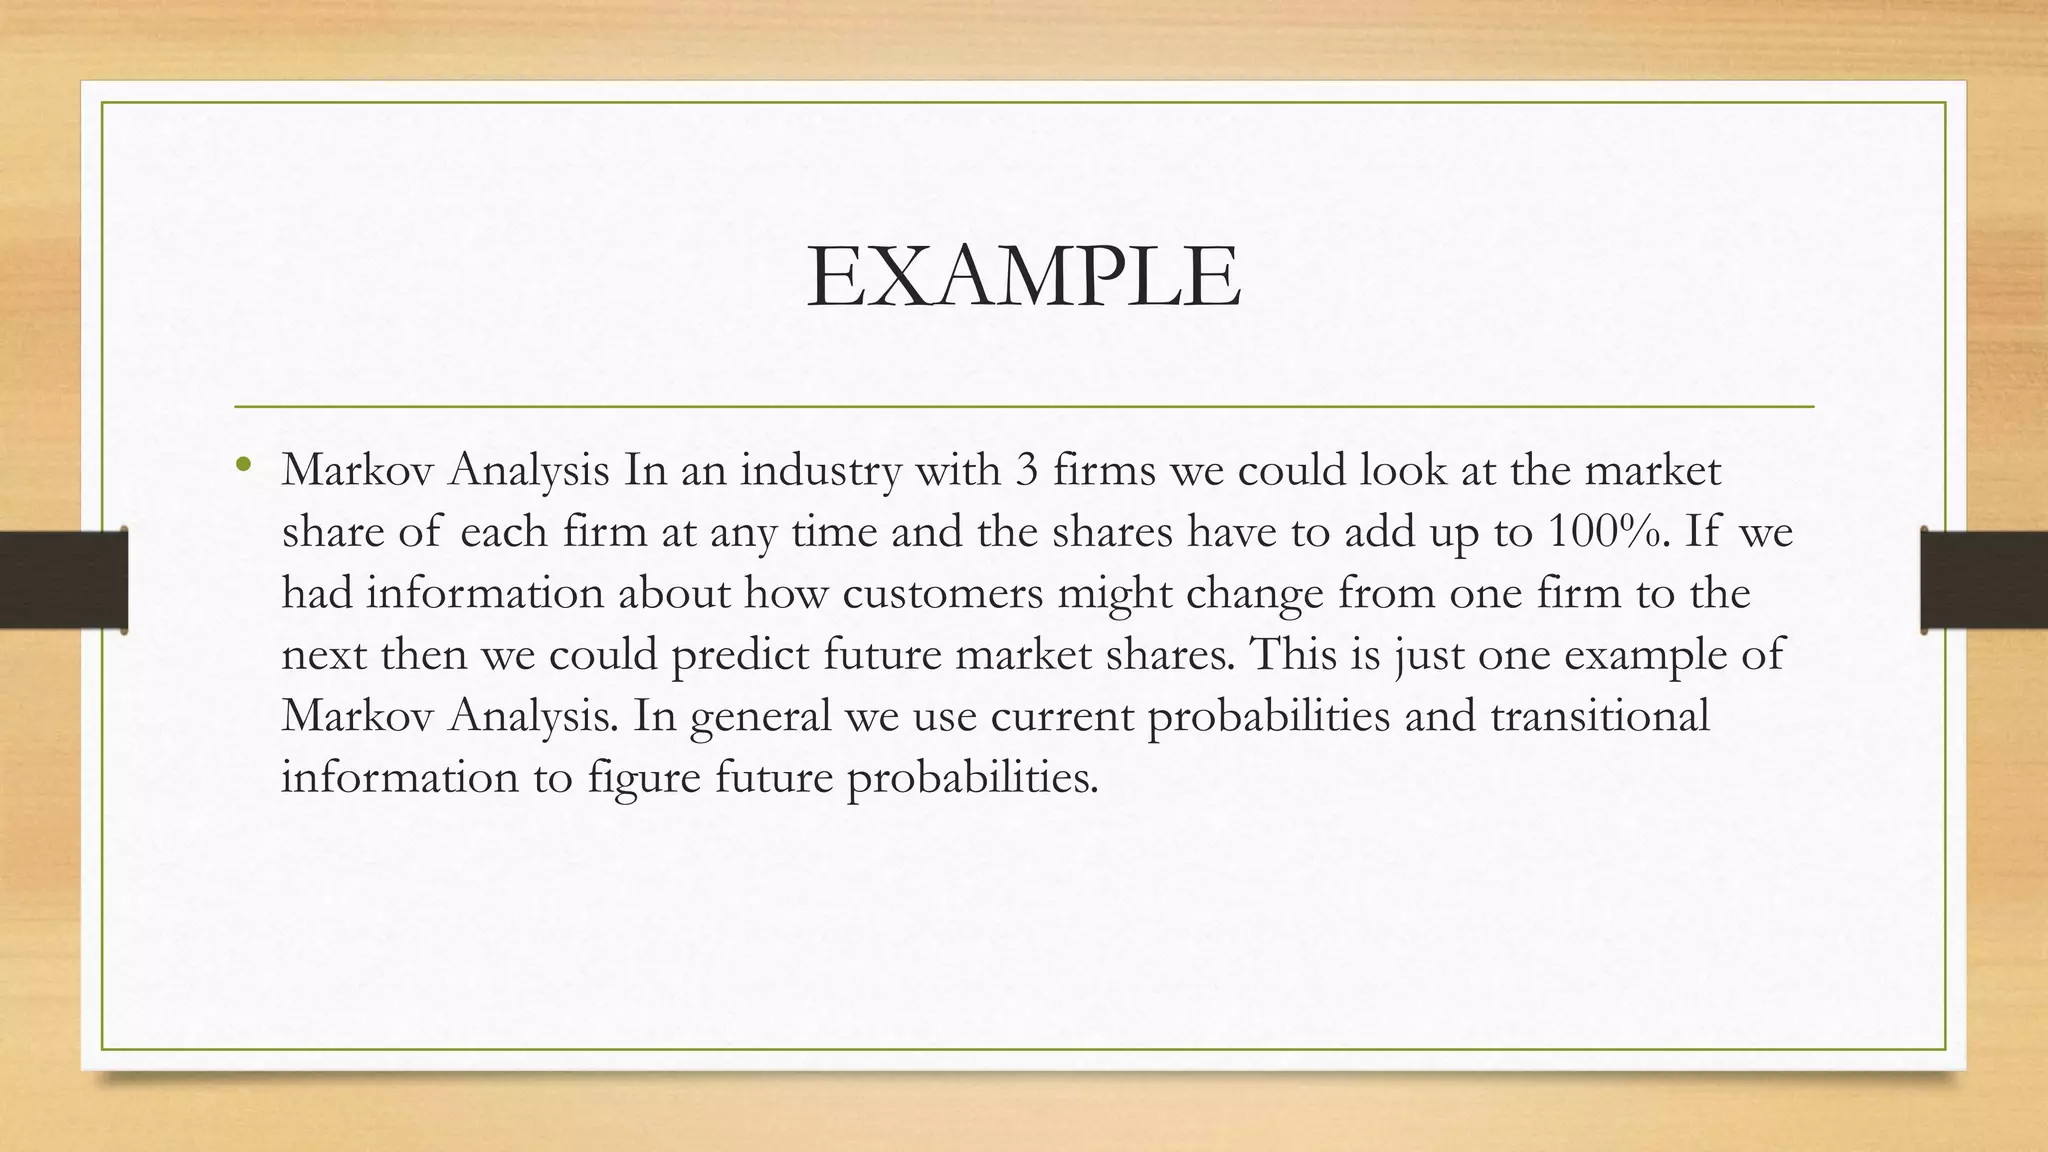
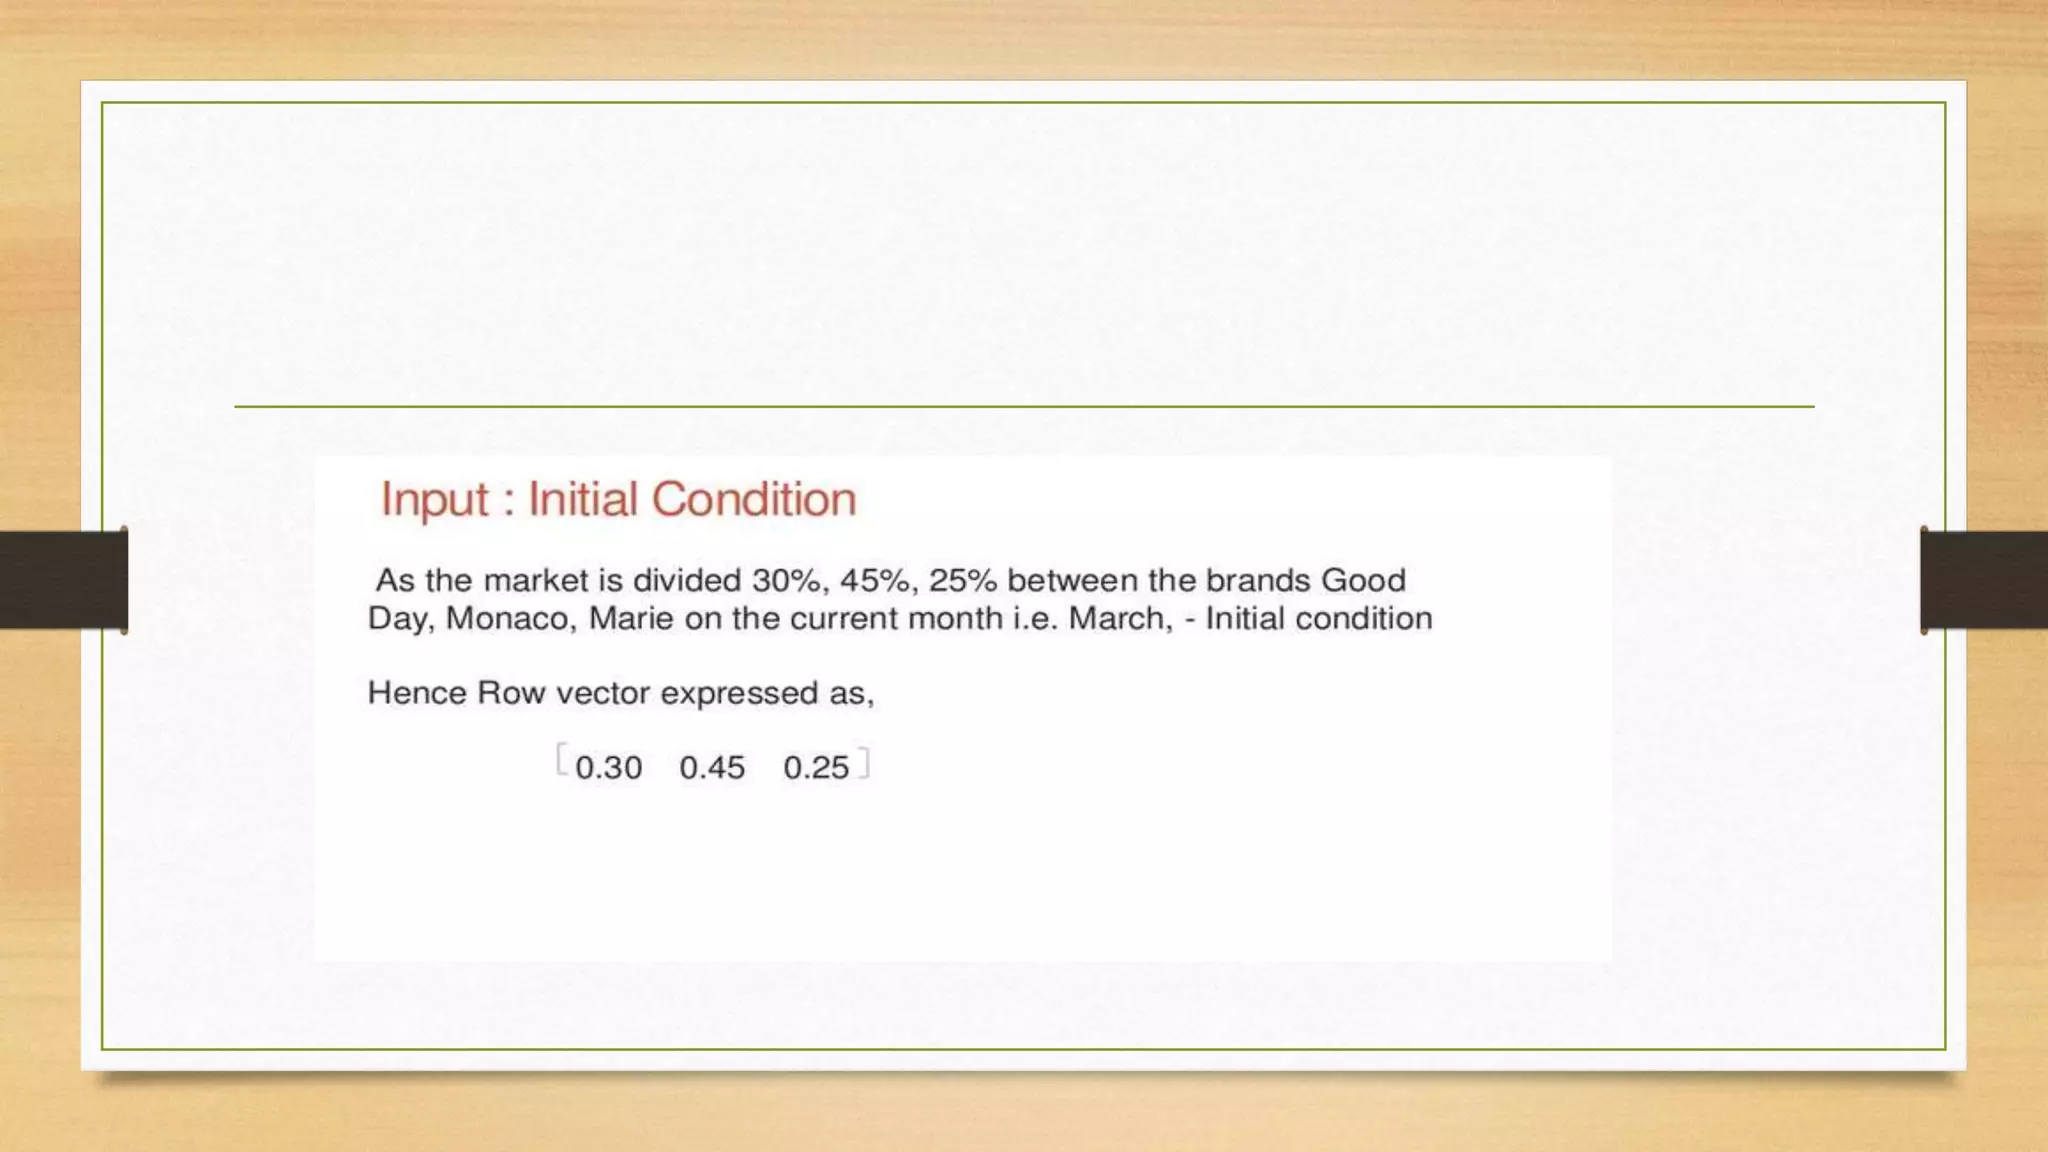
Application of Markov Analysis to predict changes in market shares among competing firms.
Analysis of accounts receivable categorized by states such as paid, bad debt, and overdue.
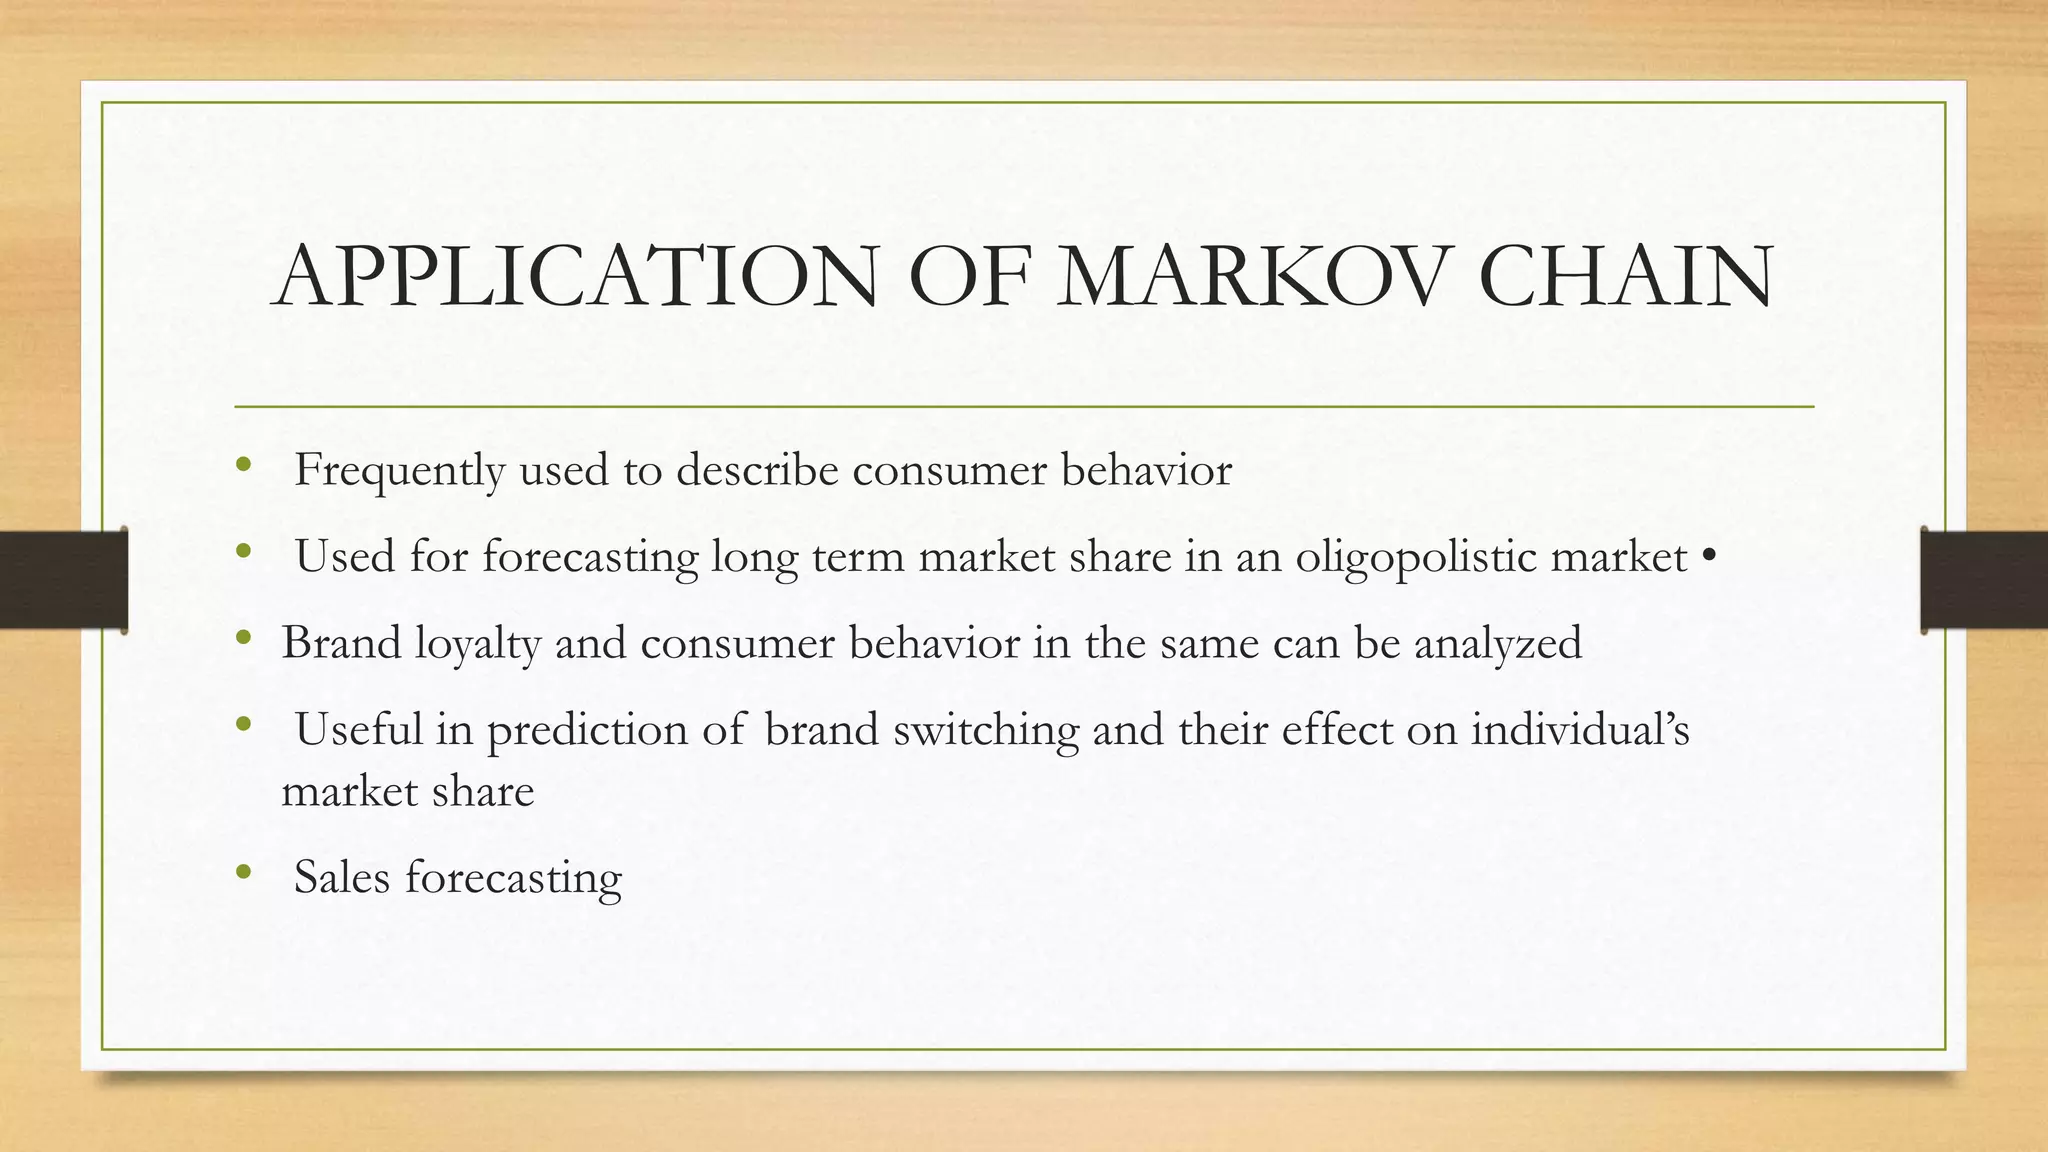
Use of Markov chains in consumer behavior analysis, forecasting market shares, and brand switching.
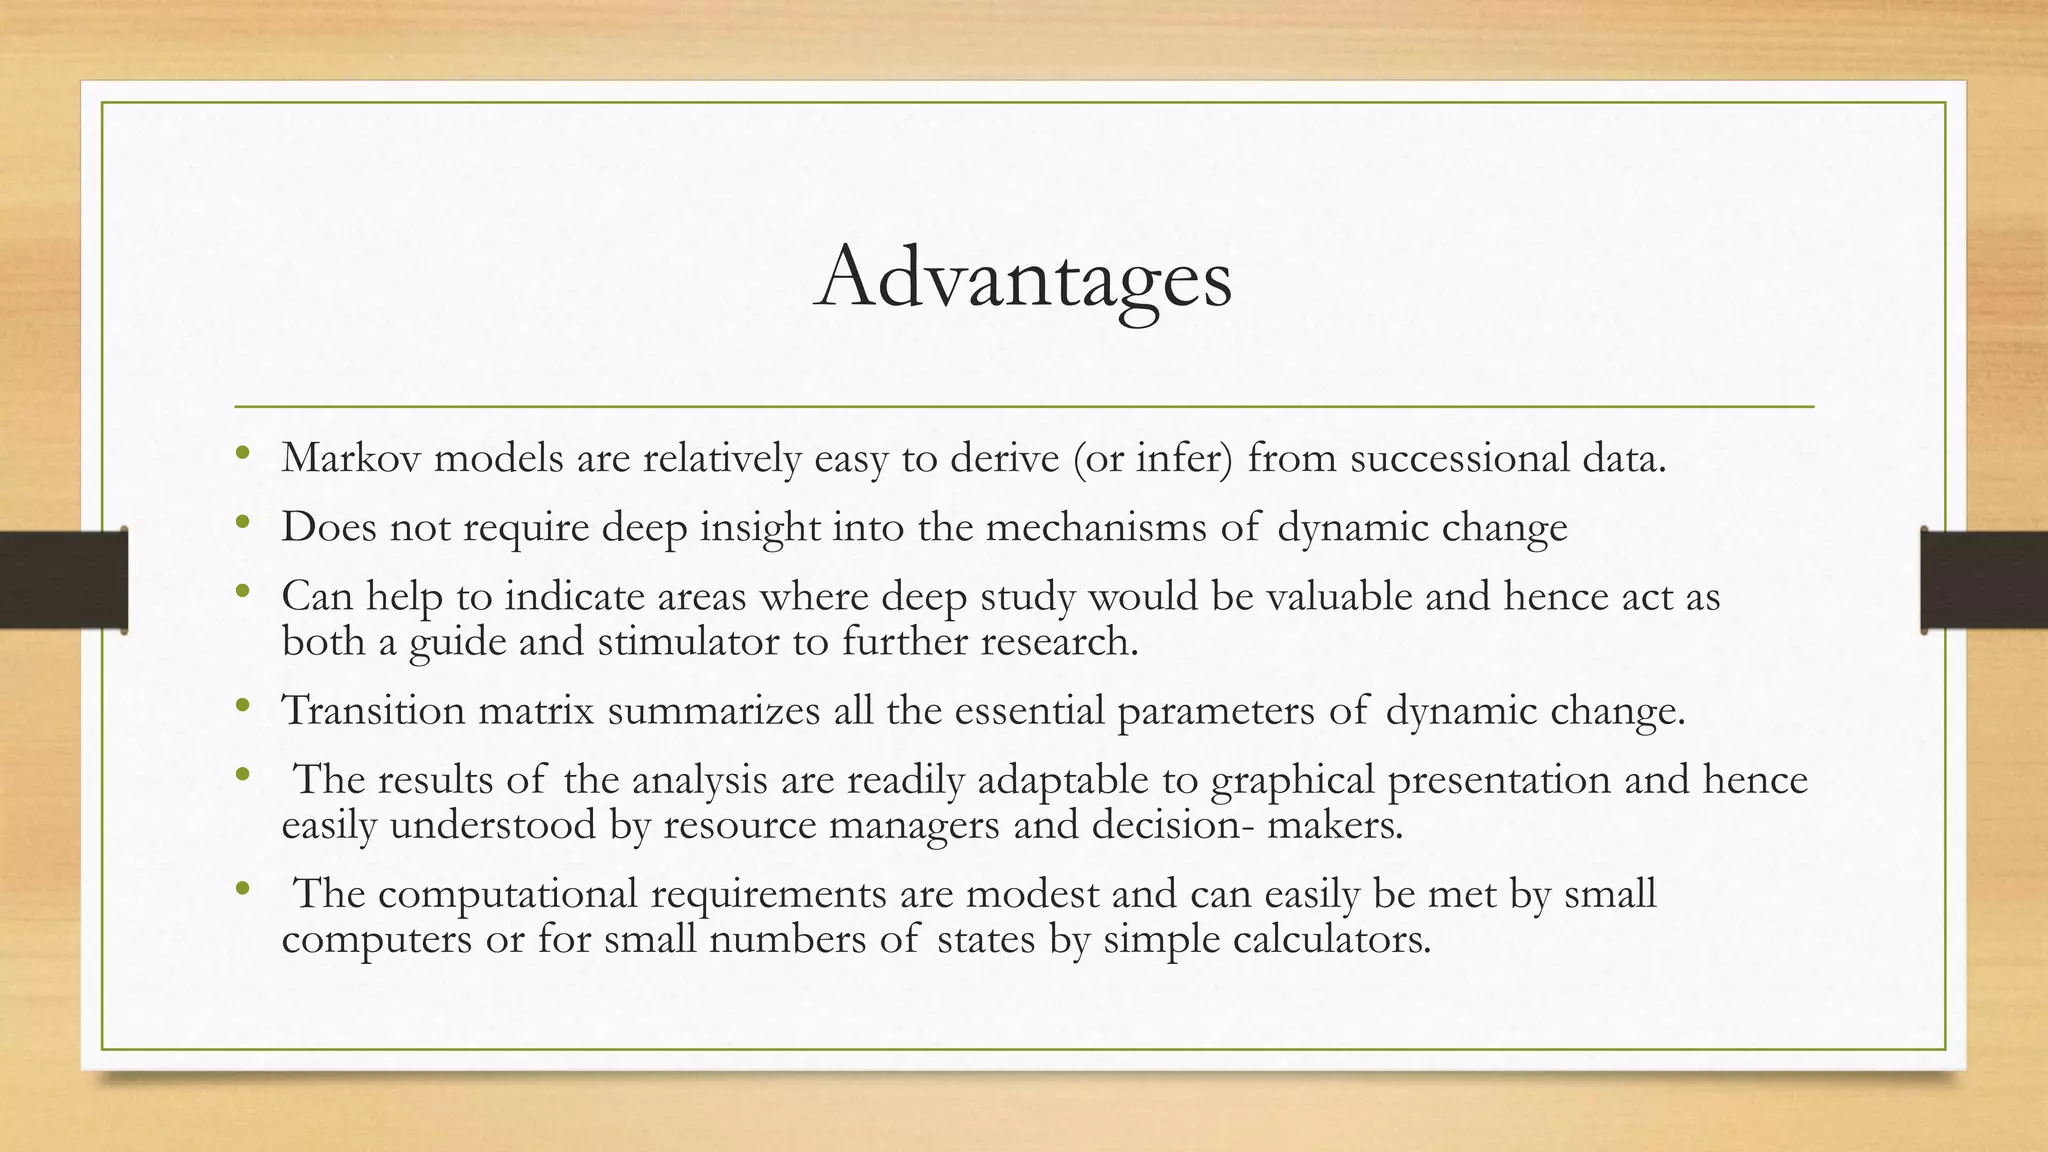
Benefits of Markov models, including ease of derivation, adaptability, and modest computational needs.
Challenges and limitations in applying Markov models, including market instability and changing consumer behavior.
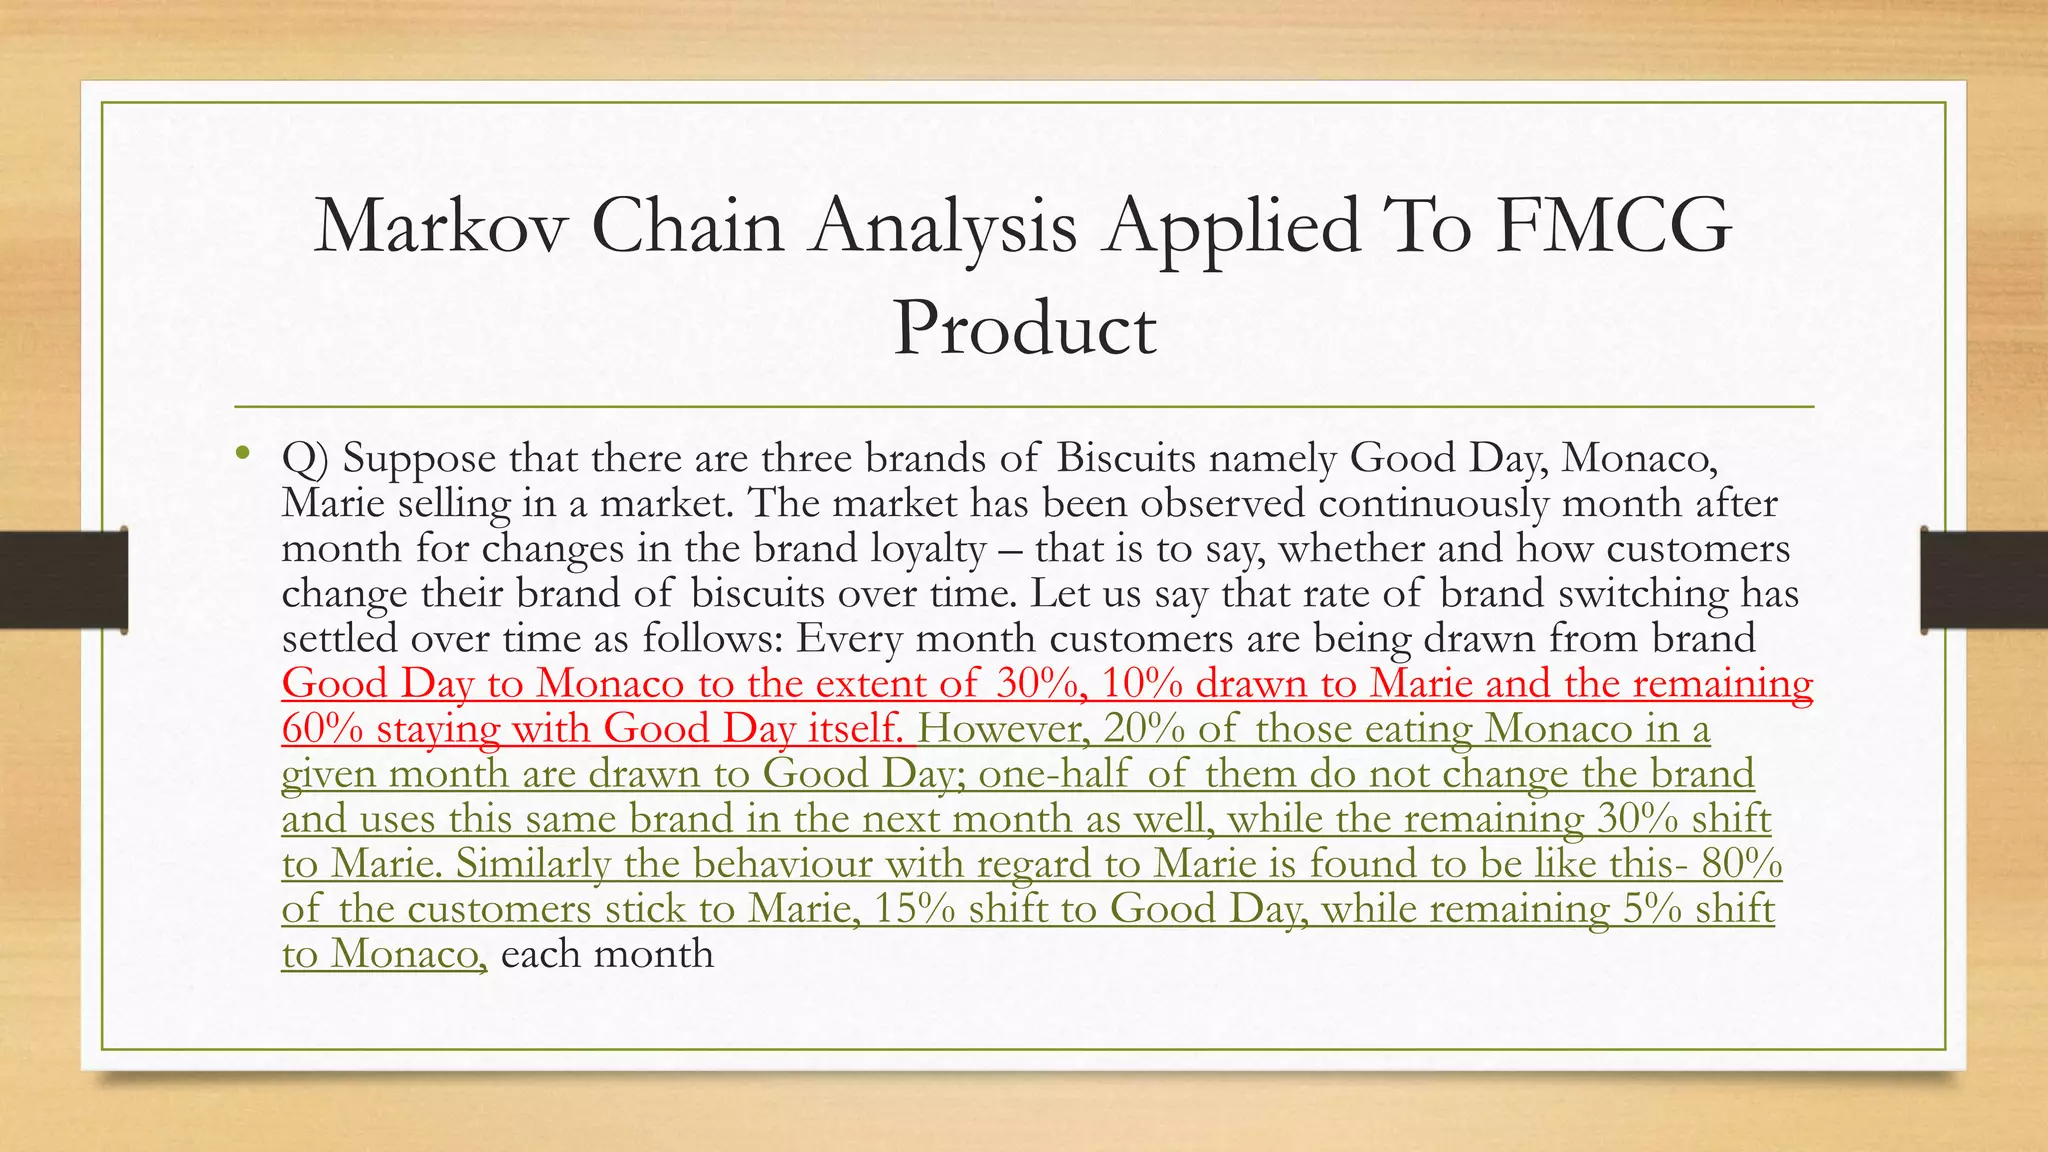
Analysis of brand loyalty and switching behavior among biscuit brands using market share data.
Final remarks and gratitude for attention at the end of the presentation.


![[DSC Europe 25] Vid Stimac - Policy Parsimony: Between Oversimplifying and Ov...](https://cdn.slidesharecdn.com/ss_thumbnails/eqlepagzqp2rhg3gbluh-dsc-stimac-251120-251205090438-059e7f54-thumbnail.jpg?width=640&height=640&fit=bounds)
![[DSC Europe 25] Petar Zivanov - AI meets documents From chatbots to AI-powere...](https://cdn.slidesharecdn.com/ss_thumbnails/xer2bb6nrdc8pdpev0pc-8-251204082258-7c2fa4a1-thumbnail.jpg?width=640&height=640&fit=bounds)

![[DSC Europe 25] Andy Cotgreave - Nothing is new in analytics.pptx](https://cdn.slidesharecdn.com/ss_thumbnails/mba4vzcurvoh5lfrd5zw-6-251205194645-341bbbbe-thumbnail.jpg?width=640&height=640&fit=bounds)


![[DSC Europe 25] Dragana Ilic - AI for Big Data in Astronomy.pptx](https://cdn.slidesharecdn.com/ss_thumbnails/8palya86qaatvjhva1ms-2-dragana-ilic-ai-ilic-251208151906-652b819c-thumbnail.jpg?width=640&height=640&fit=bounds)


![[DSC Europe 25] Boris Perkovic - Lost in performance.pptx](https://cdn.slidesharecdn.com/ss_thumbnails/uq5hrp7vsuahqkxzifux-1-251204082258-fd2ee09d-thumbnail.jpg?width=640&height=640&fit=bounds)

![[DSC Europe 25] Goran Obradovic - The Rise of Sovereign AI: Building the Regi...](https://cdn.slidesharecdn.com/ss_thumbnails/7nw2xxixrxqdxvrb5wca-6-251205085714-ab09a2ac-thumbnail.jpg?width=640&height=640&fit=bounds)


![[DSC Europe 25] Dusan Jovicic - AI Story: From on-prem to cloud and back agai...](https://cdn.slidesharecdn.com/ss_thumbnails/8kp49m6uq22ifnbwhfnk-2-251205085715-964d11a6-thumbnail.jpg?width=640&height=640&fit=bounds)

