Even tho Pi network is not listed on any exchange yet.
Buying/Selling or investing in pi network coins is highly possible through the help of vendors. You can buy from vendors[ buy directly from the pi network miners and resell it]. I will leave the telegram contact of my personal vendor.
@Pi_vendor_247
how to sell pi coins at high rate quickly.DOT TECH
Where can I sell my pi coins at a high rate.
Pi is not launched yet on any exchange. But one can easily sell his or her pi coins to investors who want to hold pi till mainnet launch.
This means crypto whales want to hold pi. And you can get a good rate for selling pi to them. I will leave the telegram contact of my personal pi vendor below.
A vendor is someone who buys from a miner and resell it to a holder or crypto whale.
Here is the telegram contact of my vendor:
@Pi_vendor_247
US Economic Outlook - Being Decided - M Capital Group August 2021.pdfpchutichetpong
The U.S. economy is continuing its impressive recovery from the COVID-19 pandemic and not slowing down despite re-occurring bumps. The U.S. savings rate reached its highest ever recorded level at 34% in April 2020 and Americans seem ready to spend. The sectors that had been hurt the most by the pandemic specifically reduced consumer spending, like retail, leisure, hospitality, and travel, are now experiencing massive growth in revenue and job openings.
Could this growth lead to a “Roaring Twenties”? As quickly as the U.S. economy contracted, experiencing a 9.1% drop in economic output relative to the business cycle in Q2 2020, the largest in recorded history, it has rebounded beyond expectations. This surprising growth seems to be fueled by the U.S. government’s aggressive fiscal and monetary policies, and an increase in consumer spending as mobility restrictions are lifted. Unemployment rates between June 2020 and June 2021 decreased by 5.2%, while the demand for labor is increasing, coupled with increasing wages to incentivize Americans to rejoin the labor force. Schools and businesses are expected to fully reopen soon. In parallel, vaccination rates across the country and the world continue to rise, with full vaccination rates of 50% and 14.8% respectively.
However, it is not completely smooth sailing from here. According to M Capital Group, the main risks that threaten the continued growth of the U.S. economy are inflation, unsettled trade relations, and another wave of Covid-19 mutations that could shut down the world again. Have we learned from the past year of COVID-19 and adapted our economy accordingly?
“In order for the U.S. economy to continue growing, whether there is another wave or not, the U.S. needs to focus on diversifying supply chains, supporting business investment, and maintaining consumer spending,” says Grace Feeley, a research analyst at M Capital Group.
While the economic indicators are positive, the risks are coming closer to manifesting and threatening such growth. The new variants spreading throughout the world, Delta, Lambda, and Gamma, are vaccine-resistant and muddy the predictions made about the economy and health of the country. These variants bring back the feeling of uncertainty that has wreaked havoc not only on the stock market but the mindset of people around the world. MCG provides unique insight on how to mitigate these risks to possibly ensure a bright economic future.
Currently pi network is not tradable on binance or any other exchange because we are still in the enclosed mainnet.
Right now the only way to sell pi coins is by trading with a verified merchant.
What is a pi merchant?
A pi merchant is someone verified by pi network team and allowed to barter pi coins for goods and services.
Since pi network is not doing any pre-sale The only way exchanges like binance/huobi or crypto whales can get pi is by buying from miners. And a merchant stands in between the exchanges and the miners.
I will leave the telegram contact of my personal pi merchant. I and my friends has traded more than 6000pi coins successfully
Tele-gram
@Pi_vendor_247
Falcon stands out as a top-tier P2P Invoice Discounting platform in India, bridging esteemed blue-chip companies and eager investors. Our goal is to transform the investment landscape in India by establishing a comprehensive destination for borrowers and investors with diverse profiles and needs, all while minimizing risk. What sets Falcon apart is the elimination of intermediaries such as commercial banks and depository institutions, allowing investors to enjoy higher yields.
NO1 Uk Rohani Baba In Karachi Bangali Baba Karachi Online Amil Baba WorldWide...Amil baba
Contact with Dawood Bhai Just call on +92322-6382012 and we'll help you. We'll solve all your problems within 12 to 24 hours and with 101% guarantee and with astrology systematic. If you want to take any personal or professional advice then also you can call us on +92322-6382012 , ONLINE LOVE PROBLEM & Other all types of Daily Life Problem's.Then CALL or WHATSAPP us on +92322-6382012 and Get all these problems solutions here by Amil Baba DAWOOD BANGALI
#vashikaranspecialist #astrologer #palmistry #amliyaat #taweez #manpasandshadi #horoscope #spiritual #lovelife #lovespell #marriagespell#aamilbabainpakistan #amilbabainkarachi #powerfullblackmagicspell #kalajadumantarspecialist #realamilbaba #AmilbabainPakistan #astrologerincanada #astrologerindubai #lovespellsmaster #kalajaduspecialist #lovespellsthatwork #aamilbabainlahore#blackmagicformarriage #aamilbaba #kalajadu #kalailam #taweez #wazifaexpert #jadumantar #vashikaranspecialist #astrologer #palmistry #amliyaat #taweez #manpasandshadi #horoscope #spiritual #lovelife #lovespell #marriagespell#aamilbabainpakistan #amilbabainkarachi #powerfullblackmagicspell #kalajadumantarspecialist #realamilbaba #AmilbabainPakistan #astrologerincanada #astrologerindubai #lovespellsmaster #kalajaduspecialist #lovespellsthatwork #aamilbabainlahore #blackmagicforlove #blackmagicformarriage #aamilbaba #kalajadu #kalailam #taweez #wazifaexpert #jadumantar #vashikaranspecialist #astrologer #palmistry #amliyaat #taweez #manpasandshadi #horoscope #spiritual #lovelife #lovespell #marriagespell#aamilbabainpakistan #amilbabainkarachi #powerfullblackmagicspell #kalajadumantarspecialist #realamilbaba #AmilbabainPakistan #astrologerincanada #astrologerindubai #lovespellsmaster #kalajaduspecialist #lovespellsthatwork #aamilbabainlahore #Amilbabainuk #amilbabainspain #amilbabaindubai #Amilbabainnorway #amilbabainkrachi #amilbabainlahore #amilbabaingujranwalan #amilbabainislamabad
NO1 Uk Divorce problem uk all amil baba in karachi,lahore,pakistan talaq ka m...Amil Baba Dawood bangali
Contact with Dawood Bhai Just call on +92322-6382012 and we'll help you. We'll solve all your problems within 12 to 24 hours and with 101% guarantee and with astrology systematic. If you want to take any personal or professional advice then also you can call us on +92322-6382012 , ONLINE LOVE PROBLEM & Other all types of Daily Life Problem's.Then CALL or WHATSAPP us on +92322-6382012 and Get all these problems solutions here by Amil Baba DAWOOD BANGALI
#vashikaranspecialist #astrologer #palmistry #amliyaat #taweez #manpasandshadi #horoscope #spiritual #lovelife #lovespell #marriagespell#aamilbabainpakistan #amilbabainkarachi #powerfullblackmagicspell #kalajadumantarspecialist #realamilbaba #AmilbabainPakistan #astrologerincanada #astrologerindubai #lovespellsmaster #kalajaduspecialist #lovespellsthatwork #aamilbabainlahore#blackmagicformarriage #aamilbaba #kalajadu #kalailam #taweez #wazifaexpert #jadumantar #vashikaranspecialist #astrologer #palmistry #amliyaat #taweez #manpasandshadi #horoscope #spiritual #lovelife #lovespell #marriagespell#aamilbabainpakistan #amilbabainkarachi #powerfullblackmagicspell #kalajadumantarspecialist #realamilbaba #AmilbabainPakistan #astrologerincanada #astrologerindubai #lovespellsmaster #kalajaduspecialist #lovespellsthatwork #aamilbabainlahore #blackmagicforlove #blackmagicformarriage #aamilbaba #kalajadu #kalailam #taweez #wazifaexpert #jadumantar #vashikaranspecialist #astrologer #palmistry #amliyaat #taweez #manpasandshadi #horoscope #spiritual #lovelife #lovespell #marriagespell#aamilbabainpakistan #amilbabainkarachi #powerfullblackmagicspell #kalajadumantarspecialist #realamilbaba #AmilbabainPakistan #astrologerincanada #astrologerindubai #lovespellsmaster #kalajaduspecialist #lovespellsthatwork #aamilbabainlahore #Amilbabainuk #amilbabainspain #amilbabaindubai #Amilbabainnorway #amilbabainkrachi #amilbabainlahore #amilbabaingujranwalan #amilbabainislamabad
What website can I sell pi coins securely.DOT TECH
Currently there are no website or exchange that allow buying or selling of pi coins..
But you can still easily sell pi coins, by reselling it to exchanges/crypto whales interested in holding thousands of pi coins before the mainnet launch.
Who is a pi merchant?
A pi merchant is someone who buys pi coins from miners and resell to these crypto whales and holders of pi..
This is because pi network is not doing any pre-sale. The only way exchanges can get pi is by buying from miners and pi merchants stands in between the miners and the exchanges.
How can I sell my pi coins?
Selling pi coins is really easy, but first you need to migrate to mainnet wallet before you can do that. I will leave the telegram contact of my personal pi merchant to trade with.
Tele-gram.
@Pi_vendor_247
how can I sell my pi coins for cash in a pi APPDOT TECH
You can't sell your pi coins in the pi network app. because it is not listed yet on any exchange.
The only way you can sell is by trading your pi coins with an investor (a person looking forward to hold massive amounts of pi coins before mainnet launch) .
You don't need to meet the investor directly all the trades are done with a pi vendor/merchant (a person that buys the pi coins from miners and resell it to investors)
I Will leave The telegram contact of my personal pi vendor, if you are finding a legitimate one.
@Pi_vendor_247
#pi network
#pi coins
#money
how can I sell pi coins after successfully completing KYCDOT TECH
Pi coins is not launched yet in any exchange 💱 this means it's not swappable, the current pi displaying on coin market cap is the iou version of pi. And you can learn all about that on my previous post.
RIGHT NOW THE ONLY WAY you can sell pi coins is through verified pi merchants. A pi merchant is someone who buys pi coins and resell them to exchanges and crypto whales. Looking forward to hold massive quantities of pi coins before the mainnet launch.
This is because pi network is not doing any pre-sale or ico offerings, the only way to get my coins is from buying from miners. So a merchant facilitates the transactions between the miners and these exchanges holding pi.
I and my friends has sold more than 6000 pi coins successfully with this method. I will be happy to share the contact of my personal pi merchant. The one i trade with, if you have your own merchant you can trade with them. For those who are new.
Message: @Pi_vendor_247 on telegram.
I wouldn't advise you selling all percentage of the pi coins. Leave at least a before so its a win win during open mainnet. Have a nice day pioneers ♥️
#kyc #mainnet #picoins #pi #sellpi #piwallet
#pinetwork
what is the future of Pi Network currency.DOT TECH
The future of the Pi cryptocurrency is uncertain, and its success will depend on several factors. Pi is a relatively new cryptocurrency that aims to be user-friendly and accessible to a wide audience. Here are a few key considerations for its future:
Message: @Pi_vendor_247 on telegram if u want to sell PI COINS.
1. Mainnet Launch: As of my last knowledge update in January 2022, Pi was still in the testnet phase. Its success will depend on a successful transition to a mainnet, where actual transactions can take place.
2. User Adoption: Pi's success will be closely tied to user adoption. The more users who join the network and actively participate, the stronger the ecosystem can become.
3. Utility and Use Cases: For a cryptocurrency to thrive, it must offer utility and practical use cases. The Pi team has talked about various applications, including peer-to-peer transactions, smart contracts, and more. The development and implementation of these features will be essential.
4. Regulatory Environment: The regulatory environment for cryptocurrencies is evolving globally. How Pi navigates and complies with regulations in various jurisdictions will significantly impact its future.
5. Technology Development: The Pi network must continue to develop and improve its technology, security, and scalability to compete with established cryptocurrencies.
6. Community Engagement: The Pi community plays a critical role in its future. Engaged users can help build trust and grow the network.
7. Monetization and Sustainability: The Pi team's monetization strategy, such as fees, partnerships, or other revenue sources, will affect its long-term sustainability.
It's essential to approach Pi or any new cryptocurrency with caution and conduct due diligence. Cryptocurrency investments involve risks, and potential rewards can be uncertain. The success and future of Pi will depend on the collective efforts of its team, community, and the broader cryptocurrency market dynamics. It's advisable to stay updated on Pi's development and follow any updates from the official Pi Network website or announcements from the team.
Scope Of Macroeconomics introduction and basic theories
Market Outlook - August 2,2010
1. .
Market Outlook
India Research
August 2, 2010
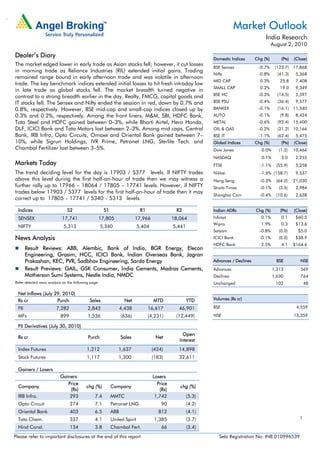
Dealer’s Diary Domestic Indices Chg (%) (Pts) (Close)
The market edged lower in early trade as Asian stocks fell; however, it cut losses
BSE Sensex -0.7% (123.7) 17,868
in morning trade as Reliance Industries (RIL) extended initial gains. Trading
Nifty -0.8% (41.3) 5,368
remained range bound in early afternoon trade and was volatile in afternoon
MID CAP 0.3% 25.8 7,408
trade. The key benchmark indices extended initial losses to hit fresh intraday low
SMALL CAP 0.2% 19.0 9,349
in late trade as global stocks fell. The market breadth turned negative in
contrast to a strong breadth earlier in the day. Realty, FMCG, capital goods and BSE HC -0.3% (14.5) 5,597
IT stocks fell. The Sensex and Nifty ended the session in red, down by 0.7% and BSE PSU -0.4% (36.4) 9,577
0.8%, respectively. However, BSE mid-cap and small-cap indices closed up by BANKEX -0.1% (16.1) 11,540
0.3% and 0.2%, respectively. Among the front liners, M&M, SBI, HDFC Bank, AUTO -0.1% (9.8) 8,424
Tata Steel and HDFC gained between 0–3%, while Bharti Airtel, Hero Honda, METAL -0.6% (92.4) 15,400
DLF, ICICI Bank and Tata Motors lost between 2–3%. Among mid caps, Central OIL & GAS -0.2% (21.2) 10,166
Bank, IRB Infra, Opto Circuits, Omaxe and Oriental Bank gained between 7– BSE IT -1.1% (62.4) 5,475
10%, while Sigrun Holdings, IVR Prime, Petronet LNG, Sterlite Tech. and Global Indices Chg (%) (Pts) (Close)
Chambal Fertilizer lost between 3–5%. Dow Jones 0.0% (1.2) 10,466
NASDAQ 0.1% 3.0 2,255
Markets Today FTSE -1.1% (55.9) 5,258
The trend deciding level for the day is 17903 / 5377 levels. If NIFTY trades Nikkei -1.6% (158.7) 9,537
above this level during the first half-an-hour of trade then we may witness a Hang Seng -0.3% (64.0) 21,030
further rally up to 17966 – 18064 / 17805 – 17741 levels. However, if NIFTY Straits Times -0.1% (3.5) 2,984
trades below 17903 / 5377 levels for the first half-an-hour of trade then it may
Shanghai Com -0.4% (10.6) 2,638
correct up to 17805 – 17741 / 5340 – 5313 levels.
Indices S2 S1 R1 R2 Indian ADRs Chg (%) (Pts) (Close)
SENSEX 17,741 17,805 17,966 18,064 Infosys 0.1% 0.1 $60.5
Wipro 1.9% 0.3 $13.6
NIFTY 5,313 5,340 5,404 5,441
Satyam -0.8% (0.0) $5.0
News Analysis ICICI Bank -0.1% (0.0) $38.9
HDFC Bank 2.5% 4.1 $164.6
Result Reviews: ABB, Alembic, Bank of India, BGR Energy, Elecon
Engineering, Grasim, HCC, ICICI Bank, Indian Overseas Bank, Jagran
Prakashan, KEC, PVR, Sadbhav Engineering, Sarda Energy Advances / Declines BSE NSE
Result Previews: GAIL, GSK Consumer, India Cements, Madras Cements, Advances 1,313 569
Motherson Sumi Systems, Nestle India, NMDC Declines 1,630 764
Refer detailed news analysis on the following page. Unchanged 102 48
Net Inflows (July 29, 2010)
Rs cr Purch Sales Net MTD YTD Volumes (Rs cr)
FII 7,282 2,843 4,438 16,617 46,901 BSE 4,559
MFs 899 1,536 (636) (4,231) (12,449) NSE 13,359
FII Derivatives (July 30, 2010)
Open
Rs cr Purch Sales Net
Interest
Index Futures 1,212 1,637 (424) 14,898
Stock Futures 1,117 1,300 (183) 32,611
Gainers / Losers
Gainers Losers
Price Price
Company chg (%) Company chg (%)
(Rs) (Rs)
IRB Infra. 293 7.4 MMTC 1,742 (5.3)
Opto Circuit 274 7.1 Petronet LNG 90 (4.2)
Oriental Bank 403 6.5 ABB 812 (4.1)
Tata Chem. 337 4.1 United Spirit 1,385 (3.7) 1
Hind Const. 134 3.8 Chambal Fert. 66 (3.4)
Please refer to important disclosures at the end of this report Sebi Registration No: INB 010996539
2. Market Outlook | India Research
Result Reviews-1QFY2011
ABB - 2QCY2010
ABB India reported a dismal 2QCY2010 performance, with a decline in its top line and
bottom line, which was well below our estimates. The top line slipped by 4% yoy to
Rs1,446cr (Rs1,505cr) for 2QCY2010 because of slower-than-expected execution. On the
operating front, the company reported a sharp 450bp contraction in EBITDA margin to
4.6% (9.1%) due to a combination of various factors, including early exit costs from rural
electrification business and cost overruns in few large projects. Consequently, reported net
profit for the quarter fell by 54% yoy to Rs38cr (Rs84cr). The stock is currently under review.
Alembic
Alembic reported its 1QFY2011 results, which were marginally below our estimates. Net
sales came in at Rs279cr (Rs291cr), down 4.0% yoy on the back of a 37.6% decline on the
export API front. Domestic formulation sales grew by 5.5% yoy to Rs145.0cr (Rs137.4cr),
while domestic API sales grew by 76.3% to Rs37.2cr (Rs21.1cr). On the export front,
formulation sales came in at Rs33.6cr (Rs28.0cr), up 20.0% yoy, driven by regulated
markets, while export API was subdued at Rs65.0cr (Rs104.1cr), down 37.6% yoy, on the
back of a decline in regulated markets. Alembic reported OPM of 9.9% (10.3%), which
contracted by 40bp on the back of lower sales. The company reported gross margin of
47.4% (46.5%) on account of favorable product mix. Employee expenses increased by
6.7% to Rs35.0cr (Rs32.8cr) during the quarter. The company reported net profit of
Rs11.5cr (12.3cr), a decline of 6.4%.
On the positive front, interest cost declined by 45.4% to Rs4.4cr (Rs8.1cr). Alembic filed
three ANDAs during the quarter, taking the total filing to 31 ANDAs with nine approvals.
We maintain Buy on the stock with a Target Price of Rs74, as the company’s demerger into
Alembic and Alembic Pharma is a long-term positive as it unlocks value for both the
businesses and paves way to rope in future investors.
Bank of India
Bank of India has announced its 1QFY2011 results, wherein it has registered net profit
growth of 24.1% on a yoy basis and robust growth of 69.5% on a sequential basis to
Rs725cr, which is above our estimate of Rs491cr mainly on account of better-than-
estimated NII. Robust operating performance and stable asset quality were the key
highlights of the result.
NII grew by 33.8% on a yoy basis and 12.2% on a sequential basis to Rs1,740cr. Non-
interest income stood at Rs586cr, down by 9.3% yoy and by 19.0% sequentially. Operating
costs increased by 7.4% yoy but were down by 8.4% on a sequential basis. The cost-to-
income ratio stood at 39.4%, lower than its eight-quarter average of 40.2%. Gross NPAs
were down by 1.8% sequentially to Rs4,795cr, while net NPAs were down by 6.6%
sequentially to Rs2,061cr compared to Rs2,207cr in 4QFY2010. The bank’s gross and net
NPA ratios improved slightly to 2.7% (from 2.9% in 4QFY2010) and 1.2% (from 1.3% in
4QFY2010), respectively. The provision coverage ratio, excluding technical write-offs, was
at 57.0% compared to 54.8% in 4QFY2010. The bank’s CAR was at 13.3% as compared
to 12.9% in 4QFY2010.
We may revisit our earnings estimates and target price post our interaction with the bank’s
management. At the CMP, the stock is trading at valuations of 1.31x FY2012E ABV, closer
to our assigned target multiple of 1.30x. We have a Neutral rating on the stock.
August 2, 2010 2
3. Market Outlook | India Research
BGR Energy Systems
BGR Energy posted a strong set of numbers for 1QFY2011, with robust top-line growth of
191% yoy to Rs905cr (Rs311cr), primarily driven by the strong execution of its outstanding
order book. On the operating front, margins compressed by 240bp to 11.4% (13.8%) for
1QFY2011. However, on the back of strong top-line growth, net profit grew strongly by
200% yoy to Rs60cr (Rs20cr) for 1QFY2011. We will revisit our estimates post the
conference call.
Elecon Engineering
Elecon Engineering reported top-line growth of 15% to Rs247cr for 1QFY2011, while
operating profit margin came in at 15.3%. Robust top-line growth and strong margins
resulted in improved bottom-line performance at Rs13cr. We would come up with a result
note post the conference call. We maintain our Buy view on the stock with a Target Price of
Rs102.
Grasim
Grasim’s consolidated net sales during 1QFY2011 was flat on a yoy basis at Rs5,119cr.
However, the company’s comparable net sales (excluding revenue of the sponge iron
business unit, which was disposed off during 1QFY2010) were up by 2%. Net sales of the
cement division were down by 2.2%, despite a 4% increase in despatches to 9.85mn
tonnes, due to a decline in net realisations. Average net realisations were down by 7% yoy
to Rs3,432/tonne due to excess supply particularly in the southern and western regions.
Net sales of the VSF business grew by 20%, aided by 21% growth in realisations to
Rs117.9/kg. However, the volumes of the division remained flat at 67,302MT. On the
operating front, the company’s margins fell by 500bp on a yoy basis to 26.7% largely due
to the decline in operating profits of the cement business. On the bottom-line front, the
company’s net profit declined by 8.5% on a comparable basis (adjusting for Rs338cr
extraordinary profit from the sponge iron business in 1QFY2010) to Rs685cr. We maintain
a Buy rating on the stock and the target price is under review.
HCC
For 1QFY2011, HCC’s top line grew 13.6% to Rs995cr v/s our estimate of Rs962cr. OPM
stood at 12.6% (13.1%). Bottom line grew 55.6% yoy to Rs28.3cr. The robust bottom-line
growth was mainly driven by the low base effect of last year created by higher interest cost
in 1QFY2010. Since then, HCC has improved its debt equity position by QIP and
monetization of assets, resulting in a lower interest cost for the quarter.
We value HCC on an SOTP basis and have assigned 14x P/E to its FY2012E standalone
earnings. We have valued the company’s real estate venture on an NAV basis and BOT
assets on a P/BV basis to arrive at a value of Rs126/share, with limited upside from current
levels. The upside risk to our recommendation is that if Lavasa is able to garner the
envisaged valuations of Rs10,000cr, which we are not factoring in our SOTP target price,
as Lavasa is a long gestation project. Hence, we maintain our Neutral view on the stock.
August 2, 2010 3
4. Market Outlook | India Research
ICICI Bank
ICICI Bank has announced its 1QFY2011 results, wherein it has registered net profit
growth of 16.8% on a yoy basis and muted growth of 2.0% on a sequential basis to
Rs1,026cr, which is close to our estimate of Rs1,036cr. In-line operating performance and
stable asset quality with improvement in coverage ratio were the key highlights of the
result.
Advances were down by 6.9% yoy but were up by 1.8% on a sequential basis to
Rs1,84,378cr. Deposits were down by 4.4% yoy and by 0.5% qoq at Rs2,00,913cr. The
CASA ratio increased to 42.1% as compared to 30.4% in 1QFY2010 and 41.7% in
4QFY2010. CASA deposits increased by 32% yoy to Rs84,618cr. NII grew by 0.3% on a
yoy basis, while it was down by 2.2% on a sequential basis to Rs1,991cr. Non-interest
income stood at Rs1,681cr, down by 19.6% yoy and by 11.1% sequentially. Operating
costs decreased 2.8% yoy and by 4.0% on a sequential basis. The cost-to-income ratio
stood at 40.4%, lower than its eight-quarter average of 41.0%. Gross NPAs were up by
3.7% sequentially to Rs9,829cr, while net NPAs were down by 10.0% sequentially to
Rs3,456cr compared to Rs3,841cr in 4QFY2010. The bank’s gross NPA ratio was stable at
5.1% compared to 4QFY2010. While net NPA ratio improved to 1.9% (from 2.1% in
4QFY2010). The provision coverage ratio as per the RBI’s guidelines stood at 64.8%
compared to 59.5% in 4QFY2010. The bank’s CAR was at 20.2%, with Tier-I CAR at
14.0%, as compared to 19.4% in 4QFY2010.
Including subsidiaries, the stock is trading at 1.7x FY12E ABV. We have valued the bank’s
subsidiaries at Rs307 per share of ICICI Bank and the core bank at Rs839 (2.25x FY12E
ABV). We maintain a Buy on the stock with a target price of Rs1,163.
Indian Overseas Bank
Indian Overseas Bank has announced its 1QFY2011 results, wherein it has registered net
profit decline of 33.6% on a yoy basis and robust growth of 57.2% on a sequential basis to
Rs200cr, which is above our estimate on account of better-than-estimated NII growth
coupled with lower provisioning expenses. The bank made the entire FY2011 provision
(Rs82cr) in respect of the acquisition of Suvarna Sahakari Bank during this quarter itself. In
line with the operating performance, signs of improvement in asset quality were key
highlights of the result.
Advances were up by 7.9% yoy and by 2.7% on a sequential basis to Rs82,951cr. Deposits
increased by 8.6% yoy but were down by 1.2% on a sequential basis at Rs1,09,461cr. The
credit-deposit ratio stood at 75.8% compared to 72.9% as of 4QFY2010. The CASA ratio
increased to 33.1% as compared to 32.5% in 4QFY2010 and 29.2% in 1QFY2010. NII
grew by 17.9% on a yoy basis and 10.5% on a sequential basis to Rs906cr. Non-interest
income stood at Rs215cr, down by 6.8% yoy and 23.8% sequentially. Operating costs
increased by 15.2% yoy and 1.6% on a sequential basis. The cost-to-income ratio stood at
58.6%, higher than its eight-quarter average of 50.0%. Gross NPAs were down by 1.1%
sequentially to Rs3,571cr, while net NPAs were down by 10.1% sequentially to Rs1,794cr
compared to Rs1,995cr in 4QFY2010. The bank’s gross and net NPA ratios improved to
4.3% (from 4.5% as of 4QFY2010) and 2.2% (from 2.5% as of 4QFY2010), respectively.
The provision coverage ratio, including technical write-offs, was at 57.9%. The bank’s CAR
was at 14.2%, with Tier-I CAR at 8.3%, as compared to 14.8% in 4QFY2010.
While we were expecting an increase in recoveries, there were still some concerns
regarding fresh slippages from the bank’s large restructured portfolio. However, looking at
the broad improvement in asset quality, reflected in a sharp decline in NPA provisioning
expenses and net NPAs, we are upgrading our FY2012E target P/ABV multiple for the
bank to 0.95x. At the CMP, the stock is trading at valuations of 0.82x FY2012E ABV.
Hence, we recommend a Buy on the stock with a target price of Rs132.
August 2, 2010 4
5. Market Outlook | India Research
Jagran Prakashan
Jagran Prakashan reported strong set of numbers on the revenue as well as the profitability
front. While, the top line grew 16.4% yoy (14.2% qoq), earnings recorded 12.3% yoy
(52.8% qoq) growth, despite other income registering a fall of Rs10cr yoy. Key highlights of
the result include a 220bp yoy (64bp qoq) expansion in gross margin as the company
continues to benefit from the benign newsprint price and that Mid Day numbers are not
reflected in this quarter; however, management indicates Mid Day numbers will be
consolidated by 4QFY2011. We maintain Jagran Prakashan as our top pick in the print
media space. We maintain a Buy rating on the stock, though the target price is under
review.
KEC International
KEC International came out with its 1QFY2011 results. The company reported top-line
growth of 17% yoy to Rs846cr (Rs727cr), which was in line with our estimates. On the
operating front, margins contracted by 180bp to 10% (11.8%). The interest cost jumped by
21.6% yoy to Rs26cr (Rs21cr), owing to increased leverage in the cable division.
Consequently, net profit for the quarter declined by 32% yoy to Rs26cr (Rs38cr). The stock
is currently under review.
PVR
For the quarter, PVR reported top-line growth of 134% yoy (17% qoq), aided by a low base
effect, incremental revenue traction from the 15 screens added in the mid-half of
4QFY2010 (total screen count currently stands at 35,316) and a better movie pipeline. The
company reported a substantial Rs25 yoy increase in ATP to Rs157, a 940bp yoy (160bp
qoq) increase in occupancy and a 9% yoy (3% qoq) increase in average F&B realisation.
The company registered profit of Rs5.1cr (loss of Rs12.9cr last year and profit of 0.4cr in
4QFY2010), primarily aided by significant revenue traction and margin expansion of
220bp qoq to 14% (11.9%). We highlight that this quarter’s results are not comparable yoy
as multiplex’s revenue in 1QFY2010 was disrupted on account of producers’/distributors’
strike. We maintain Buy on the stock though the target price is under review.
Sadbhav Engineering
Sadbhav Engineering reported 42% top-line growth to Rs425cr against our estimates of
Rs347cr. The operating profit margin came in at 11.9% against our expectation of 11.2%.
Better-than-expected top-line growth and above-estimates margins resulted in better
bottom-line performance at Rs25.5cr. We would come up with a result note post the
conference call. Till such time, in the backdrop of rich valuations that the stock trades at,
we maintain our Neutral view on the stock.
Sarda Energy and Minerals
Sarda Energy and Minerals’ (SEML) 1QFY2011 top line grew by 132.8% yoy to Rs216.7cr
on the back of higher sales volume and realisation. While sponge iron sales increased by
28.9% yoy to 51,229 tonnes, ferro alloy sales increased by 161.7% yoy to 13,800 tonnes.
While power production was higher by 97.6% yoy to 104mn units (last year operations
were disrupted due to fire), units sold declined by 41.0% yoy, due to increased captive
usage. During the quarter, SEML produced 54,615 tonnes of pellets. Average realisation
for sponge iron, ferro alloy and power was ~Rs16,000, Rs59,000 and Rs4.22,
respectively.
August 2, 2010 5
6. Market Outlook | India Research
EBITDA grew by 973.2% yoy to Rs49.8cr as margins expanded to 23.0% from 5.0% in
1QFY2010. Raw material costs as a percentage of sales declined from 77.1% in
1QFY2010 to 60.7% on account of availability of captive coal (Karwahi mine started
operations in 3QFY2010) and resumption of shipment of iron ore from its Dongarbore
mine (mining operations were disrupted last year due to Naxal problem). SEML also
imported ferro alloy and manganese ore (Rs29.5cr) for trading purpose Staff cost and
other expenditure increased by 50% and 177% yoy to Rs7.5cr and Rs27cr, respectively. On
a sequential basis, margins improved by 304bp on account of a decrease in raw material
cost. Adjusted for the Forex loss of Rs13.7cr (1QFY2010: gain of Rs12.5cr; 4QFY2010:
gain of Rs4.8cr); net profit increased to Rs27.5cr from a loss of Rs6.5cr in 1QFY2010 and
a profit of Rs16.6cr in 4QFY2010.
We believe SEML is well poised to benefit from a) backward integration into coal and iron
ore, b) commercial production of pellets and c) increased power and ferro alloy
production. We maintain our Accumulate rating on the stock with a target price of Rs290,
valuing the stock at 5.0x FY2012E EV/EBITDA.
Result Previews-1QFY2011
GAIL
GAIL is expected to announce its 1QFY2011 results. The company’s performance is likely
to be driven by increased transmission of KG gas volumes on a yoy basis coupled with
improved performance in the petrochemical segment and benefits of marketing margins
on APM gas sales. However, performance of the LPG and liquid hydrocarbon segment is
likely to be weak on account of higher subsidy burden. Overall, GAIL's performance is
likely to be strong for the quarter. We expect the company to report top-line growth of
7.1% yoy to Rs6,451cr. Margin is expected to expand by 445bp yoy to 22.1% (15.7%). On
the bottom-line front, we expect GAIL to report growth of 34.2% yoy to Rs881cr. We will
update our view on the stock in light of slippages in gas supplies. Thus, we will update our
view post the results.
GSK Consumer
GSK Consumer is slated to announce its 2QCY2010 numbers. For the quarter, we expect
the company to post 21.5% growth in its top line to Rs570cr, driven by growth in its core
brands and new product launches. On the operating margin front, we expect the
company’s OPM to decrease by 16bp. The bottom line is expected to register 20% yoy
growth to Rs66.4cr, aided largely by top-line growth and margin expansion. We maintain
our Reduce view on the stock with a target price of Rs1,622.
India Cements
India Cements is expected to announce its 1QFY2011 results. We expect the company to
register a 2.5% decline in top line to Rs936cr due to fall in net realisations on account of
excess supply situation in the southern region. However, the company’s despatches are
expected to grow by 11.5% yoy to 2.74mn tonnes. The OPM is expected to decline by
1,615bp to 14.4%. The bottom line is expected to decline by 59.1% to Rs53cr. We
maintain a Buy view on the stock with a Target Price of Rs138.
August 2, 2010 6
7. Market Outlook | India Research
Madras Cements
Madras Cements is expected to announce its 1QFY2011 results. We expect the company
to post a 23.1% yoy decline in top line to Rs591cr due to fall in net realisations. Although,
the company’s despatches are expected to be flat, we expect net realisations to decline by
24.8% yoy due to the excess supply situation in the southern region. The OPM is expected
to decline by 1,129bp yoy to 26.4%. The company’s bottom line is expected to decline by
65.6% to Rs48cr. We maintain a Buy view on the stock with a Target Price of Rs141.
Motherson Sumi Systems
Motherson Sumi is slated to announce its 1QFY2011 results. The company is expected to
post robust 40% yoy growth in revenue to Rs1,960cr for the quarter. On the operating
front, the company is expected to post a 712bp yoy margin expansion to 13.1%. Hence,
net profit is expected to surge substantially by 950% yoy to Rs116cr. The stock rating is
under review.
Nestle India
Nestle is expected to announce its 2QCY2010 results. For the quarter, we expect Nestle to
report 19.3% yoy growth in its top line to Rs1,444cr. The company’s flagship brands
Maggi and Nescafé are expected to grow at a steady pace. Nestle’s earnings for the
quarter are expected to grow by 16.5% yoy to Rs188.7cr, driven largely by top-line growth.
We maintain a Neutral view on the stock.
NMDC
NMDC is slated to announce its 1QFY2011 results. We expect the company’s top line to
grow by 28.6% yoy to Rs1,643cr on account of higher realisations. On the operating front,
EBITDA margin is expected to contract by 485bp yoy to 69.3%. The bottom line is expected
to grow by 17.3% yoy to Rs908cr. We maintain Reduce on the stock with a Target Price of
Rs247.
August 2, 2010 7
8. Market Outlook | India Research
Economic and Political News
State-owned oil firms raised jet fuel (ATF) on Saturday, prices by 2.7%
April-June fiscal deficit down 68%
Power tariffs hiked in Bengal
Corporate News
RIL-owned Infotel raises US $500mn from RBS consortium
Adani starts third unit of Mundra power plant
Maruti to launch five CNG versions of its cars
ADAG, Universal near deal on US $1.5bn theme park
Source: Economic Times, Business Standard, Business Line, Financial Express, Mint
Events for the day
Apar Ind. Results
GAIL India Results
Glaxosmithkline Consumer Results
Gokaldas Exports Results
Gulf Oil Corp. Results
India Cements Results
Madras Cements Results
Motherson Sumi Systems Results
Nalwa Sons Investment Results
Nestle India Results
NMDC Results
Ramco Ind. Results
Suprajit Engineering Results
August 2, 2010 8
9. Market Outlook | India Research
Research Team Tel: 022-4040 3800 E-mail: research@angeltrade.com Website: www.angeltrade.com
DISCLAIMER
This document is solely for the personal information of the recipient, and must not be singularly used as the basis of any investment
decision. Nothing in this document should be construed as investment or financial advice. Each recipient of this document should make
such investigations as they deem necessary to arrive at an independent evaluation of an investment in the securities of the companies
referred to in this document (including the merits and risks involved), and should consult their own advisors to determine the merits and
risks of such an investment.
Angel Broking Limited, its affiliates, directors, its proprietary trading and investment businesses may, from time to time, make investment
decisions that are inconsistent with or contradictory to the recommendations expressed herein. The views contained in this document are
those of the analyst, and the company may or may not subscribe to all the views expressed within.
Reports based on technical and derivative analysis center on studying charts of a stock's price movement, outstanding positions and
trading volume, as opposed to focusing on a company's fundamentals and, as such, may not match with a report on a company's
fundamentals.
The information in this document has been printed on the basis of publicly available information, internal data and other reliable sources
believed to be true, but we do not represent that it is accurate or complete and it should not be relied on as such, as this document is for
general guidance only. Angel Broking or any of its affiliates/ group companies shall not be in any way responsible for any loss or
damage that may arise to any person from any inadvertent error in the information contained in this report. Angel Broking Limited has
not independently verified all the information contained within this document. Accordingly, we cannot testify, nor make any representation
or warranty, express or implied, to the accuracy, contents or data contained within this document. While Angel Broking Limited
endeavours to update on a reasonable basis the information discussed in this material, there may be regulatory, compliance, or other
reasons that prevent us from doing so.
This document is being supplied to you solely for your information, and its contents, information or data may not be reproduced,
redistributed or passed on, directly or indirectly.
Angel Broking Limited and its affiliates may seek to provide or have engaged in providing corporate finance, investment banking or other
advisory services in a merger or specific transaction to the companies referred to in this report, as on the date of this report or in the past.
Neither Angel Broking Limited, nor its directors, employees or affiliates shall be liable for any loss or damage that may arise from or in
connection with the use of this information.
Note: Please refer to the important `Stock Holding Disclosure' report on the Angel website (Research Section).
Address: Acme Plaza, ‘A’ Wing, 3rd Floor, M.V. Road, Opp. Sangam Cinema, Andheri (E), Mumbai - 400 059.
Tel : (022) 3952 4568 / 4040 3800
Angel Broking Ltd: BSE Sebi Regn No : INB 010996539 / CDSL Regn No: IN - DP - CDSL - 234 - 2004 / PMS Regn Code: PM/INP000001546
Angel Capital & Debt Market Ltd: INB 231279838 / NSE FNO: INF 231279838 / NSE Member code -12798 Angel Commodities Broking (P) Ltd: MCX Member ID: 12685 / FMC Regn No: MCX / TCM /
CORP / 0037 NCDEX : Member ID 00220 / FMC Regn No: NCDEX / TCM / CORP / 0302
August 2, 2010 9