Download to read offline
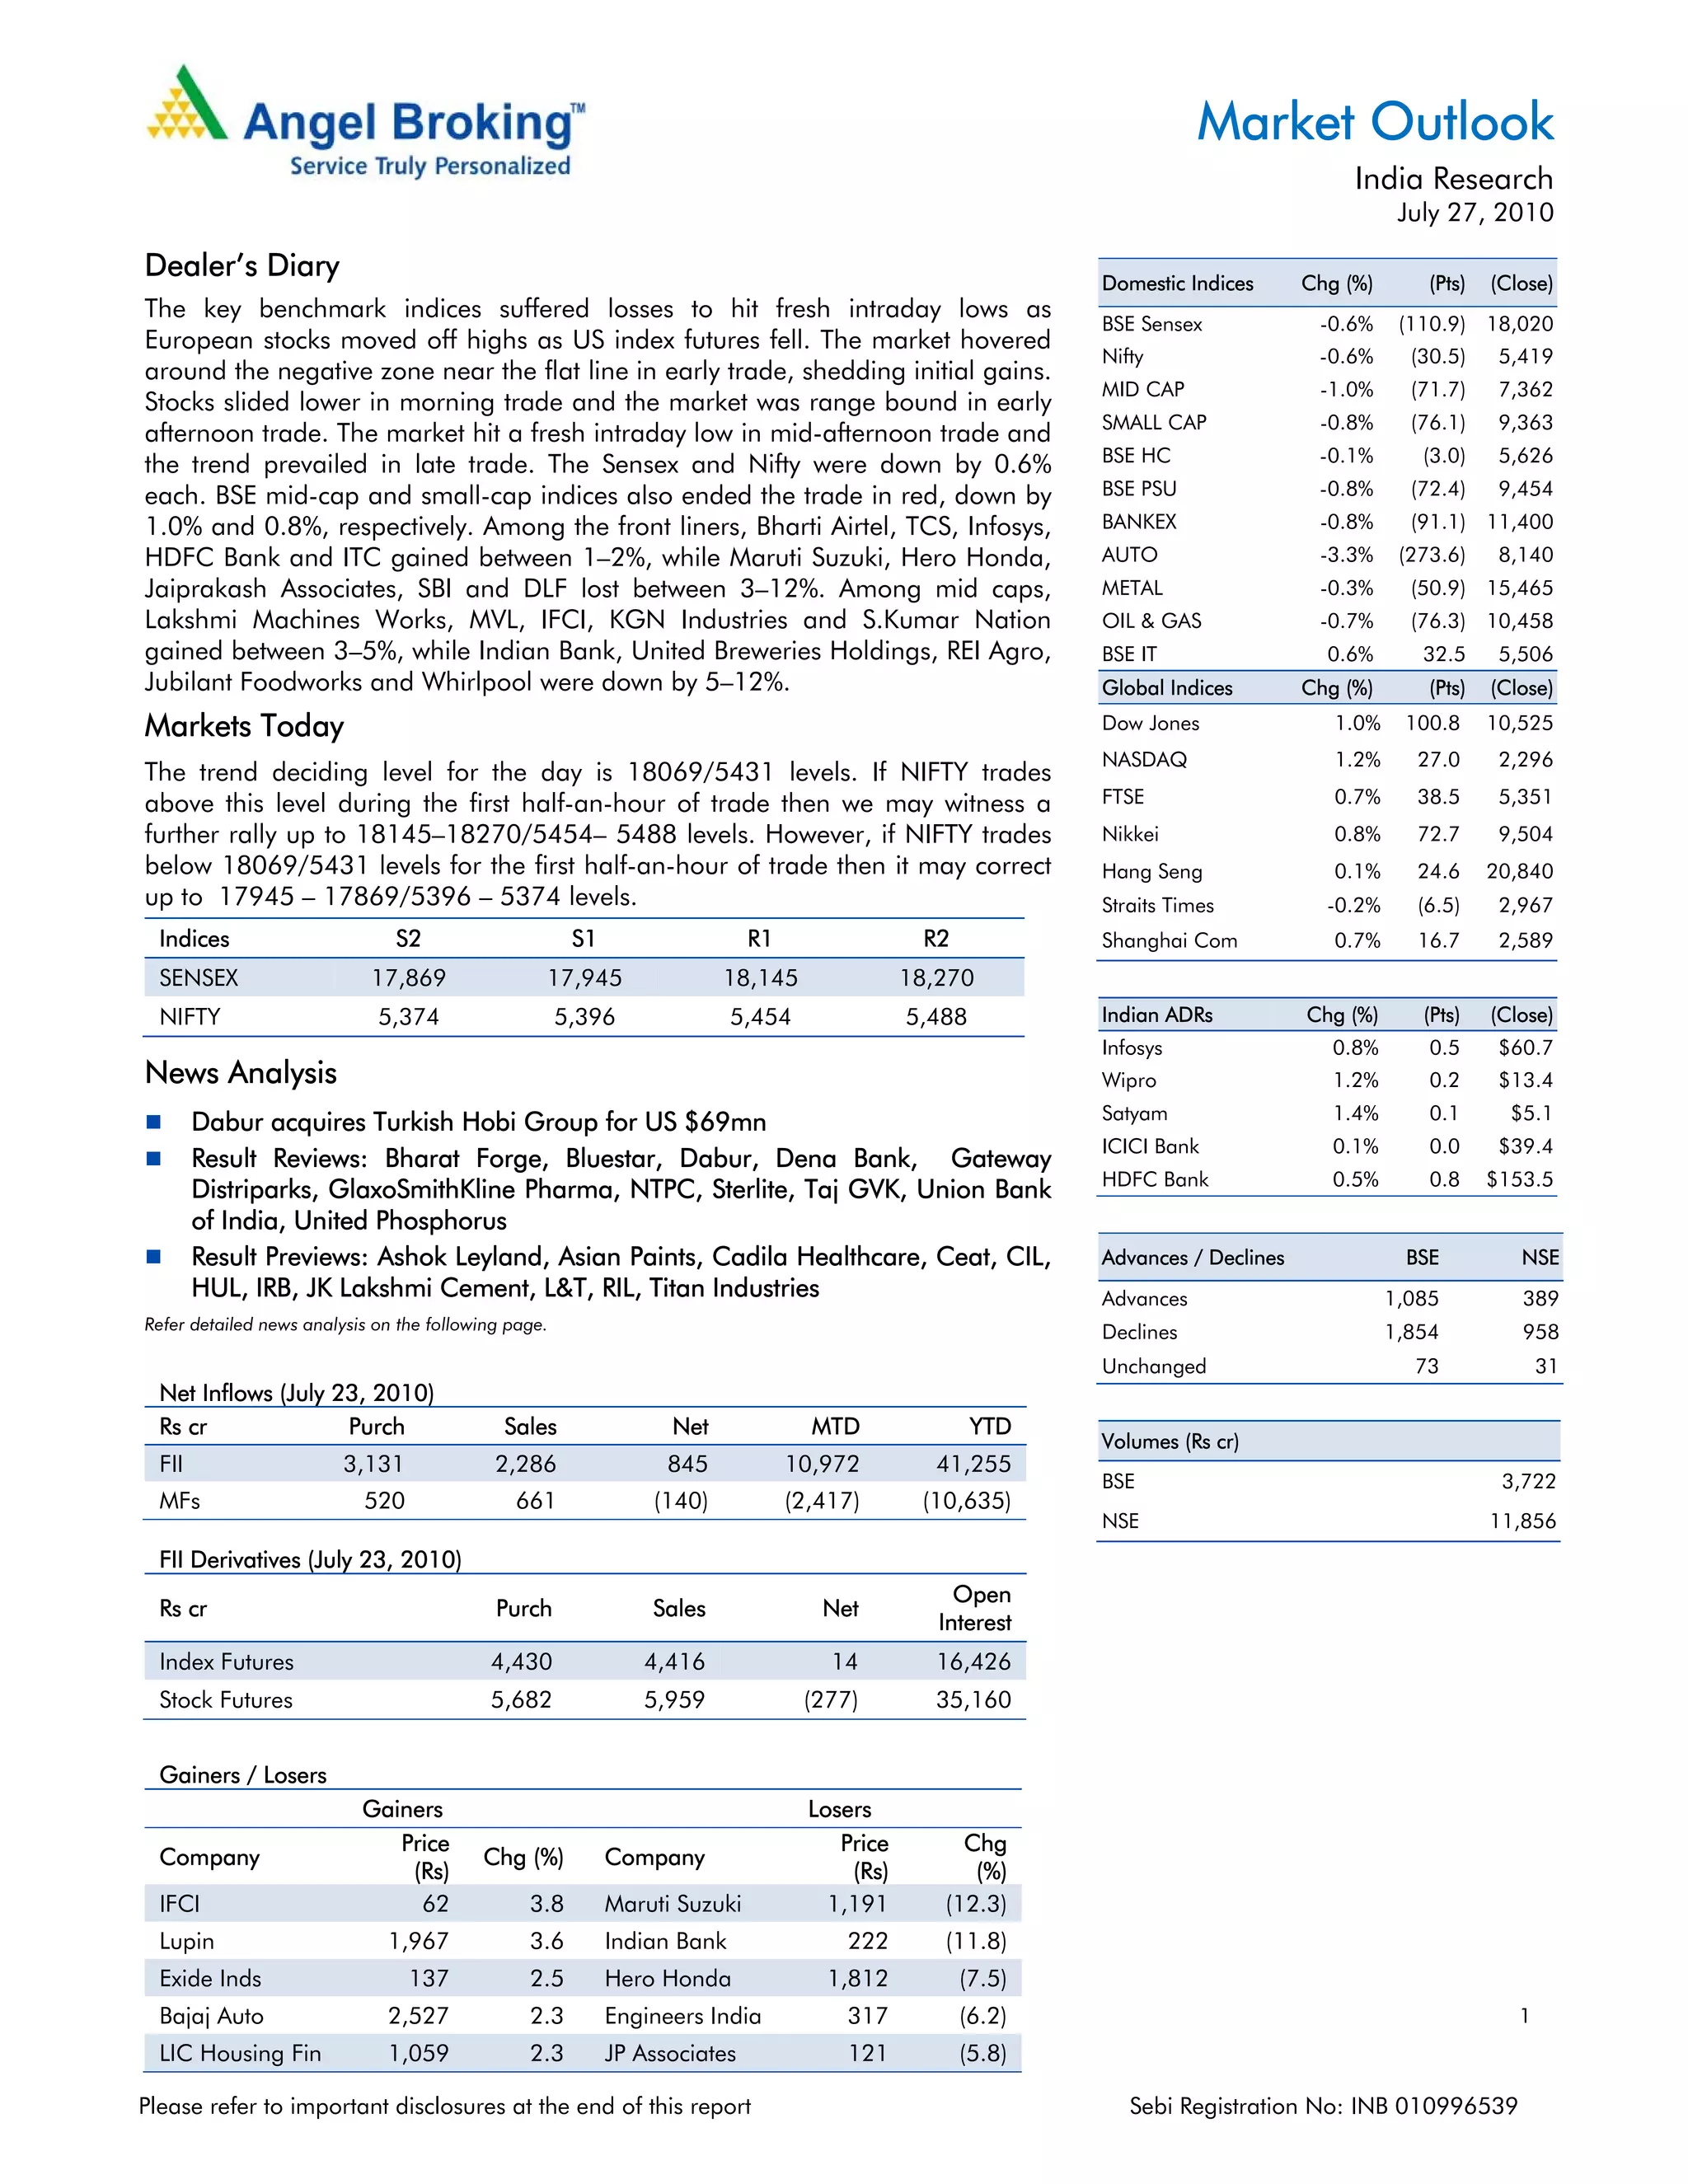
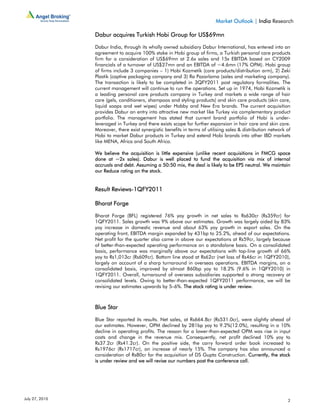


The document provides an analysis of market indices in India, which declined slightly on July 27, 2010. It also summarizes results reports from several companies, including Bharat Forge, Blue Star, Dabur, Dena Bank, and Gateway Distriparks. Gateway Distriparks reported subdued revenue growth and higher losses than expected due to lower realizations and a delay in expansion funding.


