SlideShare a Scribd company logo
1QFY2011 Result Update | Shipping
                                                                                                                                     July 30, 2010


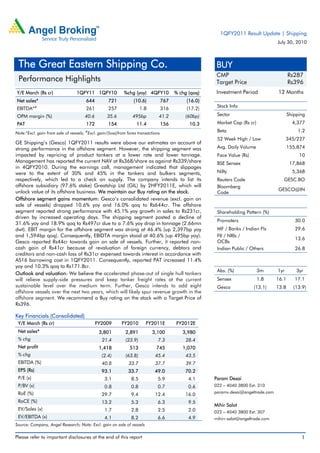
 The Great Eastern Shipping Co.                                                                         BUY
                                                                                                        CMP                                 Rs287
 Performance Highlights                                                                                 Target Price                        Rs396
Y/E March (Rs cr)                1QFY11 1QFY10              %chg (yoy) 4QFY10            % chg (qoq)    Investment Period            12 Months
Net sales*                             644         721           (10.6)            767        (16.0)
            #                                                                                           Stock Info
EBITDA*                                261         257                1.8          316        (17.2)
OPM margin (%)                        40.6        35.6          495bp          41.2          (60bp)     Sector                              Shipping
PAT                                    172         154             11.4            156         10.3     Market Cap (Rs cr)                    4,377

Note:*Excl. gain from sale of vessels; #Excl. gain/(loss)from forex transactions                        Beta                                    1.2
                                                                                                        52 Week High / Low                 345/227
GE Shipping’s (Gesco) 1QFY2011 results were above our estimates on account of
strong performance in the offshore segment. However, the shipping segment was                           Avg. Daily Volume                   155,874
impacted by repricing of product tankers at a lower rate and lower tonnage.                             Face Value (Rs)                          10
Management has reported the current NAV at Rs368/share as against Rs339/share                           BSE Sensex                           17,868
in 4QFY2010. During the earnings call, management indicated that slippages
were to the extent of 30% and 45% in the tankers and bulkers segments,                                  Nifty                                 5,368
respectively, which led to a check on supply. The company intends to list its                           Reuters Code                    GESC.BO
offshore subsidiary (97.6% stake) Greatship Ltd (GIL) by 2HFY2011E, which will                          Bloomberg
unlock value of its offshore business. We maintain our Buy rating on the stock.                                                      GESCO@IN
                                                                                                        Code
Offshore segment gains momentum: Gesco’s consolidated revenue (excl. gain on
sale of vessels) dropped 10.6% yoy and 16.0% qoq to Rs644cr. The offshore
segment reported strong performance with 45.1% yoy growth in sales to Rs231cr,                          Shareholding Pattern (%)
driven by increased operating days. The shipping segment posted a decline of
                                                                                                        Promoters                              30.0
31.6% yoy and 18.9% qoq to Rs497cr due to a 7.6% yoy drop in tonnage (2.66mn
dwt). EBIT margin for the offshore segment was strong at 46.4% (up 2,397bp yoy                          MF / Banks / Indian Fls                29.6
and 1,594bp qoq). Consequently, EBIDTA margin stood at 40.6% (up 495bp yoy).                            FII / NRIs /
                                                                                                                                               13.6
Gesco reported Rs44cr towards gain on sale of vessels. Further, it reported non-                        OCBs
cash gain of Rs41cr because of revaluation of foreign currency, debtors and                             Indian Public / Others                 26.8
creditors and non-cash loss of Rs31cr expensed towards interest in accordance with
AS16 borrowing cost in 1QFY2011. Consequently, reported PAT increased 11.4%
yoy and 10.3% qoq to Rs171.8cr.
                                                                                                        Abs. (%)             3m      1yr        3yr
Outlook and valuation: We believe the accelerated phase-out of single hull tankers
will relieve supply-side pressures and keep tanker freight rates at the current                         Sensex               1.8     16.1      17.1
sustainable level over the medium term. Further, Gesco intends to add eight                             Gesco             (13.1)     13.8     (13.9)
offshore vessels over the next two years, which will likely spur revenue growth in the
offshore segment. We recommend a Buy rating on the stock with a Target Price of
Rs396.

Key Financials (Consolidated)
 Y/E March (Rs cr)                           FY2009       FY2010        FY2011E          FY2012E
 Net sales*                                   3,801          2,891          3,100           3,980
 % chg                                         21.4          (23.9)            7.3           28.4
 Net profit                                   1,418            513            745           1,070
 % chg                                         (2.4)         (63.8)          45.4            43.5
 EBITDA (%)                                    40.8           33.7           37.7            39.7
 EPS (Rs)                                      93.1           33.7           49.0            70.2
 P/E (x)                                         3.1            8.5           5.9              4.1     Param Desai
 P/BV (x)                                        0.8            0.8           0.7              0.6     022 – 4040 3800 Ext: 310
 RoE (%)                                                                                               paramv.desai@angeltrade.com
                                               29.7             9.4          12.4            16.0
 RoCE (%)                                      13.2             5.3           6.3              9.5
                                                                                                       Mihir Salot
 EV/Sales (x)                                    1.7            2.8           2.5              2.0     022 – 4040 3800 Ext: 307
 EV/EBITDA (x)                                   4.1            8.2           6.6              4.9     mihirr.salot@angeltrade.com
Source: Company, Angel Research; Note: Excl. gain on sale of vessels

Please refer to important disclosures at the end of this report                                                                                   1
GE Shipping | 1QFY2011 Result Update


                                             Exhibit 1: 1QFY2011 performance (Consolidated)
                                              Y/E March (Rs cr)                   1QFY11 1QFY10 % chg (yoy) 4QFY10 % chg (qoq)
                                              Revenue*                               644       721         (10.6)             767            (16.0)
                                              Total expenditure                      383       464         (17.5)             451            (15.1)
                                              EBITDA*#                               261       257               1.8          316            (17.2)
                                              EBITDA margin (%)                      40.6      35.6        495bp          41.2              (60bp)
                                              Depreciation                           105         96              9.0          111             (5.9)
                                              Interest                                93         45         108.7              46            100.5
                                              Gain on sale of vessels                 44       119         (63.1)              12           (277.2)
                                              Foreign exchange gain/(loss)            41      (103)                           (67)
                                              Other income                            39         45        (13.5)              60            (35.0)
                                              PBT                                    187       178               5.1          162             15.4
                                              Tax                                     14         24        (40.1)               7            114.7
                                              Tax rate (%)                            7.7      13.5                           4.1
                                              Adj. PAT                               173       154              12.2          156             11.1
                                              EO/Prior period items                    0          0                             0
                                              Minority interest                       (1)         0                             0
                                              Reported PAT                          171.8     154.2             11.4     155.7                10.3
                                              PAT margin (%)                         26.7      21.4        528bp          20.3              635bp
                                              Number of shares (cr)                   15         15                            15
                                              Adj. EPS (Rs) - quarterly              11.3      10.1             11.4      10.2                10.3
                                              Source: Company, Angel Research; Note:*Excl. gain from sale of vessels; #Excl. gain/(loss)from
                                             forex transactions


                                             Exhibit 2: Segment-wise performance
                                              Y/E March (Rs cr)        1QFY11       1QFY10      % chg (yoy)      4QFY10              % chg (qoq)
                                              Revenue                       728        886            (17.8)           839                   (13.2)
                                              Shipping                      497        726            (31.6)           612                   (18.9)
                                              Offshore                      231        159              45.1           227                     2.1
                                              PBIT                          280        223              25.9           209                    34.3
                                              Shipping                      173        187              (7.5)          140                    23.8
                                              Offshore                      107         36            199.9             69                    55.4
                                              Margins (%)                  38.5        25.2        1,338bp             24.9             1,365bp
                                              Shipping                     34.8        25.8           909bp            22.8             1,201bp
                                              Offshore                     46.4        22.5        2,397bp             30.5             1,594bp
                                              Source: Company, Angel Research


Exhibit 3: Quarterly TCY trend
                                                                                                                               %chg %chg
Average TCY (US $/Day)            1QFY09 2QFY09 3QFY09 4QFY09 1QFY10 2QFY10 3QFY10 4QFY10 1QFY11
                                                                                                                               (yoy) (qoq)
Crude carriers                    40,737   53,292    37,653       34,450   23,819    18,779    17,778    29,322        20,444 (14.2) (30.3)
Product carriers
                                  21,541   28,648    23,120       21,495   17,088    18,865    19,131    17,920        15,485        (9.4) (13.6)
(incl. gas carriers)
Dry bulk                          50,619   48,822    30,816       23,264   19,489    17,065    20,964    23,963        24,484        25.6      2.2
Source: Company, Angel Research


July 30, 2010                                                                                                                                     2
GE Shipping | 1QFY2011 Result Update


                Shipping segment witnessed a slowdown

                For 1QFY2011, Gesco reported lower revenue days (-2.3% yoy) and tonnage
                (-7.6% yoy). Further, the company witnessed a 14.2% yoy and 9.4% decline in TCY
                for crude and product tankers, respectively; while dry bulk reported a 25% increase
                at US $24,484/day in 1QFY2011. For 1QFY2011, the company maintained the
                spot-time mix for total fleet at 47:53, which is near its historical levels. Crude
                tankers and product carriers (including gas carriers) are covered to the extent of
                43% and 72% of their operating days, respectively. Dry bulk carriers are covered to
                the extent of 46% of the fleet’s operating days. Revenue visibility for the remaining
                part of FY2010–11 is nearly Rs467cr.

                Update on asset purchase and sales

                During the quarter, Gesco modified its contract of building two Suezmax tankers to
                three very large crude carriers (VLCCs) with better prospects for the latter as well as
                relative pricing. The company sold three older tankers as part of the mandatory
                single hull tanker phase out by 2010. Further 2–3 vessels are likely to be phased
                out during FY2011.

                Moreover, GIL sold PSV Greatship Diya, while it took delivery of PSV Greatship
                Rekha and sold it immediately upon delivery. Consequently, the current owned
                and/or operated fleet of Gesco and its subsidiaries stands at 29 tankers, six dry
                bulk carriers, five PSVs, seven AHTSVs, two jackup rigs and two MPSSV.

                Well-capitalised balance sheet

                Gesco’s net consolidated debt stands at 0.25x as of June 2010. The company has
                a planned capex of US $573mn (US $118mn already paid) in the shipping
                segment, resulting in addition of 1.3mn dwt (three tankers and five bulkers) to the
                fleet by FY2013E. The company has indicated a delivery schedule of five dry bulk
                carriers (three in 4QFY2011 and two in 1QFY2012) and three VLCCs (two in
                1QFY2012 and one in 1QFY2013). The planned capex for the offshore segment is
                of US $362mn over the next two years (US $125mn already paid), which is likely
                to be funded through IPO proceeds.

                Non-cash adjustments during the quarter

                The company has booked a non-cash gain of Rs41cr in 1QFY2011 v/s loss of
                Rs103cr in 1QFY2010 on account of revaluation of bank balances, creditors and
                debtors recorded in foreign currency. Moreover, as per provisions of AS-16, non
                cash adjustment of Rs32cr has been accounted for under interest cost due to
                exchange rate difference between foreign and local currency borrowing costs.


July 30, 2010                                                                                        3
GE Shipping | 1QFY2011 Result Update


Exhibit 4: Quarterly revenue trend                                                          Exhibit 5: Quarterly EBITDA trend
          800                                              (1.0)                0                       350                                                         41.2           40.6          45
          700                                                          (10.6)   -5                                35.6                                                                           40
                                                                                                        300
          600                                                                   -10                                                                                                              35
                                                                                                        250                                        28.2
                                                                                -15                                                25.4                                                          30
          500
                    (19.7)                                                      -20                     200                                                                                      25
(Rs cr)


                                                                                             (Rs cr)
          400


                                                                                      (%)


                                                                                                                                                                                                        (%)
                                                                                -25                     150                                                                                      20
          300                                 (27.0)
                                                                                -30                                                                                                              15
          200                                                                                           100
                                                                                -35                                                                                                              10
          100                                                                   -40                      50                                                                                      5
                                 (42.5)
            0                                                                   -45                       0                                                                                      0
                1QFY10       2QFY10       3QFY10       4QFY10      1QFY11                                        1QFY10          2QFY10           3QFY10           4QFY10         1QFY11
                         Revenue (LHS)             yoy change (RHS)                                                             EBITDA (LHS)              EBITDA Margin (RHS)


Source: Company, Angel Research                                                             Source: Company, Angel Research


                                                                                            Exhibit 6: Quarterly profitabilty trend
                                                                                                       180                                                                                        40
                                                                                                       160                                                                 24.1                   20
                                                                                                       140                                                                                11.4
                                                                                                                                                                                                  0
                                                                                                       120
                                                                                                       100                                                                                        -20
                                                                                             (Rs cr)


                                                                                                                                                                                                        (%)
                                                                                                        80                                                                                        -40
                                                                                                        60
                                                                                                                       (64.0)                                                                     -60
                                                                                                        40                                                (67.9)
                                                                                                        20                             (81.0)                                                     -80
                                                                                                         0                                                                                        -100
                                                                                                                 1QFY10          2QFY10           3QFY10           4QFY10          1QFY11

                                                                                                                                      PAT (LHS)           yoy change (RHS)


                                                                                            Source: Company, Angel Research

Exhibit 7: Global peer valuation
                                             Market Cap                 P/E (x)                        P/B (x)            EV/EBITDA (x)               EV/Sales (x)                   RoE (%)
                                                   US$ mn          CY10         CY11        CY10              CY11        CY10         CY11          CY10           CY11          CY10           CY11
Tankers
Frontline                                              2,382           9.7        9.7          2.9               2.8            8.0        7.8            4.4          4.4         29.7          24.7
Overseas Shipholding                                   1,193       164.1        17.7           0.6               0.6       11.2            8.0            2.3          2.3         -0.1           3.7
Ship Finance Intl.                                     1,508           8.5        9.2          1.7               1.7            7.0        7.1            9.4          9.4         23.2          18.2
Offshore
Transocean                                         14,784              6.2        5.6          0.7               0.6            5.0        4.7            2.3          2.3         11.2          11.3
Diamond Offshore                                       8,271           8.3        8.5          2.1               1.9            4.8        4.9            2.6          2.6         27.9          25.8
Nabors Ind.                                            5,251          19.9      12.2           1.0               0.9            6.1        5.3            1.9          1.9          4.5           7.2
Aban Offshore*                                          818            6.0        5.4          1.3               1.0            8.6        8.8            5.2          5.2         24.5          21.3
Dry Bulk
China Cosco Holding                                14,044             24.9      20.4           2.2               2.0       13.3           10.4            1.3          1.3          9.4          10.8
China Ship. Dev.                                       5,019          17.0      12.7           1.5               1.4       10.7            8.0            2.9          2.9          9.0          11.1
STX Pan Ocean                                          2,166          22.1      12.0           1.0               0.9       15.3           10.3            0.8          0.8          4.9           8.7
Average                                                               28.7      11.4           1.5               1.4            9.0        7.5            3.3          3.3         14.4          14.3
Gesco*                                                  976            5.9        4.1          0.7               0.6            6.6        4.9            2.5          2.0         12.4          16.0
Source: Company, Bloomberg, Angel Research; Note: * Fiscal year ending (FY2011E and FY2012E)


July 30, 2010                                                                                                                                                                                            4
GE Shipping | 1QFY2011 Result Update


                Investment Arguments

                Tanker freight rates bottoming out

                Though the tanker segment witnessed a slowdown in 1QFY2011, we expect rates
                to bottom out with the early signs of growth in US oil demand (gasoline demand
                likely to improve going ahead), single hull phase outs and order book slippages to
                provide support to the tanker market. The International Energy Agency (IEA)
                estimates global oil demand to register a 1.5% CAGR over CY2009–11E,
                increasing by 2.6mbd to 87.5mbd as against the decline of 1.5% in CY2009. As
                per Clarksons, 13% and 14% of the existing capacity (fleet) of crude and product
                tankers will be added in CY2010. However, the accelerated phase-out of single
                hull tankers, which accounts for 12% of the world's existing tanker fleet, will relieve
                supply-side pressures and keep freight rates at the current sustainable level over
                the near to medium term. Gesco will be a key beneficiary of higher tanker freight
                rates as it derives around 46% of its consolidated revenue from the tanker
                segment.

                GIL IPO to unlock value

                Gesco intends to list GIL by 2HFY2011E through fresh equity issuance. We believe
                this will unlock potential value of the offshore business, which globally trades at
                higher multiples than the shipping business due to better stability and high visibility
                in earnings. We have valued Gesco's offshore business at 6.5x FY2012E
                EV/EBITDA, in line with the global peers, fetching Rs133/share or Rs2,021cr.

                Relatively younger fleet

                The average age of Gesco’s fleet (35 vessels) is around 10.5 years, which is
                relatively young given that most vessels have a life of 25 years. Currently, 84% of
                the tanker dwt is double hull. The company has applied depreciation on an
                accelerated basis for the vessels that will need to be phased-out by FY2010 as per
                the MARPOL’s regulations. Offshore assets such as platform supply vessels and
                anchor handling tugs are relatively young and, hence, the company could earn
                better rates on such assets.


                Exhibit 8: Fleet dynamics


                   20                                                                  19
                                                        17

                   15                                               13.6
                                   11
                            10.1                  9.3
                   10
                                                                           6
                    5
                                                                                              1
                    0
                          Crude carriers      Product tankers      Bulk carriers      Gas carriers

                                        Age Profile (years)       Number of vessels

                Source: Company, Angel Research


July 30, 2010                                                                                        5
GE Shipping | 1QFY2011 Result Update


                Outlook and Valuation

                We believe the accelerated phase-out of single hull tankers will relieve supply-side
                pressures and keep tanker freight rates at the current sustainable level over the
                near to medium term. Further, Gesco intends to add eight offshore vessels over the
                next two years, which would spur the company’s revenue growth. We have valued
                the shipping business on an NAV basis, which fetches Rs263/share (10% discount
                to NAV) and the offshore business at 6.5x FY2012E EV/EBIDTA, in line with its
                global peers, contributing Rs133/share. Based on our target price of Rs396, the
                implied EV/EBITDA, P/BV and P/E multiples work out to 6.0x, 0.8x and 5.6x,
                respectively, for FY2012E. Thus, on account of trading at a significant discount to
                its global peers, we recommend a Buy rating on the stock with a Target Price of
                Rs396.


                Exhibit 9: Trading close to five-year forward P/B

                          2.0
                          1.5
                          1.0
                    (X)


                          0.5
                          0.0
                                Jun-05


                                                  Feb-06
                                                           Jun-06


                                                                              Feb-07
                                                                                       Jun-07


                                                                                                          Feb-08
                                                                                                                   Jun-08


                                                                                                                                     Feb-09
                                                                                                                                               Jun-09


                                                                                                                                                                 Feb-10
                                                                                                                                                                          Jun-10
                                         Oct-05


                                                                     Oct-06


                                                                                                 Oct-07


                                                                                                                            Oct-08


                                                                                                                                                        Oct-09
                                                                    P/BV                        5 year Average P/BV


                Source: Bloomberg, Angel Research


                Exhibit 10: Key assumptions
                                                                                                                                FY2011E                            FY2012E
                Freight rates change (%)
                Tanker                                                                                                                        5.0                           10.0
                Dry Bulk                                                                                                                 (5.0)                                 5.0
                Net Tanker fleet addition (%)                                                                                                 7.8                              4.9
                Single hull tanker scrapping (mn dwt)                                                                                         15                                   25
                Source: Angel Research


July 30, 2010                                                                                                                                                                       6
GE Shipping | 1QFY2011 Result Update


                Profit & Loss Statement (Consolidated)
                Y/E March (Rs cr)              FY07    FY08    FY09     FY10     FY21E   FY12E
                Gross sales                    2,142   3,108   3,792    2,857    3,080   3,950
                Less: Excise duty                  -       -        -        -       -       -
                Net sales                      2,142   3,108   3,792    2,857    3,080   3,950
                Other operating inc.             24      22        9       34      20      30
                Total operating income         2,166   3,131   3,801    2,891    3,100   3,980
                % chg                            6.4    44.5    21.4    (23.9)     7.3    28.4
                Total expenditure              1,098   1,745   2,251    1,916    1,932   2,400
                Personnel                       184     246     303       337     372     478
                Repairs & Maintenance           134     178     226       162     180     231
                Dir. exp. (excl excep. item)    501     667    1,057      708     667     796
                Hire of chartered ships         238     592     569       609     605     756
                Others                           41      61       96      100     109     139
                EBITDA                         1,067   1,386   1,550     974     1,169   1,580
                % chg                           14.1    29.8    11.8    (37.1)    20.0    35.2
                (% of Net Sales)                49.3    44.3    40.8     33.7     37.7    39.7
                Depreciation                    268     355     454       425     468     517
                EBIT                            799    1,031   1,096     550      701    1,063
                % chg                           41.4    29.0     6.3    (49.8)    27.6    51.7
                (% of Net sales)                36.9    32.9    28.8     19.0     22.6    26.7
                Interest & other chgs.          111     162     185       212     280     223
                Other income                    252     632     542       217     380     309
                (% of PBT)                      26.8    42.1    37.3     39.2     47.4    26.9
                Share in profit of asso.           -       -        -        -       -       -
                Recurring PBT                   940    1,501   1,453     555      802    1,150
                % chg                            5.5    59.7    (3.2)   (61.8)    44.5    43.5
                Extraordinary Expense/(Inc.)       -       -        -        -       -       -
                PBT (reported)                  940    1,501   1,453     555      802    1,150
                Tax                              33      47       45       45      56      81
                (% of PBT)                       3.5     3.2     3.1      8.1      7.0     7.0
                PAT (reported)                  912    1,453   1,418     513      745    1,070
                Add: Share of asso. earning      (0)       -        -        -       -       -
                Less: Minority interest (MI)     (0)       -        -        -       -       -
                Prior period items                5      (0)      10        3        -       -
                PAT after MI (reported)         912    1,453   1,418     513      745    1,070
                ADJ. PAT                        907    1,454   1,408     510      745    1,070
                % chg                            7.1    60.2    (3.2)   (63.8)    46.3    43.5
                (% of Net Sales)                41.9    46.4    37.0     17.6     24.0    26.9
                Basic EPS (Rs)                  59.9    95.4    93.1     33.7     49.0    70.2
                Fully Diluted EPS (Rs)          59.6    95.4    92.4     33.5     49.0    70.2


July 30, 2010                                                                                7
GE Shipping | 1QFY2011 Result Update


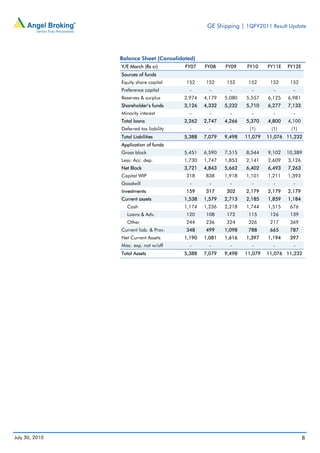
                Balance Sheet (Consolidated)
                Y/E March (Rs cr)        FY07    FY08    FY09    FY10     FY11E   FY12E
                Sources of funds
                Equity share capital     152     152     152      152      152     152
                Preference capital         -       -       -       -        -       -
                Reserves & surplus       2,974   4,179   5,080   5,557    6,125   6,981
                Shareholder’s funds      3,126   4,332   5,232   5,710    6,277   7,133
                Minority interest          -       -       -       -        -       -
                Total loans              2,262   2,747   4,266   5,370    4,800   4,100
                Deferred tax liability     -       -       -      (1)      (1)     (1)
                Total Liabilities        5,388   7,079   9,498   11,079   11,076 11,232
                Application of funds
                Gross block              5,451   6,590   7,515   8,544    9,102   10,389
                Less: Acc. dep.          1,730   1,747   1,853   2,141    2,609   3,126
                Net Block                3,721   4,843   5,662   6,402    6,493   7,263
                Capital WIP              318     838     1,918   1,101    1,211   1,393
                Goodwill                   -       -       -       -        -       -
                Investments              159     317     302     2,179    2,179   2,179
                Current assets           1,538   1,579   2,713   2,185    1,859   1,184
                   Cash                  1,174   1,236   2,218   1,744    1,515    676
                   Loans & Adv.          120     108     172      115      126     139
                   Other                 244     236     324      326      217     369
                Current liab. & Prov.    348     499     1,098    788      665     787
                Net Current Assets       1,190   1,081   1,616   1,397    1,194    397
                Misc. exp. not w/off       -       -       -       -        -       -
                Total Assets             5,388   7,079   9,498   11,079   11,076 11,232


July 30, 2010                                                                             8
GE Shipping | 1QFY2011 Result Update


                Cash Flow Statement (Consolidated)
                Y/E March (Rs cr)               FY07    FY08    FY09    FY10 FY11E      FY12E
                Profit before tax                940    1,501   1,453    555     802    1,150
                Depreciation                     268     355     384     425     468     517
                Change in Wkg Cap.             (153)     100      21     (38)    104     (43)
                Less: Other inc & Adj.             3    (108)    231     139        -       -
                Direct taxes paid                (38)    (50)    (47)    (54)    (56)    (81)
                Cash Flow from Operations      1,021    1,798   2,042   1,026 1,317     1,543
                (Inc)/Dec in Fixed assets     (1,415) (1,972) (1,823)   (866)   (668) (1,469)
                (Inc)/Dec in Investments         (74)   (229)    (39) (1,932)       -       -
                Investments in subsidiaries        3      70      60      25        -       -
                Other income                      89     122     147     112        -       -
                Cash Flow from Investing      (1,397) (2,009) (1,654) (2,662)   (668) (1,469)
                Issue of equity                     -     22       3        -       -       -
                Inc/(Dec) in loans               443     636     918    1,558   (570)   (700)
                Dividend paid (incl. tax)      (197)    (213)   (222)    (46)   (308)   (214)
                Others                         (114)    (172)   (107)   (349)       -       -
                Cash Flow from Financing         132     273     593    1,163   (878)   (914)
                Inc/(Dec) in cash              (244)      63     981    (474)   (229)   (840)
                Opening Cash balances          1,418    1,174   1,236   2,218 1,744     1,515
                Closing Cash balances          1,174    1,236   2,218   1,744 1,515      676


July 30, 2010                                                                               9
GE Shipping | 1QFY2011 Result Update


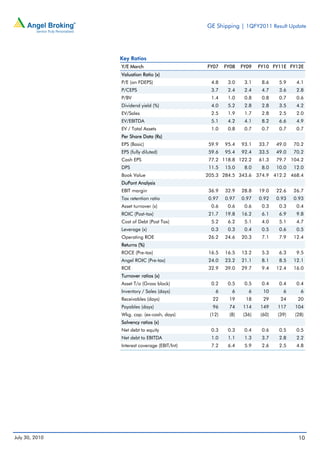
                Key Ratios
                Y/E March                      FY07    FY08   FY09   FY10 FY11E FY12E
                Valuation Ratio (x)
                P/E (on FDEPS)                   4.8    3.0    3.1    8.6    5.9    4.1
                P/CEPS                           3.7    2.4    2.4    4.7    3.6    2.8
                P/BV                             1.4    1.0    0.8    0.8    0.7    0.6
                Dividend yield (%)               4.0    5.2    2.8    2.8    3.5    4.2
                EV/Sales                         2.5    1.9    1.7    2.8    2.5    2.0
                EV/EBITDA                        5.1    4.2    4.1    8.2    6.6    4.9
                EV / Total Assets                1.0    0.8    0.7    0.7    0.7    0.7
                Per Share Data (Rs)
                EPS (Basic)                     59.9   95.4   93.1   33.7   49.0   70.2
                EPS (fully diluted)             59.6   95.4   92.4   33.5   49.0   70.2
                Cash EPS                        77.2 118.8 122.2     61.3   79.7 104.2
                DPS                             11.5   15.0    8.0    8.0   10.0   12.0
                Book Value                     205.3 284.5 343.6 374.9 412.2 468.4
                DuPont Analysis
                EBIT margin                     36.9   32.9   28.8   19.0   22.6   26.7
                Tax retention ratio             0.97   0.97   0.97   0.92   0.93   0.93
                Asset turnover (x)               0.6    0.6    0.6    0.3    0.3    0.4
                ROIC (Post-tax)                 21.7   19.8   16.2    6.1    6.9    9.8
                Cost of Debt (Post Tax)          5.2    6.2    5.1    4.0    5.1    4.7
                Leverage (x)                     0.3    0.3    0.4    0.5    0.6    0.5
                Operating ROE                   26.2   24.6   20.3    7.1    7.9   12.4
                Returns (%)
                ROCE (Pre-tax)                  16.5   16.5   13.2    5.3    6.3    9.5
                Angel ROIC (Pre-tax)            24.0   23.2   21.1    8.1    8.5   12.1
                ROE                             32.9   39.0   29.7    9.4   12.4   16.0
                Turnover ratios (x)
                Asset T/o (Gross block)          0.2    0.5    0.5    0.4    0.4    0.4
                Inventory / Sales (days)          6      6      6     10      6      6
                Receivables (days)               22     19     18     29     24     20
                Payables (days)                  96     74    114    149    117    104
                Wkg. cap. (ex-cash, days)       (12)    (8)   (36)   (60)   (39)   (28)
                Solvency ratios (x)
                Net debt to equity               0.3    0.3    0.4    0.6    0.5    0.5
                Net debt to EBITDA               1.0    1.1    1.3    3.7    2.8    2.2
                Interest coverage (EBIT/Int)     7.2    6.4    5.9    2.6    2.5    4.8


July 30, 2010                                                                       10
GE Shipping | 1QFY2011 Result Update


  Research Team Tel: 022 - 4040 3800               E-mail: research@angeltrade.com                   Website: www.angeltrade.com

  DISCLAIMER

 This document is solely for the personal information of the recipient, and must not be singularly used as the basis of any investment
 decision. Nothing in this document should be construed as investment or financial advice. Each recipient of this document should make
 such investigations as they deem necessary to arrive at an independent evaluation of an investment in the securities of the companies
 referred to in this document (including the merits and risks involved), and should consult their own advisors to determine the merits and
 risks of such an investment.

 Angel Broking Limited, its affiliates, directors, its proprietary trading and investment businesses may, from time to time, make
 investment decisions that are inconsistent with or contradictory to the recommendations expressed herein. The views contained in this
 document are those of the analyst, and the company may or may not subscribe to all the views expressed within.

 Reports based on technical and derivative analysis center on studying charts of a stock's price movement, outstanding positions and
 trading volume, as opposed to focusing on a company's fundamentals and, as such, may not match with a report on a company's
 fundamentals.

 The information in this document has been printed on the basis of publicly available information, internal data and other reliable
 sources believed to be true, but we do not represent that it is accurate or complete and it should not be relied on as such, as this
 document is for general guidance only. Angel Broking Limited or any of its affiliates/ group companies shall not be in any way
 responsible for any loss or damage that may arise to any person from any inadvertent error in the information contained in this report.
 Angel Broking Limited has not independently verified all the information contained within this document. Accordingly, we cannot testify,
 nor make any representation or warranty, express or implied, to the accuracy, contents or data contained within this document. While
 Angel Broking Limited endeavours to update on a reasonable basis the information discussed in this material, there may be regulatory,
 compliance, or other reasons that prevent us from doing so.
 This document is being supplied to you solely for your information, and its contents, information or data may not be reproduced,
 redistributed or passed on, directly or indirectly.

 Angel Broking Limited and its affiliates may seek to provide or have engaged in providing corporate finance, investment banking or
 other advisory services in a merger or specific transaction to the companies referred to in this report, as on the date of this report or in
 the past.

 Neither Angel Broking Limited, nor its directors, employees or affiliates shall be liable for any loss or damage that may arise from or in
 connection with the use of this information.

 Note: Please refer to the important `Stock Holding Disclosure' report on the Angel website (Research Section). Also, please
 refer to the latest update on respective stocks for the disclosure status in respect of those stocks. Angel Broking Limited and
 its affiliates may have investment positions in the stocks recommended in this report.


 Disclosure of Interest Statement                                              GE Shipping
 1. Analyst ownership of the stock                                                 No
 2. Angel and its Group companies ownership of the stock                           No
 3. Angel and its Group companies' Directors ownership of the stock                No
 4. Broking relationship with company covered                                      No

 Note: We have not considered any Exposure below Rs 1 lakh for Angel, its Group companies and Directors.


 Ratings (Returns) :             Buy (> 15%)                      Accumulate (5% to 15%)                 Neutral (-5 to 5%)
                                 Reduce (-5% to 15%)              Sell (< -15%)


July 30, 2010                                                                                                                             11

More Related Content

What's hot

Mphasis
MphasisMphasis
Mphasis
Angel Broking
 
NMDC
NMDCNMDC
GE shipping company update-28-04-10
GE shipping  company update-28-04-10GE shipping  company update-28-04-10
GE shipping company update-28-04-10
Angel Broking
 
Ultratech result update4 qfy2010-060510
Ultratech  result update4 qfy2010-060510Ultratech  result update4 qfy2010-060510
Ultratech result update4 qfy2010-060510
Angel Broking
 
Nmdc ru4 qfy2010-210510
Nmdc ru4 qfy2010-210510Nmdc ru4 qfy2010-210510
Nmdc ru4 qfy2010-210510
Angel Broking
 
GSPL
GSPLGSPL
Grasim ru4 qfy2010-210510
Grasim ru4 qfy2010-210510Grasim ru4 qfy2010-210510
Grasim ru4 qfy2010-210510
Angel Broking
 
Marico
Marico Marico
Marico
Angel Broking
 
Sintex ru2 qfy2011-121010
Sintex ru2 qfy2011-121010Sintex ru2 qfy2011-121010
Sintex ru2 qfy2011-121010
Angel Broking
 
Ranbaxy Result Update 1qcy2010-120510
Ranbaxy Result Update 1qcy2010-120510Ranbaxy Result Update 1qcy2010-120510
Ranbaxy Result Update 1qcy2010-120510
Angel Broking
 
Sarda Energy
Sarda EnergySarda Energy
Sarda Energy
Angel Broking
 
Gdl result update 4 qfy2010-300410
Gdl  result update 4 qfy2010-300410Gdl  result update 4 qfy2010-300410
Gdl result update 4 qfy2010-300410
Angel Broking
 
RIL Result Update
RIL Result UpdateRIL Result Update
RIL Result Update
Angel Broking
 
JK Lakshmi
JK LakshmiJK Lakshmi
JK Lakshmi
Angel Broking
 
Bayer India- Result Update
Bayer India- Result UpdateBayer India- Result Update
Bayer India- Result Update
Angel Broking
 
TCS 4QFY2010 Results Update
TCS 4QFY2010 Results UpdateTCS 4QFY2010 Results Update
TCS 4QFY2010 Results Update
Angel Broking
 
Sintex Industries
Sintex IndustriesSintex Industries
Sintex Industries
Angel Broking
 
CCCl
CCClCCCl

What's hot (18)

Mphasis
MphasisMphasis
Mphasis
 
NMDC
NMDCNMDC
NMDC
 
GE shipping company update-28-04-10
GE shipping  company update-28-04-10GE shipping  company update-28-04-10
GE shipping company update-28-04-10
 
Ultratech result update4 qfy2010-060510
Ultratech  result update4 qfy2010-060510Ultratech  result update4 qfy2010-060510
Ultratech result update4 qfy2010-060510
 
Nmdc ru4 qfy2010-210510
Nmdc ru4 qfy2010-210510Nmdc ru4 qfy2010-210510
Nmdc ru4 qfy2010-210510
 
GSPL
GSPLGSPL
GSPL
 
Grasim ru4 qfy2010-210510
Grasim ru4 qfy2010-210510Grasim ru4 qfy2010-210510
Grasim ru4 qfy2010-210510
 
Marico
Marico Marico
Marico
 
Sintex ru2 qfy2011-121010
Sintex ru2 qfy2011-121010Sintex ru2 qfy2011-121010
Sintex ru2 qfy2011-121010
 
Ranbaxy Result Update 1qcy2010-120510
Ranbaxy Result Update 1qcy2010-120510Ranbaxy Result Update 1qcy2010-120510
Ranbaxy Result Update 1qcy2010-120510
 
Sarda Energy
Sarda EnergySarda Energy
Sarda Energy
 
Gdl result update 4 qfy2010-300410
Gdl  result update 4 qfy2010-300410Gdl  result update 4 qfy2010-300410
Gdl result update 4 qfy2010-300410
 
RIL Result Update
RIL Result UpdateRIL Result Update
RIL Result Update
 
JK Lakshmi
JK LakshmiJK Lakshmi
JK Lakshmi
 
Bayer India- Result Update
Bayer India- Result UpdateBayer India- Result Update
Bayer India- Result Update
 
TCS 4QFY2010 Results Update
TCS 4QFY2010 Results UpdateTCS 4QFY2010 Results Update
TCS 4QFY2010 Results Update
 
Sintex Industries
Sintex IndustriesSintex Industries
Sintex Industries
 
CCCl
CCClCCCl
CCCl
 

Viewers also liked

#1iCertificated2016
#1iCertificated2016#1iCertificated2016
#1iCertificated2016
sherman kelly bin john
 
Online personal trainer magazine download pdf
Online personal trainer magazine download pdfOnline personal trainer magazine download pdf
Online personal trainer magazine download pdf
montalvokellie01
 
Derivatives report 23 june-2010
Derivatives report 23 june-2010Derivatives report 23 june-2010
Derivatives report 23 june-2010
Angel Broking
 
Juicios y proposicion
Juicios y proposicionJuicios y proposicion
Juicios y proposicion
LEIMART
 
Prakash Indutries
Prakash Indutries Prakash Indutries
Prakash Indutries
Angel Broking
 
Award2014
Award2014Award2014
MARYFONSECAEldeslindedepropiedadcontiguas
MARYFONSECAEldeslindedepropiedadcontiguasMARYFONSECAEldeslindedepropiedadcontiguas
MARYFONSECAEldeslindedepropiedadcontiguas
maryfonseca2325
 
Tribunales laborales
Tribunales laboralesTribunales laborales
Tribunales laborales
Dariana Alvarez
 
Las evidencias
Las evidenciasLas evidencias
Las evidencias
Dariana Alvarez
 
Mary fonseca El deslinde de propiedad contiguas
Mary fonseca El deslinde de propiedad contiguasMary fonseca El deslinde de propiedad contiguas
Mary fonseca El deslinde de propiedad contiguas
maryfonseca2325
 
Eligibility & Authorization Verification by sun knowledge
Eligibility & Authorization Verification by sun knowledgeEligibility & Authorization Verification by sun knowledge
Eligibility & Authorization Verification by sun knowledge
Ronnie Hastings
 
Organización y Funcionamiento Instituciones administrativas del Trabajo en V...
Organización  y Funcionamiento Instituciones administrativas del Trabajo en V...Organización  y Funcionamiento Instituciones administrativas del Trabajo en V...
Organización y Funcionamiento Instituciones administrativas del Trabajo en V...
jesus ulacio
 
El juicio y la proposición
El juicio y la proposiciónEl juicio y la proposición
El juicio y la proposición
MARIO ESTEVEZ
 

Viewers also liked (13)

#1iCertificated2016
#1iCertificated2016#1iCertificated2016
#1iCertificated2016
 
Online personal trainer magazine download pdf
Online personal trainer magazine download pdfOnline personal trainer magazine download pdf
Online personal trainer magazine download pdf
 
Derivatives report 23 june-2010
Derivatives report 23 june-2010Derivatives report 23 june-2010
Derivatives report 23 june-2010
 
Juicios y proposicion
Juicios y proposicionJuicios y proposicion
Juicios y proposicion
 
Prakash Indutries
Prakash Indutries Prakash Indutries
Prakash Indutries
 
Award2014
Award2014Award2014
Award2014
 
MARYFONSECAEldeslindedepropiedadcontiguas
MARYFONSECAEldeslindedepropiedadcontiguasMARYFONSECAEldeslindedepropiedadcontiguas
MARYFONSECAEldeslindedepropiedadcontiguas
 
Tribunales laborales
Tribunales laboralesTribunales laborales
Tribunales laborales
 
Las evidencias
Las evidenciasLas evidencias
Las evidencias
 
Mary fonseca El deslinde de propiedad contiguas
Mary fonseca El deslinde de propiedad contiguasMary fonseca El deslinde de propiedad contiguas
Mary fonseca El deslinde de propiedad contiguas
 
Eligibility & Authorization Verification by sun knowledge
Eligibility & Authorization Verification by sun knowledgeEligibility & Authorization Verification by sun knowledge
Eligibility & Authorization Verification by sun knowledge
 
Organización y Funcionamiento Instituciones administrativas del Trabajo en V...
Organización  y Funcionamiento Instituciones administrativas del Trabajo en V...Organización  y Funcionamiento Instituciones administrativas del Trabajo en V...
Organización y Funcionamiento Instituciones administrativas del Trabajo en V...
 
El juicio y la proposición
El juicio y la proposiciónEl juicio y la proposición
El juicio y la proposición
 

Similar to GE Shipping

FAG Bearing
FAG BearingFAG Bearing
FAG Bearing
Angel Broking
 
Concor ru2 qfy2011-201010
Concor ru2 qfy2011-201010Concor ru2 qfy2011-201010
Concor ru2 qfy2011-201010
Angel Broking
 
Exide
Exide Exide
ABG Shipyard
ABG Shipyard ABG Shipyard
ABG Shipyard
Angel Broking
 
Kec International
Kec International Kec International
Kec International
Angel Broking
 
Exide Industries
Exide IndustriesExide Industries
Exide Industries
Angel Broking
 
GSPL
GSPLGSPL
GSPL
GSPLGSPL
SAIL
SAILSAIL
Sun TV
Sun TVSun TV
Wipro
Wipro  Wipro
GAIL
GAILGAIL
Ultratech Cement
Ultratech Cement  Ultratech Cement
Ultratech Cement
Angel Broking
 
Ultratech Cement
Ultratech Cement Ultratech Cement
Ultratech Cement
Angel Broking
 
Bharat Forge
Bharat ForgeBharat Forge
Bharat Forge
Angel Broking
 
Allcargo
AllcargoAllcargo
Allcargo
Angel Broking
 
RIL - result Update
RIL - result UpdateRIL - result Update
RIL - result Update
Angel Broking
 
Tcs Result Update
Tcs  Result UpdateTcs  Result Update
Tcs Result Update
Angel Broking
 
DLF
DLFDLF
Colgate Palmolive
Colgate PalmoliveColgate Palmolive
Colgate Palmolive
Angel Broking
 

Similar to GE Shipping (20)

FAG Bearing
FAG BearingFAG Bearing
FAG Bearing
 
Concor ru2 qfy2011-201010
Concor ru2 qfy2011-201010Concor ru2 qfy2011-201010
Concor ru2 qfy2011-201010
 
Exide
Exide Exide
Exide
 
ABG Shipyard
ABG Shipyard ABG Shipyard
ABG Shipyard
 
Kec International
Kec International Kec International
Kec International
 
Exide Industries
Exide IndustriesExide Industries
Exide Industries
 
GSPL
GSPLGSPL
GSPL
 
GSPL
GSPLGSPL
GSPL
 
SAIL
SAILSAIL
SAIL
 
Sun TV
Sun TVSun TV
Sun TV
 
Wipro
Wipro  Wipro
Wipro
 
GAIL
GAILGAIL
GAIL
 
Ultratech Cement
Ultratech Cement  Ultratech Cement
Ultratech Cement
 
Ultratech Cement
Ultratech Cement Ultratech Cement
Ultratech Cement
 
Bharat Forge
Bharat ForgeBharat Forge
Bharat Forge
 
Allcargo
AllcargoAllcargo
Allcargo
 
RIL - result Update
RIL - result UpdateRIL - result Update
RIL - result Update
 
Tcs Result Update
Tcs  Result UpdateTcs  Result Update
Tcs Result Update
 
DLF
DLFDLF
DLF
 
Colgate Palmolive
Colgate PalmoliveColgate Palmolive
Colgate Palmolive
 

More from Angel Broking

Market outlook 110612
Market outlook 110612Market outlook 110612
Market outlook 110612
Angel Broking
 
Axis%20 bank ru1qfy2012-220711
Axis%20 bank ru1qfy2012-220711Axis%20 bank ru1qfy2012-220711
Axis%20 bank ru1qfy2012-220711
Angel Broking
 
Electrosteel castings
Electrosteel castingsElectrosteel castings
Electrosteel castings
Angel Broking
 
Persistent systems
Persistent systemsPersistent systems
Persistent systems
Angel Broking
 
Ht media
Ht mediaHt media
Ht media
Angel Broking
 
Derivative report 19th July 2011
Derivative report 19th July 2011Derivative report 19th July 2011
Derivative report 19th July 2011
Angel Broking
 
Market outlook 19th July 2011
Market outlook 19th July 2011Market outlook 19th July 2011
Market outlook 19th July 2011
Angel Broking
 
Telecom sector
Telecom sectorTelecom sector
Telecom sector
Angel Broking
 
Weekly Report 18th July 2011
Weekly Report 18th July 2011Weekly Report 18th July 2011
Weekly Report 18th July 2011
Angel Broking
 
Derivative Report 18th July 2011
Derivative Report 18th July 2011Derivative Report 18th July 2011
Derivative Report 18th July 2011
Angel Broking
 
Technical Report 18th July 2011
Technical Report 18th July 2011Technical Report 18th July 2011
Technical Report 18th July 2011
Angel Broking
 
Market Outlook 18th July 2011
Market Outlook 18th July 2011Market Outlook 18th July 2011
Market Outlook 18th July 2011
Angel Broking
 
South Indian Bank
 South Indian Bank South Indian Bank
South Indian Bank
Angel Broking
 
Bajaj auto Result Updated
Bajaj auto Result UpdatedBajaj auto Result Updated
Bajaj auto Result Updated
Angel Broking
 
Tata consultancy services
Tata consultancy services Tata consultancy services
Tata consultancy services
Angel Broking
 
Fc4 e63c4d01
Fc4 e63c4d01Fc4 e63c4d01
Fc4 e63c4d01
Angel Broking
 
Derivatives Report 15th July 2011
Derivatives Report 15th July 2011Derivatives Report 15th July 2011
Derivatives Report 15th July 2011
Angel Broking
 
Technical Report 15th July 2011
Technical Report 15th July 2011Technical Report 15th July 2011
Technical Report 15th July 2011
Angel Broking
 
Infosys Result Updated
Infosys Result UpdatedInfosys Result Updated
Infosys Result Updated
Angel Broking
 
Derivative Report 13th July 2011
Derivative Report 13th July 2011Derivative Report 13th July 2011
Derivative Report 13th July 2011
Angel Broking
 

More from Angel Broking (20)

Market outlook 110612
Market outlook 110612Market outlook 110612
Market outlook 110612
 
Axis%20 bank ru1qfy2012-220711
Axis%20 bank ru1qfy2012-220711Axis%20 bank ru1qfy2012-220711
Axis%20 bank ru1qfy2012-220711
 
Electrosteel castings
Electrosteel castingsElectrosteel castings
Electrosteel castings
 
Persistent systems
Persistent systemsPersistent systems
Persistent systems
 
Ht media
Ht mediaHt media
Ht media
 
Derivative report 19th July 2011
Derivative report 19th July 2011Derivative report 19th July 2011
Derivative report 19th July 2011
 
Market outlook 19th July 2011
Market outlook 19th July 2011Market outlook 19th July 2011
Market outlook 19th July 2011
 
Telecom sector
Telecom sectorTelecom sector
Telecom sector
 
Weekly Report 18th July 2011
Weekly Report 18th July 2011Weekly Report 18th July 2011
Weekly Report 18th July 2011
 
Derivative Report 18th July 2011
Derivative Report 18th July 2011Derivative Report 18th July 2011
Derivative Report 18th July 2011
 
Technical Report 18th July 2011
Technical Report 18th July 2011Technical Report 18th July 2011
Technical Report 18th July 2011
 
Market Outlook 18th July 2011
Market Outlook 18th July 2011Market Outlook 18th July 2011
Market Outlook 18th July 2011
 
South Indian Bank
 South Indian Bank South Indian Bank
South Indian Bank
 
Bajaj auto Result Updated
Bajaj auto Result UpdatedBajaj auto Result Updated
Bajaj auto Result Updated
 
Tata consultancy services
Tata consultancy services Tata consultancy services
Tata consultancy services
 
Fc4 e63c4d01
Fc4 e63c4d01Fc4 e63c4d01
Fc4 e63c4d01
 
Derivatives Report 15th July 2011
Derivatives Report 15th July 2011Derivatives Report 15th July 2011
Derivatives Report 15th July 2011
 
Technical Report 15th July 2011
Technical Report 15th July 2011Technical Report 15th July 2011
Technical Report 15th July 2011
 
Infosys Result Updated
Infosys Result UpdatedInfosys Result Updated
Infosys Result Updated
 
Derivative Report 13th July 2011
Derivative Report 13th July 2011Derivative Report 13th July 2011
Derivative Report 13th July 2011
 

Recently uploaded

Importance of community participation in development projects.pdf
Importance of community participation in development projects.pdfImportance of community participation in development projects.pdf
Importance of community participation in development projects.pdf
krisretro1
 
Initial Public Offering (IPO) Process.ppt
Initial Public Offering (IPO) Process.pptInitial Public Offering (IPO) Process.ppt
Initial Public Offering (IPO) Process.ppt
ribhi87
 
真实可查(nwu毕业证书)美国西北大学毕业证学位证书范本原版一模一样
真实可查(nwu毕业证书)美国西北大学毕业证学位证书范本原版一模一样真实可查(nwu毕业证书)美国西北大学毕业证学位证书范本原版一模一样
真实可查(nwu毕业证书)美国西北大学毕业证学位证书范本原版一模一样
28xo7hf
 
KYC Compliance: A Cornerstone of Global Crypto Regulatory Frameworks
KYC Compliance: A Cornerstone of Global Crypto Regulatory FrameworksKYC Compliance: A Cornerstone of Global Crypto Regulatory Frameworks
KYC Compliance: A Cornerstone of Global Crypto Regulatory Frameworks
Any kyc Account
 
10 geo ch 7 lifelines of economy and studies
10 geo ch 7 lifelines of economy and studies10 geo ch 7 lifelines of economy and studies
10 geo ch 7 lifelines of economy and studies
RhemanRaphael
 
Singapore Event 2024 IPSASB Update Slides
Singapore Event 2024 IPSASB Update SlidesSingapore Event 2024 IPSASB Update Slides
Singapore Event 2024 IPSASB Update Slides
International Federation of Accountants
 
TechnoXander Confirmation of Payee Product Pack 1.pdf
TechnoXander Confirmation of Payee Product Pack 1.pdfTechnoXander Confirmation of Payee Product Pack 1.pdf
TechnoXander Confirmation of Payee Product Pack 1.pdf
richardwellington119
 
13 Jun 24 ILC Retirement Income Summit - slides.pptx
13 Jun 24 ILC Retirement Income Summit - slides.pptx13 Jun 24 ILC Retirement Income Summit - slides.pptx
13 Jun 24 ILC Retirement Income Summit - slides.pptx
ILC- UK
 
Navigating Your Financial Future: Comprehensive Planning with Mike Baumann
Navigating Your Financial Future: Comprehensive Planning with Mike BaumannNavigating Your Financial Future: Comprehensive Planning with Mike Baumann
Navigating Your Financial Future: Comprehensive Planning with Mike Baumann
mikebaumannfinancial
 
一比一原版(cwu毕业证书)美国中央华盛顿大学毕业证如何办理
一比一原版(cwu毕业证书)美国中央华盛顿大学毕业证如何办理一比一原版(cwu毕业证书)美国中央华盛顿大学毕业证如何办理
一比一原版(cwu毕业证书)美国中央华盛顿大学毕业证如何办理
asukqco
 
Dr. Alyce Su Cover Story - China's Investment Leader
Dr. Alyce Su Cover Story - China's Investment LeaderDr. Alyce Su Cover Story - China's Investment Leader
Dr. Alyce Su Cover Story - China's Investment Leader
msthrill
 
Fabular Frames and the Four Ratio Problem
Fabular Frames and the Four Ratio ProblemFabular Frames and the Four Ratio Problem
Fabular Frames and the Four Ratio Problem
Majid Iqbal
 
一比一原版宾夕法尼亚大学毕业证(UPenn毕业证书)学历如何办理
一比一原版宾夕法尼亚大学毕业证(UPenn毕业证书)学历如何办理一比一原版宾夕法尼亚大学毕业证(UPenn毕业证书)学历如何办理
一比一原版宾夕法尼亚大学毕业证(UPenn毕业证书)学历如何办理
vpqasyb
 
1比1复刻(ksu毕业证书)美国堪萨斯州立大学毕业证本科文凭证书原版一模一样
1比1复刻(ksu毕业证书)美国堪萨斯州立大学毕业证本科文凭证书原版一模一样1比1复刻(ksu毕业证书)美国堪萨斯州立大学毕业证本科文凭证书原版一模一样
1比1复刻(ksu毕业证书)美国堪萨斯州立大学毕业证本科文凭证书原版一模一样
28xo7hf
 
How to Invest in Cryptocurrency for Beginners: A Complete Guide
How to Invest in Cryptocurrency for Beginners: A Complete GuideHow to Invest in Cryptocurrency for Beginners: A Complete Guide
How to Invest in Cryptocurrency for Beginners: A Complete Guide
Daniel
 
Tdasx: Interpreting the 2024 Cryptocurrency Market Funding Trends and Technol...
Tdasx: Interpreting the 2024 Cryptocurrency Market Funding Trends and Technol...Tdasx: Interpreting the 2024 Cryptocurrency Market Funding Trends and Technol...
Tdasx: Interpreting the 2024 Cryptocurrency Market Funding Trends and Technol...
nimaruinazawa258
 
Singapore 2024 Sustainability Reporting and Accountancy Education Slides
Singapore 2024 Sustainability Reporting and Accountancy Education SlidesSingapore 2024 Sustainability Reporting and Accountancy Education Slides
Singapore 2024 Sustainability Reporting and Accountancy Education Slides
International Federation of Accountants
 
Singapore 2024 Event The Way Forward Slides
Singapore 2024 Event The Way Forward SlidesSingapore 2024 Event The Way Forward Slides
Singapore 2024 Event The Way Forward Slides
International Federation of Accountants
 
Seeman_Fiintouch_LLP_Newsletter_Jun_2024.pdf
Seeman_Fiintouch_LLP_Newsletter_Jun_2024.pdfSeeman_Fiintouch_LLP_Newsletter_Jun_2024.pdf
Seeman_Fiintouch_LLP_Newsletter_Jun_2024.pdf
Ashis Kumar Dey
 
美洲杯投注-美洲杯投注买球官方官网-美洲杯投注比赛投注官网|【​网址​🎉ac10.net🎉​】
美洲杯投注-美洲杯投注买球官方官网-美洲杯投注比赛投注官网|【​网址​🎉ac10.net🎉​】美洲杯投注-美洲杯投注买球官方官网-美洲杯投注比赛投注官网|【​网址​🎉ac10.net🎉​】
美洲杯投注-美洲杯投注买球官方官网-美洲杯投注比赛投注官网|【​网址​🎉ac10.net🎉​】
ahmedendrise81
 

Recently uploaded (20)

Importance of community participation in development projects.pdf
Importance of community participation in development projects.pdfImportance of community participation in development projects.pdf
Importance of community participation in development projects.pdf
 
Initial Public Offering (IPO) Process.ppt
Initial Public Offering (IPO) Process.pptInitial Public Offering (IPO) Process.ppt
Initial Public Offering (IPO) Process.ppt
 
真实可查(nwu毕业证书)美国西北大学毕业证学位证书范本原版一模一样
真实可查(nwu毕业证书)美国西北大学毕业证学位证书范本原版一模一样真实可查(nwu毕业证书)美国西北大学毕业证学位证书范本原版一模一样
真实可查(nwu毕业证书)美国西北大学毕业证学位证书范本原版一模一样
 
KYC Compliance: A Cornerstone of Global Crypto Regulatory Frameworks
KYC Compliance: A Cornerstone of Global Crypto Regulatory FrameworksKYC Compliance: A Cornerstone of Global Crypto Regulatory Frameworks
KYC Compliance: A Cornerstone of Global Crypto Regulatory Frameworks
 
10 geo ch 7 lifelines of economy and studies
10 geo ch 7 lifelines of economy and studies10 geo ch 7 lifelines of economy and studies
10 geo ch 7 lifelines of economy and studies
 
Singapore Event 2024 IPSASB Update Slides
Singapore Event 2024 IPSASB Update SlidesSingapore Event 2024 IPSASB Update Slides
Singapore Event 2024 IPSASB Update Slides
 
TechnoXander Confirmation of Payee Product Pack 1.pdf
TechnoXander Confirmation of Payee Product Pack 1.pdfTechnoXander Confirmation of Payee Product Pack 1.pdf
TechnoXander Confirmation of Payee Product Pack 1.pdf
 
13 Jun 24 ILC Retirement Income Summit - slides.pptx
13 Jun 24 ILC Retirement Income Summit - slides.pptx13 Jun 24 ILC Retirement Income Summit - slides.pptx
13 Jun 24 ILC Retirement Income Summit - slides.pptx
 
Navigating Your Financial Future: Comprehensive Planning with Mike Baumann
Navigating Your Financial Future: Comprehensive Planning with Mike BaumannNavigating Your Financial Future: Comprehensive Planning with Mike Baumann
Navigating Your Financial Future: Comprehensive Planning with Mike Baumann
 
一比一原版(cwu毕业证书)美国中央华盛顿大学毕业证如何办理
一比一原版(cwu毕业证书)美国中央华盛顿大学毕业证如何办理一比一原版(cwu毕业证书)美国中央华盛顿大学毕业证如何办理
一比一原版(cwu毕业证书)美国中央华盛顿大学毕业证如何办理
 
Dr. Alyce Su Cover Story - China's Investment Leader
Dr. Alyce Su Cover Story - China's Investment LeaderDr. Alyce Su Cover Story - China's Investment Leader
Dr. Alyce Su Cover Story - China's Investment Leader
 
Fabular Frames and the Four Ratio Problem
Fabular Frames and the Four Ratio ProblemFabular Frames and the Four Ratio Problem
Fabular Frames and the Four Ratio Problem
 
一比一原版宾夕法尼亚大学毕业证(UPenn毕业证书)学历如何办理
一比一原版宾夕法尼亚大学毕业证(UPenn毕业证书)学历如何办理一比一原版宾夕法尼亚大学毕业证(UPenn毕业证书)学历如何办理
一比一原版宾夕法尼亚大学毕业证(UPenn毕业证书)学历如何办理
 
1比1复刻(ksu毕业证书)美国堪萨斯州立大学毕业证本科文凭证书原版一模一样
1比1复刻(ksu毕业证书)美国堪萨斯州立大学毕业证本科文凭证书原版一模一样1比1复刻(ksu毕业证书)美国堪萨斯州立大学毕业证本科文凭证书原版一模一样
1比1复刻(ksu毕业证书)美国堪萨斯州立大学毕业证本科文凭证书原版一模一样
 
How to Invest in Cryptocurrency for Beginners: A Complete Guide
How to Invest in Cryptocurrency for Beginners: A Complete GuideHow to Invest in Cryptocurrency for Beginners: A Complete Guide
How to Invest in Cryptocurrency for Beginners: A Complete Guide
 
Tdasx: Interpreting the 2024 Cryptocurrency Market Funding Trends and Technol...
Tdasx: Interpreting the 2024 Cryptocurrency Market Funding Trends and Technol...Tdasx: Interpreting the 2024 Cryptocurrency Market Funding Trends and Technol...
Tdasx: Interpreting the 2024 Cryptocurrency Market Funding Trends and Technol...
 
Singapore 2024 Sustainability Reporting and Accountancy Education Slides
Singapore 2024 Sustainability Reporting and Accountancy Education SlidesSingapore 2024 Sustainability Reporting and Accountancy Education Slides
Singapore 2024 Sustainability Reporting and Accountancy Education Slides
 
Singapore 2024 Event The Way Forward Slides
Singapore 2024 Event The Way Forward SlidesSingapore 2024 Event The Way Forward Slides
Singapore 2024 Event The Way Forward Slides
 
Seeman_Fiintouch_LLP_Newsletter_Jun_2024.pdf
Seeman_Fiintouch_LLP_Newsletter_Jun_2024.pdfSeeman_Fiintouch_LLP_Newsletter_Jun_2024.pdf
Seeman_Fiintouch_LLP_Newsletter_Jun_2024.pdf
 
美洲杯投注-美洲杯投注买球官方官网-美洲杯投注比赛投注官网|【​网址​🎉ac10.net🎉​】
美洲杯投注-美洲杯投注买球官方官网-美洲杯投注比赛投注官网|【​网址​🎉ac10.net🎉​】美洲杯投注-美洲杯投注买球官方官网-美洲杯投注比赛投注官网|【​网址​🎉ac10.net🎉​】
美洲杯投注-美洲杯投注买球官方官网-美洲杯投注比赛投注官网|【​网址​🎉ac10.net🎉​】
 

GE Shipping

  • 1. 1QFY2011 Result Update | Shipping July 30, 2010 The Great Eastern Shipping Co. BUY CMP Rs287 Performance Highlights Target Price Rs396 Y/E March (Rs cr) 1QFY11 1QFY10 %chg (yoy) 4QFY10 % chg (qoq) Investment Period 12 Months Net sales* 644 721 (10.6) 767 (16.0) # Stock Info EBITDA* 261 257 1.8 316 (17.2) OPM margin (%) 40.6 35.6 495bp 41.2 (60bp) Sector Shipping PAT 172 154 11.4 156 10.3 Market Cap (Rs cr) 4,377 Note:*Excl. gain from sale of vessels; #Excl. gain/(loss)from forex transactions Beta 1.2 52 Week High / Low 345/227 GE Shipping’s (Gesco) 1QFY2011 results were above our estimates on account of strong performance in the offshore segment. However, the shipping segment was Avg. Daily Volume 155,874 impacted by repricing of product tankers at a lower rate and lower tonnage. Face Value (Rs) 10 Management has reported the current NAV at Rs368/share as against Rs339/share BSE Sensex 17,868 in 4QFY2010. During the earnings call, management indicated that slippages were to the extent of 30% and 45% in the tankers and bulkers segments, Nifty 5,368 respectively, which led to a check on supply. The company intends to list its Reuters Code GESC.BO offshore subsidiary (97.6% stake) Greatship Ltd (GIL) by 2HFY2011E, which will Bloomberg unlock value of its offshore business. We maintain our Buy rating on the stock. GESCO@IN Code Offshore segment gains momentum: Gesco’s consolidated revenue (excl. gain on sale of vessels) dropped 10.6% yoy and 16.0% qoq to Rs644cr. The offshore segment reported strong performance with 45.1% yoy growth in sales to Rs231cr, Shareholding Pattern (%) driven by increased operating days. The shipping segment posted a decline of Promoters 30.0 31.6% yoy and 18.9% qoq to Rs497cr due to a 7.6% yoy drop in tonnage (2.66mn dwt). EBIT margin for the offshore segment was strong at 46.4% (up 2,397bp yoy MF / Banks / Indian Fls 29.6 and 1,594bp qoq). Consequently, EBIDTA margin stood at 40.6% (up 495bp yoy). FII / NRIs / 13.6 Gesco reported Rs44cr towards gain on sale of vessels. Further, it reported non- OCBs cash gain of Rs41cr because of revaluation of foreign currency, debtors and Indian Public / Others 26.8 creditors and non-cash loss of Rs31cr expensed towards interest in accordance with AS16 borrowing cost in 1QFY2011. Consequently, reported PAT increased 11.4% yoy and 10.3% qoq to Rs171.8cr. Abs. (%) 3m 1yr 3yr Outlook and valuation: We believe the accelerated phase-out of single hull tankers will relieve supply-side pressures and keep tanker freight rates at the current Sensex 1.8 16.1 17.1 sustainable level over the medium term. Further, Gesco intends to add eight Gesco (13.1) 13.8 (13.9) offshore vessels over the next two years, which will likely spur revenue growth in the offshore segment. We recommend a Buy rating on the stock with a Target Price of Rs396. Key Financials (Consolidated) Y/E March (Rs cr) FY2009 FY2010 FY2011E FY2012E Net sales* 3,801 2,891 3,100 3,980 % chg 21.4 (23.9) 7.3 28.4 Net profit 1,418 513 745 1,070 % chg (2.4) (63.8) 45.4 43.5 EBITDA (%) 40.8 33.7 37.7 39.7 EPS (Rs) 93.1 33.7 49.0 70.2 P/E (x) 3.1 8.5 5.9 4.1 Param Desai P/BV (x) 0.8 0.8 0.7 0.6 022 – 4040 3800 Ext: 310 RoE (%) paramv.desai@angeltrade.com 29.7 9.4 12.4 16.0 RoCE (%) 13.2 5.3 6.3 9.5 Mihir Salot EV/Sales (x) 1.7 2.8 2.5 2.0 022 – 4040 3800 Ext: 307 EV/EBITDA (x) 4.1 8.2 6.6 4.9 mihirr.salot@angeltrade.com Source: Company, Angel Research; Note: Excl. gain on sale of vessels Please refer to important disclosures at the end of this report 1
  • 2. GE Shipping | 1QFY2011 Result Update Exhibit 1: 1QFY2011 performance (Consolidated) Y/E March (Rs cr) 1QFY11 1QFY10 % chg (yoy) 4QFY10 % chg (qoq) Revenue* 644 721 (10.6) 767 (16.0) Total expenditure 383 464 (17.5) 451 (15.1) EBITDA*# 261 257 1.8 316 (17.2) EBITDA margin (%) 40.6 35.6 495bp 41.2 (60bp) Depreciation 105 96 9.0 111 (5.9) Interest 93 45 108.7 46 100.5 Gain on sale of vessels 44 119 (63.1) 12 (277.2) Foreign exchange gain/(loss) 41 (103) (67) Other income 39 45 (13.5) 60 (35.0) PBT 187 178 5.1 162 15.4 Tax 14 24 (40.1) 7 114.7 Tax rate (%) 7.7 13.5 4.1 Adj. PAT 173 154 12.2 156 11.1 EO/Prior period items 0 0 0 Minority interest (1) 0 0 Reported PAT 171.8 154.2 11.4 155.7 10.3 PAT margin (%) 26.7 21.4 528bp 20.3 635bp Number of shares (cr) 15 15 15 Adj. EPS (Rs) - quarterly 11.3 10.1 11.4 10.2 10.3 Source: Company, Angel Research; Note:*Excl. gain from sale of vessels; #Excl. gain/(loss)from forex transactions Exhibit 2: Segment-wise performance Y/E March (Rs cr) 1QFY11 1QFY10 % chg (yoy) 4QFY10 % chg (qoq) Revenue 728 886 (17.8) 839 (13.2) Shipping 497 726 (31.6) 612 (18.9) Offshore 231 159 45.1 227 2.1 PBIT 280 223 25.9 209 34.3 Shipping 173 187 (7.5) 140 23.8 Offshore 107 36 199.9 69 55.4 Margins (%) 38.5 25.2 1,338bp 24.9 1,365bp Shipping 34.8 25.8 909bp 22.8 1,201bp Offshore 46.4 22.5 2,397bp 30.5 1,594bp Source: Company, Angel Research Exhibit 3: Quarterly TCY trend %chg %chg Average TCY (US $/Day) 1QFY09 2QFY09 3QFY09 4QFY09 1QFY10 2QFY10 3QFY10 4QFY10 1QFY11 (yoy) (qoq) Crude carriers 40,737 53,292 37,653 34,450 23,819 18,779 17,778 29,322 20,444 (14.2) (30.3) Product carriers 21,541 28,648 23,120 21,495 17,088 18,865 19,131 17,920 15,485 (9.4) (13.6) (incl. gas carriers) Dry bulk 50,619 48,822 30,816 23,264 19,489 17,065 20,964 23,963 24,484 25.6 2.2 Source: Company, Angel Research July 30, 2010 2
  • 3. GE Shipping | 1QFY2011 Result Update Shipping segment witnessed a slowdown For 1QFY2011, Gesco reported lower revenue days (-2.3% yoy) and tonnage (-7.6% yoy). Further, the company witnessed a 14.2% yoy and 9.4% decline in TCY for crude and product tankers, respectively; while dry bulk reported a 25% increase at US $24,484/day in 1QFY2011. For 1QFY2011, the company maintained the spot-time mix for total fleet at 47:53, which is near its historical levels. Crude tankers and product carriers (including gas carriers) are covered to the extent of 43% and 72% of their operating days, respectively. Dry bulk carriers are covered to the extent of 46% of the fleet’s operating days. Revenue visibility for the remaining part of FY2010–11 is nearly Rs467cr. Update on asset purchase and sales During the quarter, Gesco modified its contract of building two Suezmax tankers to three very large crude carriers (VLCCs) with better prospects for the latter as well as relative pricing. The company sold three older tankers as part of the mandatory single hull tanker phase out by 2010. Further 2–3 vessels are likely to be phased out during FY2011. Moreover, GIL sold PSV Greatship Diya, while it took delivery of PSV Greatship Rekha and sold it immediately upon delivery. Consequently, the current owned and/or operated fleet of Gesco and its subsidiaries stands at 29 tankers, six dry bulk carriers, five PSVs, seven AHTSVs, two jackup rigs and two MPSSV. Well-capitalised balance sheet Gesco’s net consolidated debt stands at 0.25x as of June 2010. The company has a planned capex of US $573mn (US $118mn already paid) in the shipping segment, resulting in addition of 1.3mn dwt (three tankers and five bulkers) to the fleet by FY2013E. The company has indicated a delivery schedule of five dry bulk carriers (three in 4QFY2011 and two in 1QFY2012) and three VLCCs (two in 1QFY2012 and one in 1QFY2013). The planned capex for the offshore segment is of US $362mn over the next two years (US $125mn already paid), which is likely to be funded through IPO proceeds. Non-cash adjustments during the quarter The company has booked a non-cash gain of Rs41cr in 1QFY2011 v/s loss of Rs103cr in 1QFY2010 on account of revaluation of bank balances, creditors and debtors recorded in foreign currency. Moreover, as per provisions of AS-16, non cash adjustment of Rs32cr has been accounted for under interest cost due to exchange rate difference between foreign and local currency borrowing costs. July 30, 2010 3
  • 4. GE Shipping | 1QFY2011 Result Update Exhibit 4: Quarterly revenue trend Exhibit 5: Quarterly EBITDA trend 800 (1.0) 0 350 41.2 40.6 45 700 (10.6) -5 35.6 40 300 600 -10 35 250 28.2 -15 25.4 30 500 (19.7) -20 200 25 (Rs cr) (Rs cr) 400 (%) (%) -25 150 20 300 (27.0) -30 15 200 100 -35 10 100 -40 50 5 (42.5) 0 -45 0 0 1QFY10 2QFY10 3QFY10 4QFY10 1QFY11 1QFY10 2QFY10 3QFY10 4QFY10 1QFY11 Revenue (LHS) yoy change (RHS) EBITDA (LHS) EBITDA Margin (RHS) Source: Company, Angel Research Source: Company, Angel Research Exhibit 6: Quarterly profitabilty trend 180 40 160 24.1 20 140 11.4 0 120 100 -20 (Rs cr) (%) 80 -40 60 (64.0) -60 40 (67.9) 20 (81.0) -80 0 -100 1QFY10 2QFY10 3QFY10 4QFY10 1QFY11 PAT (LHS) yoy change (RHS) Source: Company, Angel Research Exhibit 7: Global peer valuation Market Cap P/E (x) P/B (x) EV/EBITDA (x) EV/Sales (x) RoE (%) US$ mn CY10 CY11 CY10 CY11 CY10 CY11 CY10 CY11 CY10 CY11 Tankers Frontline 2,382 9.7 9.7 2.9 2.8 8.0 7.8 4.4 4.4 29.7 24.7 Overseas Shipholding 1,193 164.1 17.7 0.6 0.6 11.2 8.0 2.3 2.3 -0.1 3.7 Ship Finance Intl. 1,508 8.5 9.2 1.7 1.7 7.0 7.1 9.4 9.4 23.2 18.2 Offshore Transocean 14,784 6.2 5.6 0.7 0.6 5.0 4.7 2.3 2.3 11.2 11.3 Diamond Offshore 8,271 8.3 8.5 2.1 1.9 4.8 4.9 2.6 2.6 27.9 25.8 Nabors Ind. 5,251 19.9 12.2 1.0 0.9 6.1 5.3 1.9 1.9 4.5 7.2 Aban Offshore* 818 6.0 5.4 1.3 1.0 8.6 8.8 5.2 5.2 24.5 21.3 Dry Bulk China Cosco Holding 14,044 24.9 20.4 2.2 2.0 13.3 10.4 1.3 1.3 9.4 10.8 China Ship. Dev. 5,019 17.0 12.7 1.5 1.4 10.7 8.0 2.9 2.9 9.0 11.1 STX Pan Ocean 2,166 22.1 12.0 1.0 0.9 15.3 10.3 0.8 0.8 4.9 8.7 Average 28.7 11.4 1.5 1.4 9.0 7.5 3.3 3.3 14.4 14.3 Gesco* 976 5.9 4.1 0.7 0.6 6.6 4.9 2.5 2.0 12.4 16.0 Source: Company, Bloomberg, Angel Research; Note: * Fiscal year ending (FY2011E and FY2012E) July 30, 2010 4
  • 5. GE Shipping | 1QFY2011 Result Update Investment Arguments Tanker freight rates bottoming out Though the tanker segment witnessed a slowdown in 1QFY2011, we expect rates to bottom out with the early signs of growth in US oil demand (gasoline demand likely to improve going ahead), single hull phase outs and order book slippages to provide support to the tanker market. The International Energy Agency (IEA) estimates global oil demand to register a 1.5% CAGR over CY2009–11E, increasing by 2.6mbd to 87.5mbd as against the decline of 1.5% in CY2009. As per Clarksons, 13% and 14% of the existing capacity (fleet) of crude and product tankers will be added in CY2010. However, the accelerated phase-out of single hull tankers, which accounts for 12% of the world's existing tanker fleet, will relieve supply-side pressures and keep freight rates at the current sustainable level over the near to medium term. Gesco will be a key beneficiary of higher tanker freight rates as it derives around 46% of its consolidated revenue from the tanker segment. GIL IPO to unlock value Gesco intends to list GIL by 2HFY2011E through fresh equity issuance. We believe this will unlock potential value of the offshore business, which globally trades at higher multiples than the shipping business due to better stability and high visibility in earnings. We have valued Gesco's offshore business at 6.5x FY2012E EV/EBITDA, in line with the global peers, fetching Rs133/share or Rs2,021cr. Relatively younger fleet The average age of Gesco’s fleet (35 vessels) is around 10.5 years, which is relatively young given that most vessels have a life of 25 years. Currently, 84% of the tanker dwt is double hull. The company has applied depreciation on an accelerated basis for the vessels that will need to be phased-out by FY2010 as per the MARPOL’s regulations. Offshore assets such as platform supply vessels and anchor handling tugs are relatively young and, hence, the company could earn better rates on such assets. Exhibit 8: Fleet dynamics 20 19 17 15 13.6 11 10.1 9.3 10 6 5 1 0 Crude carriers Product tankers Bulk carriers Gas carriers Age Profile (years) Number of vessels Source: Company, Angel Research July 30, 2010 5
  • 6. GE Shipping | 1QFY2011 Result Update Outlook and Valuation We believe the accelerated phase-out of single hull tankers will relieve supply-side pressures and keep tanker freight rates at the current sustainable level over the near to medium term. Further, Gesco intends to add eight offshore vessels over the next two years, which would spur the company’s revenue growth. We have valued the shipping business on an NAV basis, which fetches Rs263/share (10% discount to NAV) and the offshore business at 6.5x FY2012E EV/EBIDTA, in line with its global peers, contributing Rs133/share. Based on our target price of Rs396, the implied EV/EBITDA, P/BV and P/E multiples work out to 6.0x, 0.8x and 5.6x, respectively, for FY2012E. Thus, on account of trading at a significant discount to its global peers, we recommend a Buy rating on the stock with a Target Price of Rs396. Exhibit 9: Trading close to five-year forward P/B 2.0 1.5 1.0 (X) 0.5 0.0 Jun-05 Feb-06 Jun-06 Feb-07 Jun-07 Feb-08 Jun-08 Feb-09 Jun-09 Feb-10 Jun-10 Oct-05 Oct-06 Oct-07 Oct-08 Oct-09 P/BV 5 year Average P/BV Source: Bloomberg, Angel Research Exhibit 10: Key assumptions FY2011E FY2012E Freight rates change (%) Tanker 5.0 10.0 Dry Bulk (5.0) 5.0 Net Tanker fleet addition (%) 7.8 4.9 Single hull tanker scrapping (mn dwt) 15 25 Source: Angel Research July 30, 2010 6
  • 7. GE Shipping | 1QFY2011 Result Update Profit & Loss Statement (Consolidated) Y/E March (Rs cr) FY07 FY08 FY09 FY10 FY21E FY12E Gross sales 2,142 3,108 3,792 2,857 3,080 3,950 Less: Excise duty - - - - - - Net sales 2,142 3,108 3,792 2,857 3,080 3,950 Other operating inc. 24 22 9 34 20 30 Total operating income 2,166 3,131 3,801 2,891 3,100 3,980 % chg 6.4 44.5 21.4 (23.9) 7.3 28.4 Total expenditure 1,098 1,745 2,251 1,916 1,932 2,400 Personnel 184 246 303 337 372 478 Repairs & Maintenance 134 178 226 162 180 231 Dir. exp. (excl excep. item) 501 667 1,057 708 667 796 Hire of chartered ships 238 592 569 609 605 756 Others 41 61 96 100 109 139 EBITDA 1,067 1,386 1,550 974 1,169 1,580 % chg 14.1 29.8 11.8 (37.1) 20.0 35.2 (% of Net Sales) 49.3 44.3 40.8 33.7 37.7 39.7 Depreciation 268 355 454 425 468 517 EBIT 799 1,031 1,096 550 701 1,063 % chg 41.4 29.0 6.3 (49.8) 27.6 51.7 (% of Net sales) 36.9 32.9 28.8 19.0 22.6 26.7 Interest & other chgs. 111 162 185 212 280 223 Other income 252 632 542 217 380 309 (% of PBT) 26.8 42.1 37.3 39.2 47.4 26.9 Share in profit of asso. - - - - - - Recurring PBT 940 1,501 1,453 555 802 1,150 % chg 5.5 59.7 (3.2) (61.8) 44.5 43.5 Extraordinary Expense/(Inc.) - - - - - - PBT (reported) 940 1,501 1,453 555 802 1,150 Tax 33 47 45 45 56 81 (% of PBT) 3.5 3.2 3.1 8.1 7.0 7.0 PAT (reported) 912 1,453 1,418 513 745 1,070 Add: Share of asso. earning (0) - - - - - Less: Minority interest (MI) (0) - - - - - Prior period items 5 (0) 10 3 - - PAT after MI (reported) 912 1,453 1,418 513 745 1,070 ADJ. PAT 907 1,454 1,408 510 745 1,070 % chg 7.1 60.2 (3.2) (63.8) 46.3 43.5 (% of Net Sales) 41.9 46.4 37.0 17.6 24.0 26.9 Basic EPS (Rs) 59.9 95.4 93.1 33.7 49.0 70.2 Fully Diluted EPS (Rs) 59.6 95.4 92.4 33.5 49.0 70.2 July 30, 2010 7
  • 8. GE Shipping | 1QFY2011 Result Update Balance Sheet (Consolidated) Y/E March (Rs cr) FY07 FY08 FY09 FY10 FY11E FY12E Sources of funds Equity share capital 152 152 152 152 152 152 Preference capital - - - - - - Reserves & surplus 2,974 4,179 5,080 5,557 6,125 6,981 Shareholder’s funds 3,126 4,332 5,232 5,710 6,277 7,133 Minority interest - - - - - - Total loans 2,262 2,747 4,266 5,370 4,800 4,100 Deferred tax liability - - - (1) (1) (1) Total Liabilities 5,388 7,079 9,498 11,079 11,076 11,232 Application of funds Gross block 5,451 6,590 7,515 8,544 9,102 10,389 Less: Acc. dep. 1,730 1,747 1,853 2,141 2,609 3,126 Net Block 3,721 4,843 5,662 6,402 6,493 7,263 Capital WIP 318 838 1,918 1,101 1,211 1,393 Goodwill - - - - - - Investments 159 317 302 2,179 2,179 2,179 Current assets 1,538 1,579 2,713 2,185 1,859 1,184 Cash 1,174 1,236 2,218 1,744 1,515 676 Loans & Adv. 120 108 172 115 126 139 Other 244 236 324 326 217 369 Current liab. & Prov. 348 499 1,098 788 665 787 Net Current Assets 1,190 1,081 1,616 1,397 1,194 397 Misc. exp. not w/off - - - - - - Total Assets 5,388 7,079 9,498 11,079 11,076 11,232 July 30, 2010 8
  • 9. GE Shipping | 1QFY2011 Result Update Cash Flow Statement (Consolidated) Y/E March (Rs cr) FY07 FY08 FY09 FY10 FY11E FY12E Profit before tax 940 1,501 1,453 555 802 1,150 Depreciation 268 355 384 425 468 517 Change in Wkg Cap. (153) 100 21 (38) 104 (43) Less: Other inc & Adj. 3 (108) 231 139 - - Direct taxes paid (38) (50) (47) (54) (56) (81) Cash Flow from Operations 1,021 1,798 2,042 1,026 1,317 1,543 (Inc)/Dec in Fixed assets (1,415) (1,972) (1,823) (866) (668) (1,469) (Inc)/Dec in Investments (74) (229) (39) (1,932) - - Investments in subsidiaries 3 70 60 25 - - Other income 89 122 147 112 - - Cash Flow from Investing (1,397) (2,009) (1,654) (2,662) (668) (1,469) Issue of equity - 22 3 - - - Inc/(Dec) in loans 443 636 918 1,558 (570) (700) Dividend paid (incl. tax) (197) (213) (222) (46) (308) (214) Others (114) (172) (107) (349) - - Cash Flow from Financing 132 273 593 1,163 (878) (914) Inc/(Dec) in cash (244) 63 981 (474) (229) (840) Opening Cash balances 1,418 1,174 1,236 2,218 1,744 1,515 Closing Cash balances 1,174 1,236 2,218 1,744 1,515 676 July 30, 2010 9
  • 10. GE Shipping | 1QFY2011 Result Update Key Ratios Y/E March FY07 FY08 FY09 FY10 FY11E FY12E Valuation Ratio (x) P/E (on FDEPS) 4.8 3.0 3.1 8.6 5.9 4.1 P/CEPS 3.7 2.4 2.4 4.7 3.6 2.8 P/BV 1.4 1.0 0.8 0.8 0.7 0.6 Dividend yield (%) 4.0 5.2 2.8 2.8 3.5 4.2 EV/Sales 2.5 1.9 1.7 2.8 2.5 2.0 EV/EBITDA 5.1 4.2 4.1 8.2 6.6 4.9 EV / Total Assets 1.0 0.8 0.7 0.7 0.7 0.7 Per Share Data (Rs) EPS (Basic) 59.9 95.4 93.1 33.7 49.0 70.2 EPS (fully diluted) 59.6 95.4 92.4 33.5 49.0 70.2 Cash EPS 77.2 118.8 122.2 61.3 79.7 104.2 DPS 11.5 15.0 8.0 8.0 10.0 12.0 Book Value 205.3 284.5 343.6 374.9 412.2 468.4 DuPont Analysis EBIT margin 36.9 32.9 28.8 19.0 22.6 26.7 Tax retention ratio 0.97 0.97 0.97 0.92 0.93 0.93 Asset turnover (x) 0.6 0.6 0.6 0.3 0.3 0.4 ROIC (Post-tax) 21.7 19.8 16.2 6.1 6.9 9.8 Cost of Debt (Post Tax) 5.2 6.2 5.1 4.0 5.1 4.7 Leverage (x) 0.3 0.3 0.4 0.5 0.6 0.5 Operating ROE 26.2 24.6 20.3 7.1 7.9 12.4 Returns (%) ROCE (Pre-tax) 16.5 16.5 13.2 5.3 6.3 9.5 Angel ROIC (Pre-tax) 24.0 23.2 21.1 8.1 8.5 12.1 ROE 32.9 39.0 29.7 9.4 12.4 16.0 Turnover ratios (x) Asset T/o (Gross block) 0.2 0.5 0.5 0.4 0.4 0.4 Inventory / Sales (days) 6 6 6 10 6 6 Receivables (days) 22 19 18 29 24 20 Payables (days) 96 74 114 149 117 104 Wkg. cap. (ex-cash, days) (12) (8) (36) (60) (39) (28) Solvency ratios (x) Net debt to equity 0.3 0.3 0.4 0.6 0.5 0.5 Net debt to EBITDA 1.0 1.1 1.3 3.7 2.8 2.2 Interest coverage (EBIT/Int) 7.2 6.4 5.9 2.6 2.5 4.8 July 30, 2010 10
  • 11. GE Shipping | 1QFY2011 Result Update Research Team Tel: 022 - 4040 3800 E-mail: research@angeltrade.com Website: www.angeltrade.com DISCLAIMER This document is solely for the personal information of the recipient, and must not be singularly used as the basis of any investment decision. Nothing in this document should be construed as investment or financial advice. Each recipient of this document should make such investigations as they deem necessary to arrive at an independent evaluation of an investment in the securities of the companies referred to in this document (including the merits and risks involved), and should consult their own advisors to determine the merits and risks of such an investment. Angel Broking Limited, its affiliates, directors, its proprietary trading and investment businesses may, from time to time, make investment decisions that are inconsistent with or contradictory to the recommendations expressed herein. The views contained in this document are those of the analyst, and the company may or may not subscribe to all the views expressed within. Reports based on technical and derivative analysis center on studying charts of a stock's price movement, outstanding positions and trading volume, as opposed to focusing on a company's fundamentals and, as such, may not match with a report on a company's fundamentals. The information in this document has been printed on the basis of publicly available information, internal data and other reliable sources believed to be true, but we do not represent that it is accurate or complete and it should not be relied on as such, as this document is for general guidance only. Angel Broking Limited or any of its affiliates/ group companies shall not be in any way responsible for any loss or damage that may arise to any person from any inadvertent error in the information contained in this report. Angel Broking Limited has not independently verified all the information contained within this document. Accordingly, we cannot testify, nor make any representation or warranty, express or implied, to the accuracy, contents or data contained within this document. While Angel Broking Limited endeavours to update on a reasonable basis the information discussed in this material, there may be regulatory, compliance, or other reasons that prevent us from doing so. This document is being supplied to you solely for your information, and its contents, information or data may not be reproduced, redistributed or passed on, directly or indirectly. Angel Broking Limited and its affiliates may seek to provide or have engaged in providing corporate finance, investment banking or other advisory services in a merger or specific transaction to the companies referred to in this report, as on the date of this report or in the past. Neither Angel Broking Limited, nor its directors, employees or affiliates shall be liable for any loss or damage that may arise from or in connection with the use of this information. Note: Please refer to the important `Stock Holding Disclosure' report on the Angel website (Research Section). Also, please refer to the latest update on respective stocks for the disclosure status in respect of those stocks. Angel Broking Limited and its affiliates may have investment positions in the stocks recommended in this report. Disclosure of Interest Statement GE Shipping 1. Analyst ownership of the stock No 2. Angel and its Group companies ownership of the stock No 3. Angel and its Group companies' Directors ownership of the stock No 4. Broking relationship with company covered No Note: We have not considered any Exposure below Rs 1 lakh for Angel, its Group companies and Directors. Ratings (Returns) : Buy (> 15%) Accumulate (5% to 15%) Neutral (-5 to 5%) Reduce (-5% to 15%) Sell (< -15%) July 30, 2010 11