Download to read offline

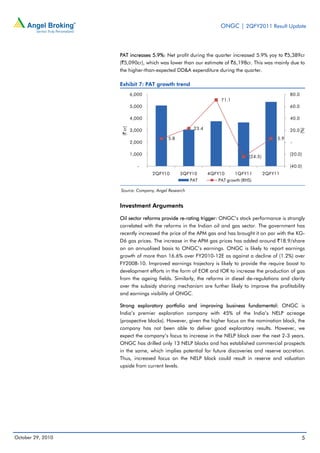
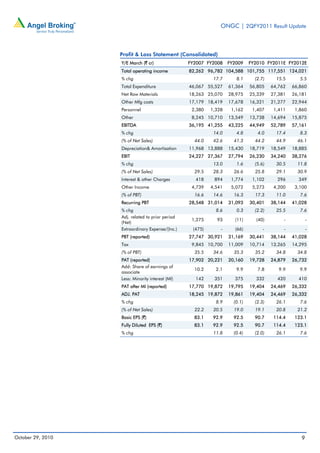

ONGC reported a 20.2% year-over-year increase in total operating income to Rs. 18,430 crore for the second quarter of FY2011, driven by higher crude oil prices and sales volumes. However, net profit grew only 5.9% to Rs. 5,389 crore, below estimates, due to a 86.8% rise in depreciation costs to Rs. 4,400 crore. While top-line was in line with expectations, the bottom-line was impacted by higher dry well write-offs. Ongoing reforms in the oil and gas sector are expected to boost ONGC's profitability and earnings growth over the medium term.