Download as PDF, PPTX

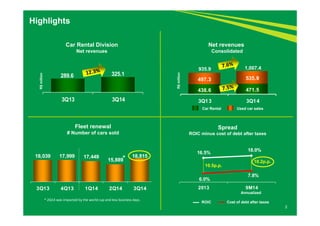
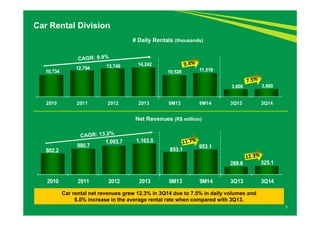
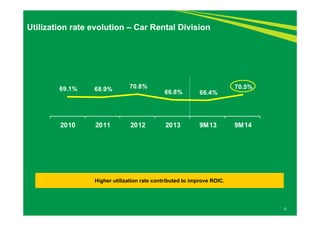
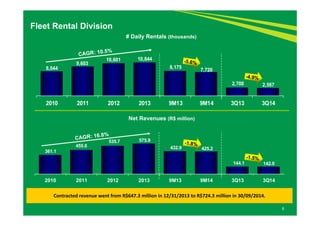
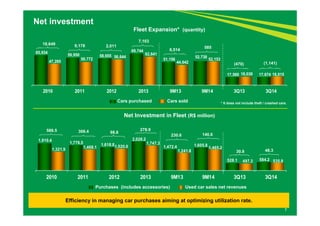
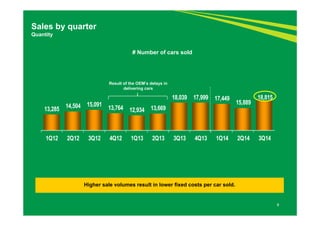
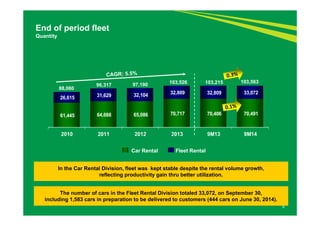
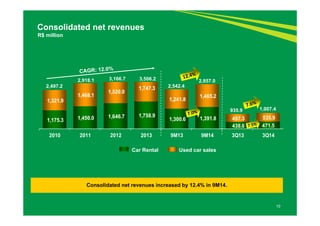
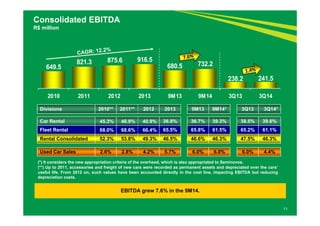
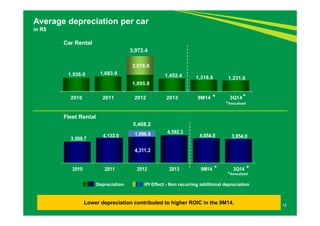
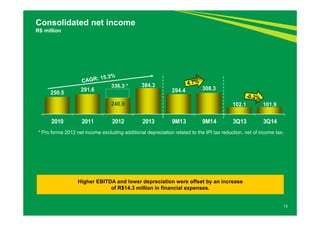
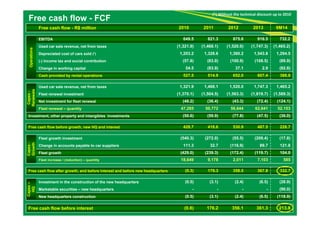
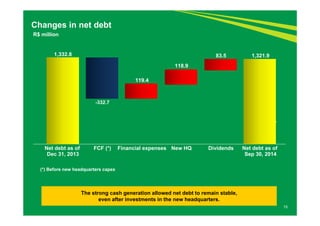
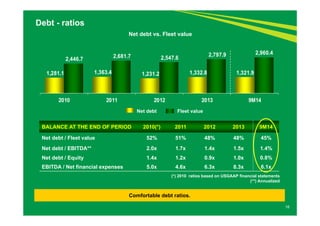
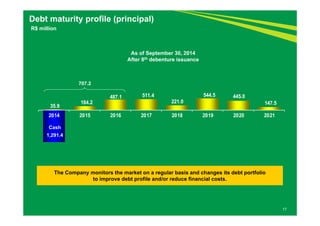
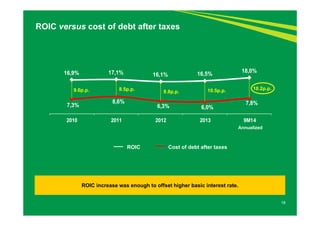

Localiza Rent a Car S.A. reported its 3Q14 results with consolidated net revenues increasing 12.4% year-over-year to R$535.9 million. The car rental division saw a 12.3% revenue increase due to 7.5% higher daily rental volumes and a 6.0% increase in average rental rates. ROIC increased from 16.5% to 18.0% due to higher utilization rates and lower depreciation costs. Free cash flow remained strong at R$332.7 million despite investments in a new headquarters, allowing net debt to remain stable at R$1,321.9 million with comfortable debt ratios.


