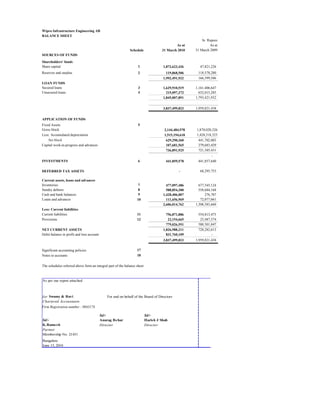
The document is the balance sheet of Wipro Infrastructure Engineering AB as of March 31, 2010. It shows that the company had total assets of Rs. 3,837,499,823, with fixed assets accounting for Rs. 736,891,925 of this amount. Total liabilities were Rs. 1,992,491,932 in shareholder funds and Rs. 1,845,007,891 in loan funds. Net current assets were Rs. 1,826,988,211.
A Study on Financial Statement Analysis of Ultratech Cement Limitedijtsrd
The process of Financial Statement Analysis includes various steps like ratio analysis, trend analysis, comparative statement analysis, schedule of changes in working capital, common size percentages, fund analysis, etc. Financial statement analysis refers to an assessment of the viability, stability and profitability of a business, sub business or project. The main objective of any financial analysis or financial statement analysis will be assessing corporate excellence, judging creditworthiness, forecasting bond ratings, predicting bankruptcy, and assessing market risk. Saddapalli Sai Deekshitha | Dr. B. C. Lakshmanna "A Study on Financial Statement Analysis of Ultratech Cement Limited" Published in International Journal of Trend in Scientific Research and Development (ijtsrd), ISSN: 2456-6470, Volume-5 | Issue-5 , August 2021, URL: https://www.ijtsrd.com/papers/ijtsrd45154.pdf Paper URL: https://www.ijtsrd.com/management/accounting-and-finance/45154/a-study-on-financial-statement-analysis-of-ultratech-cement-limited/saddapalli-sai-deekshitha
Financial statement Analysis of Reliance Industries Ltd..pdfNirupamaMaharana
This report includes balance sheet, Profit and Loss Statement, Cash Flow Statement of Reliance industries Limited and its ratio analysis like Current ratio, Quick ratio, Cash ratio, Net Working Capital , Debt Equity ratio, Proprietory ratio, Inventory Turnover ratio, Debtors turnover ratio, Gross Profit margin, Net profit margin, Return on Equity, Price earning ratio, Dividend Payout ratio etc.
Ratio analysis of Tata motors. It is cover all ratios of Tata motors of 2021 and 22. This PPT help to analyse the financial position of Tata motors. and also help investors to understand about they should invest or not in Tata motors. We all know that Tata motors is a huge giant company.
Financial Analysis of Axis Bank Services (MBA Finance)Avinash Labade
If any have Need Project Report please call +919011888598 and i will provide only Word File.
and
Project Cost is Rs 500/- Per Project
Send Me Payment Phone Pay or Google Pay
In this file, you can ref useful information about performance appraisal of wipro such as performance appraisal of wipro methods, performance appraisal of wipro tips
Mercer Capital's Value Focus: Laboratory Services | Year-End 2015Mercer Capital
Mercer Capital's Laboratory Services Industry newsletter provides perspective on valuation issues. Each newsletter also includes a macroeconomic trends, industry trends, and guideline public company metrics.
A qualitative analysis of South African women's knowledge, attitudes and beli...Michele Battle-Fisher
Francis, S., Battle-Fisher, M.#, Liverpool, J., Hipple, L., Mosavel, M., Shogun, S.,
& Mofammere, M. (2011) A qualitative analysis of South African women's knowledge, attitudes, and beliefs about HPV and cervical cancer prevention,
vaccine awareness and acceptance, and maternal-child communication about sexual health. Vaccine, 29, 8760-8765.
Mercer Capital's Value Focus: Laboratory Services | Mid-Year 2015Mercer Capital
Mercer Capital's Laboratory Services Industry newsletter provides perspective on valuation issues. Each newsletter also includes a macroeconomic trends, industry trends, and guideline public company metrics.
Broadening Your Perspective 10-1httpedugen.wiley.comed.docxhartrobert670
Broadening Your Perspective 10-1
http://edugen.wiley.com/edugen/shared/assignment/test/qprint.uni[10/21/2015 2:28:27 PM]
Print by: TAMI BLACKWELL
ACC/291 - 49446137 / Assignment: Week 3 Assignment
Broadening Your Perspective 10-1
The financial statements of Tootsie Roll are presented below.
TOOTSIE ROLL INDUSTRIES, INC. AND SUBSIDIARIES
CONSOLIDATED STATEMENTS OF
Earnings, Comprehensive Earnings and Retained Earnings (in thousands except per share data)
For the year ended December 31,
2011 2010 2009
Net product sales $528,369 $517,149 $495,592
Rental and royalty revenue 4,136 4,299 3,739
Total revenue 532,505 521,448 499,331
Product cost of goods sold 365,225 349,334 319,775
Rental and royalty cost 1,038 1,088 852
Total costs 366,263 350,422 320,627
Product gross margin 163,144 167,815 175,817
Rental and royalty gross margin 3,098 3,211 2,887
Total gross margin 166,242 171,026 178,704
Selling, marketing and administrative expenses 108,276 106,316 103,755
Impairment charges — — 14,000
Earnings from operations 57,966 64,710 60,949
Other income (expense), net 2,946 8,358 2,100
Earnings before income taxes 60,912 73,068 63,049
Provision for income taxes 16,974 20,005 9,892
Net earnings $43,938 $53,063 $53,157
Other comprehensive earnings (loss) (8,740) 1,183 2,845
Comprehensive earnings $35,198 $54,246 $56,002
Retained earnings at beginning of year. $135,866 $147,687 $144,949
Net earnings 43,938 53,063 53,157
Cash dividends (18,360) (18,078) (17,790)
Stock dividends (47,175) (46,806) (32,629)
Retained earnings at end of year $114,269 $135,866 $147,687
Earnings per share $0.76 $0.90 $0.89
Average Common and Class B Common shares outstanding 57,892 58,685 59,425
(The accompanying notes are an integral part of these statements.)
CONSOLIDATED STATEMENTS OF
Financial Position
TOOTSIE ROLL INDUSTRIES, INC. AND SUBSIDIARIES (in thousands except per share data)
Assets December 31,
2011 2010
CURRENT ASSETS:
Cash and cash equivalents $78,612 $115,976
Investments 10,895 7,996
Accounts receivable trade, less allowances of $1,731 and $1,531 41,895 37,394
Other receivables 3,391 9,961
Inventories:
Finished goods and work-in-process 42,676 35,416
Raw materials and supplies 29,084 21,236
Prepaid expenses 5,070 6,499
Deferred income taxes 578 689
Total current assets 212,201 235,167
PROPERTY, PLANT AND EQUIPMENT, at cost:
Land 21,939 21,696
Buildings 107,567 102,934
Machinery and equipment 322,993 307,178
Broadening Your Perspective 10-1
http://edugen.wiley.com/edugen/shared/assignment/test/qprint.uni[10/21/2015 2:28:27 PM]
Construction in progress 2,598 9,243
455,097 440,974
Less—Accumulated depreciation 242,935 225,482
Net property, plant and equipment 212,162 215,492
OTHER ASSETS:
Goodwill 73,237 73,237
Trademarks 175,024 175,024
Investments 96,161 64,461
Split dollar officer life insurance 74,209 74,441
Prepaid expenses 3,212 6,680
Equity method investment 3,935 4,254
Deferred income taxes 7,715 9,203
...
The Roman Empire A Historical Colossus.pdfkaushalkr1407
The Roman Empire, a vast and enduring power, stands as one of history's most remarkable civilizations, leaving an indelible imprint on the world. It emerged from the Roman Republic, transitioning into an imperial powerhouse under the leadership of Augustus Caesar in 27 BCE. This transformation marked the beginning of an era defined by unprecedented territorial expansion, architectural marvels, and profound cultural influence.
The empire's roots lie in the city of Rome, founded, according to legend, by Romulus in 753 BCE. Over centuries, Rome evolved from a small settlement to a formidable republic, characterized by a complex political system with elected officials and checks on power. However, internal strife, class conflicts, and military ambitions paved the way for the end of the Republic. Julius Caesar’s dictatorship and subsequent assassination in 44 BCE created a power vacuum, leading to a civil war. Octavian, later Augustus, emerged victorious, heralding the Roman Empire’s birth.
Under Augustus, the empire experienced the Pax Romana, a 200-year period of relative peace and stability. Augustus reformed the military, established efficient administrative systems, and initiated grand construction projects. The empire's borders expanded, encompassing territories from Britain to Egypt and from Spain to the Euphrates. Roman legions, renowned for their discipline and engineering prowess, secured and maintained these vast territories, building roads, fortifications, and cities that facilitated control and integration.
The Roman Empire’s society was hierarchical, with a rigid class system. At the top were the patricians, wealthy elites who held significant political power. Below them were the plebeians, free citizens with limited political influence, and the vast numbers of slaves who formed the backbone of the economy. The family unit was central, governed by the paterfamilias, the male head who held absolute authority.
Culturally, the Romans were eclectic, absorbing and adapting elements from the civilizations they encountered, particularly the Greeks. Roman art, literature, and philosophy reflected this synthesis, creating a rich cultural tapestry. Latin, the Roman language, became the lingua franca of the Western world, influencing numerous modern languages.
Roman architecture and engineering achievements were monumental. They perfected the arch, vault, and dome, constructing enduring structures like the Colosseum, Pantheon, and aqueducts. These engineering marvels not only showcased Roman ingenuity but also served practical purposes, from public entertainment to water supply.
Honest Reviews of Tim Han LMA Course Program.pptxtimhan337
Personal development courses are widely available today, with each one promising life-changing outcomes. Tim Han’s Life Mastery Achievers (LMA) Course has drawn a lot of interest. In addition to offering my frank assessment of Success Insider’s LMA Course, this piece examines the course’s effects via a variety of Tim Han LMA course reviews and Success Insider comments.
Welcome to TechSoup New Member Orientation and Q&A (May 2024).pdfTechSoup
In this webinar you will learn how your organization can access TechSoup's wide variety of product discount and donation programs. From hardware to software, we'll give you a tour of the tools available to help your nonprofit with productivity, collaboration, financial management, donor tracking, security, and more.
Introduction to AI for Nonprofits with Tapp NetworkTechSoup
Dive into the world of AI! Experts Jon Hill and Tareq Monaur will guide you through AI's role in enhancing nonprofit websites and basic marketing strategies, making it easy to understand and apply.
Acetabularia Information For Class 9 .docxvaibhavrinwa19
Acetabularia acetabulum is a single-celled green alga that in its vegetative state is morphologically differentiated into a basal rhizoid and an axially elongated stalk, which bears whorls of branching hairs. The single diploid nucleus resides in the rhizoid.
Model Attribute Check Company Auto PropertyCeline George
In Odoo, the multi-company feature allows you to manage multiple companies within a single Odoo database instance. Each company can have its own configurations while still sharing common resources such as products, customers, and suppliers.
Unit 8 - Information and Communication Technology (Paper I).pdfThiyagu K
This slides describes the basic concepts of ICT, basics of Email, Emerging Technology and Digital Initiatives in Education. This presentations aligns with the UGC Paper I syllabus.
Biological screening of herbal drugs: Introduction and Need for
Phyto-Pharmacological Screening, New Strategies for evaluating
Natural Products, In vitro evaluation techniques for Antioxidants, Antimicrobial and Anticancer drugs. In vivo evaluation techniques
for Anti-inflammatory, Antiulcer, Anticancer, Wound healing, Antidiabetic, Hepatoprotective, Cardio protective, Diuretics and
Antifertility, Toxicity studies as per OECD guidelines
Palestine last event orientationfvgnh .pptxRaedMohamed3
An EFL lesson about the current events in Palestine. It is intended to be for intermediate students who wish to increase their listening skills through a short lesson in power point.
How to Make a Field invisible in Odoo 17Celine George
It is possible to hide or invisible some fields in odoo. Commonly using “invisible” attribute in the field definition to invisible the fields. This slide will show how to make a field invisible in odoo 17.
June 3, 2024 Anti-Semitism Letter Sent to MIT President Kornbluth and MIT Cor...Levi Shapiro
Letter from the Congress of the United States regarding Anti-Semitism sent June 3rd to MIT President Sally Kornbluth, MIT Corp Chair, Mark Gorenberg
Dear Dr. Kornbluth and Mr. Gorenberg,
The US House of Representatives is deeply concerned by ongoing and pervasive acts of antisemitic
harassment and intimidation at the Massachusetts Institute of Technology (MIT). Failing to act decisively to ensure a safe learning environment for all students would be a grave dereliction of your responsibilities as President of MIT and Chair of the MIT Corporation.
This Congress will not stand idly by and allow an environment hostile to Jewish students to persist. The House believes that your institution is in violation of Title VI of the Civil Rights Act, and the inability or
unwillingness to rectify this violation through action requires accountability.
Postsecondary education is a unique opportunity for students to learn and have their ideas and beliefs challenged. However, universities receiving hundreds of millions of federal funds annually have denied
students that opportunity and have been hijacked to become venues for the promotion of terrorism, antisemitic harassment and intimidation, unlawful encampments, and in some cases, assaults and riots.
The House of Representatives will not countenance the use of federal funds to indoctrinate students into hateful, antisemitic, anti-American supporters of terrorism. Investigations into campus antisemitism by the Committee on Education and the Workforce and the Committee on Ways and Means have been expanded into a Congress-wide probe across all relevant jurisdictions to address this national crisis. The undersigned Committees will conduct oversight into the use of federal funds at MIT and its learning environment under authorities granted to each Committee.
• The Committee on Education and the Workforce has been investigating your institution since December 7, 2023. The Committee has broad jurisdiction over postsecondary education, including its compliance with Title VI of the Civil Rights Act, campus safety concerns over disruptions to the learning environment, and the awarding of federal student aid under the Higher Education Act.
• The Committee on Oversight and Accountability is investigating the sources of funding and other support flowing to groups espousing pro-Hamas propaganda and engaged in antisemitic harassment and intimidation of students. The Committee on Oversight and Accountability is the principal oversight committee of the US House of Representatives and has broad authority to investigate “any matter” at “any time” under House Rule X.
• The Committee on Ways and Means has been investigating several universities since November 15, 2023, when the Committee held a hearing entitled From Ivory Towers to Dark Corners: Investigating the Nexus Between Antisemitism, Tax-Exempt Universities, and Terror Financing. The Committee followed the hearing with letters to those institutions on January 10, 202
Embracing GenAI - A Strategic ImperativePeter Windle
Artificial Intelligence (AI) technologies such as Generative AI, Image Generators and Large Language Models have had a dramatic impact on teaching, learning and assessment over the past 18 months. The most immediate threat AI posed was to Academic Integrity with Higher Education Institutes (HEIs) focusing their efforts on combating the use of GenAI in assessment. Guidelines were developed for staff and students, policies put in place too. Innovative educators have forged paths in the use of Generative AI for teaching, learning and assessments leading to pockets of transformation springing up across HEIs, often with little or no top-down guidance, support or direction.
This Gasta posits a strategic approach to integrating AI into HEIs to prepare staff, students and the curriculum for an evolving world and workplace. We will highlight the advantages of working with these technologies beyond the realm of teaching, learning and assessment by considering prompt engineering skills, industry impact, curriculum changes, and the need for staff upskilling. In contrast, not engaging strategically with Generative AI poses risks, including falling behind peers, missed opportunities and failing to ensure our graduates remain employable. The rapid evolution of AI technologies necessitates a proactive and strategic approach if we are to remain relevant.
Digital Tools and AI for Teaching Learning and Research
balance sheet of wipro
1. Wipro Infrastructure Engineering AB
BALANCE SHEET
In Rupees
As at As at
Schedule 31 March 2010 31 March 2009
SOURCES OF FUNDS
Shareholders' funds
Share capital 1 1,872,623,426 47,821,226
Reserves and surplus 2 119,868,506 118,578,280
1,992,491,932 166,399,506
LOAN FUNDS
Secured loans 3 1,629,910,519 1,161,406,647
Unsecured loans 4 215,097,372 632,015,285
1,845,007,891 1,793,421,932
3,837,499,823 1,959,821,438
APPLICATION OF FUNDS
Fixed Assets 5
Gross block 2,144,484,978 1,870,020,326
Less: Accumulated depreciation 1,515,194,618 1,428,318,323
Net block 629,290,360 441,702,003
Capital work-in-progress and advances 107,601,565 279,683,429
736,891,925 721,385,431
-
INVESTMENTS 6 441,859,578 441,857,640
DEFERRED TAX ASSETS - 68,295,753
Current assets, loans and advances
Inventories 7 477,097,486 677,545,124
Sundry debtors 8 588,854,300 558,684,168
Cash and bank balances 9 1,428,406,007 276,707
Loans and advances 10 111,656,969 72,077,661
2,606,014,762 1,308,583,660
Less: Current liabilities
Current liabilities 11 756,871,886 554,813,473
Provisions 12 22,154,665 25,487,574
779,026,551 580,301,047
NET CURRENT ASSETS 1,826,988,211 728,282,613
Debit balance in profit and loss account 831,760,109 -
3,837,499,823 1,959,821,438
Significant accounting policies 17
Notes to accounts 18
The schedules referred above form an integral part of the balance sheet
As per our report attached
for Swamy & Ravi
Chartered Accountants
Firm Registration number : 004317S
Sd/- Sd/-
Sd/- Anurag Behar Harish J Shah
Director Director
Partner
Membership No. 21431
Bangalore
June 15, 2010
For and on behalf of the Board of Directors
K.Ramesh
2. Wipro Infrastructure Engineering AB
PROFIT AND LOSS ACCOUNT
As per our report attached
for Swamy & Ravi
Chartered Accountants
June 15, 2010
In Rupees
Schedule
For the year ended 31
March 2010
For the year ended 31
March 2009
INCOME
Sales and services 1,930,816,172 4,150,216,927
Other income 13 203,791,121 38,710,136
2,134,607,293 4,188,927,063
EXPENDITURE
Employee cost 14 1,014,270,316 1,371,725,551
Depreciation 5 134,768,975 123,837,881
Other operating expenses 15 1,736,413,059 3,057,302,677
Interest 16 33,566,290 36,269,594
2,919,018,640 4,589,135,703
PROFIT BEFORE TAXATION (784,411,347) (400,208,640)
Provision for taxation 86,485,496 7,298,886
PROFIT AFTER TAXATION (870,896,843) (407,507,526)
Balance in the profit and loss account brought forward 39,136,734 -
TRANSFER TO GENERAL RESERVE (831,760,109) (407,507,526)
EARNINGS PER SHARE - EPS
Equity shares of par value SEK 100 each
Basic and diluted (in Rs.) (1,502.64) (5,300.36)
Weighted average number of equity shares used in computing 553,533 76,883
Significant accounting policies 17
Notes to the accounts 18
The schedules referred above form an integral part of the profit and loss account
Firm Registration number : 004317S
Sd/- Sd/-
Sd/- Anurag Behar Harish J Shah
Director Director
Partner
Membership No. 21431
Bangalore
For and on behalf of the Board of Directors
K.Ramesh
3. Wipro Infrastructure Engineering AB
Cash flow statement
Cash and cash equivalents at the beginning of the year
As per our report attached
for Swamy & Ravi
Chartered Accountants
June 15, 2010
In Rupees
For the year ended 31
March 2010
For the year ended 31
March 2009
A. Cash flows from operating activities:
Profit before tax (784,411,347) (357,624,484)
Adjustments:
Depreciation 134,768,975 123,837,881
Unrealised exchange differences - net 97,827,081 32,590,375
Interest on borrowings 33,566,290 36,269,594
Interest income (4,959,445) (431,647)
Gain on sale of fixed assets (13,678,010) (300,902)
Working capital changes :
Inventories 200,447,639 103,457,134
Sundry debtors (30,170,133) 154,805,799
Loans and advances (27,697,005) 825,872
Current liabilities and provisions 198,725,504 (395,170,431)
Net cash generated from operations (195,580,451) (301,740,808)
Direct taxes paid (30,072,047) (6,682,283)
Net cash generated by operating activities (225,652,498) (308,423,091)
B. Cash flows from investing activities:
Acquisition of fixed assets (207,675,587) (268,298,616)
Proceeds from sale of fixed assets 13,678,010 300,902
Purchase of investments (1,938) (15,770)
Interest income received 4,959,445 431,647
Net cash used in investing activities (189,040,070) (267,581,837)
C. Cash flows from financing activities:
Proceeds from issue of share capital 1,824,802,200 -
Interest paid on borrowings (33,566,290) (36,269,594)
Proceeds/(repayment) from/(of) borrowings 51,585,958 610,991,018
Net cash generated by / (used in) financing activities 1,842,821,868 574,721,424
Net increase in cash and
cash equivalents during the year 1,428,129,299 (1,283,504)
276,707 1,560,211
Cash and cash equivalents at the end of the year 1,428,406,007 276,707
Firm Registration number : 004317S
Sd/- Sd/-
Sd/- Anurag Behar Harish J Shah
Director Director
Partner
Membership No. 21431
Bangalore
For and on behalf of the Board of Directors
K.Ramesh
4. Wipro Infrastructure Engineering AB
Schedules to the balance sheet
In Rupees
As at As at
31 March 2010 31 March 2009
Schedule 1 Share capital
Authorised capital 47,821,226 47,821,226
76,883 (2009: 76,883) equity shares of SEK 100 each 1
76,883 equity shares of SEK 100 each 47,821,226 47,821,226
Issued, subscribed and paid-up capital 47,821,226 47,821,226
76,883 (2009: 76,883) equity shares of SEK 100 each 1
Equity contribution * 1,824,802,200 -
1,872,623,426 47,821,226
Note:
1 Of the above Equity shares, 76,883 Equity shares (2008: 76,883) of SEK 100 each are held by
Wipro Cyprus Private Limited, the Holding Company.
Schedule 2 Reserves and surplus
Translation reserve
Additions 79,441,546 44,444,738
Deletions 40,426,960 34,996,808
119,868,506 79,441,546
General reserve
Opening balance - 446,644,260
Additions - (407,507,526)
- 39,136,734
Summary of reserves and surplus
Opening balance 79,441,546 491,088,998
Additions 40,426,960 (372,510,718)
119,868,506 118,578,280
Schedule 3 Secured loans
From Banks
Term Loan 1 621,929,924 130,064,875
Finance lease obligation 178,500,072 120,599,847
Bank overdraft 1 829,480,523 910,741,925
1,629,910,519 1,161,406,647
1 Term loans and bank overdraft is secured by company assets
Schedule 4 Unsecured loans
From Wipro Holdings Hungary Korlatolt Felel.sseg. Tarsasag 215,097,372 632,015,285
215,097,372 632,015,285
5. Wipro Infrastructure Engineering AB
Schedules to the balance sheet (continued)
Schedule 5 Fixed assets
In Rupees
GROSS BLOCK ACCUMULATED DEPRECIATION
PARTICULARS NET BLOCK NET BLOCK
As of April 1 2009 Additions Deductions /
adjustments * As of March 31, 2010 As of April 1 2009 Depreciation for
the period
Deductions /
adjustments * As of March 31, 2010 As of March 31, 2010 As of March 31, 2009
Land and buildings 405,152,519 - (33,617,311) 371,535,208 173,806,165 9,314,750 (11,976,847) 171,144,068 200,391,140 231,346,354
Plant and machinery # 1,321,232,837 379,757,452 (64,647,478) 1,636,342,811 1,168,956,791 120,052,420 (31,891,618) 1,257,117,593 379,225,218 152,276,046
Office equipments 132,624,517 - (6,489,273) 126,135,244 75,564,904 4,825,261 (3,647,732) 76,742,433 49,392,811 57,059,613
Trucks 11,010,453 (538,738) 10,471,715 9,990,463 576,543 (376,482) 10,190,524 281,191 1,019,990
1,870,020,326 379,757,452 (105,292,800) 2,144,484,978 1,428,318,323 134,768,974 (47,892,679) 1,515,194,618 629,290,360 441,702,003
Previous period 2,030,087,040 70,642,481 (230,709,195) 1,870,020,326 1,471,788,766 123,837,881 (167,308,324) 1,428,318,323 441,702,003
6. Wipro Infrastructure Engineering AB
Schedules to the balance sheet (continued)
In Rupees
As at As at
31 March 2010 31 March 2009
Schedule 6 Investments
Investment in Subsidiaires/BUs 441,672,870 441,672,870
9100 (2009: 9100) shares of SEK 45535 each
Investments in Indian Money Market Mutual Funds 186,708 184,770
25 (2009: 20) shares of SEK 1200 each
441,859,578 441,857,640
Schedule 7 Inventories
Raw materials 280,879,653 444,821,931
Stock in process 161,989,750 176,596,382
Finished goods 34,228,083 56,126,811
477,097,486 677,545,124
Basis of stock valuation :
i) Raw materials, stock in process and stores & spares at or below cost.
ii) Finished goods at cost or net realizable value, whichever is lower
Schedule 8 Debtors
Sundry debtors (Unsecured)
Debts outstanding for a period exceeding six months
Considered doubtful 54,622,178 5,543,100
Other debts
Considered good 588,854,300 558,684,168
643,476,478 564,227,268
Less: Provision for doubtful debts 54,622,178 5,543,100
588,854,300 558,684,168
Schedule 9 Cash and bank balances
Balance with other than scheduled banks 1,428,406,007 276,707
1,428,406,007 276,707
7. Wipro Infrastructure Engineering AB
Schedules to the balance sheet (continued)
In Rupees
As at As at
31 March 2010 31 March 2009
Schedule 10 Loans and advances
(Unsecured, considered good unless otherwise stated)
Advances recoverable in cash or in kind or for value to be received
Receivable from group companies 55,283,794 5,384,342
Advances to suppliers 4,619,993 13,179,649
Advances to employees 1,038,220 683,720
Prepaid Expenses 36,008,334 41,553,560
Advance tax (net of provision) 14,678,028 2,795,724
Others 28,600 8,480,666
111,656,969 72,077,661
Schedule 11 Current liabilities
Sundry creditors 332,742,917 282,120,356
Statutory Liablities 127,192,865 77,692,834
Provision for expenses 152,973,872 124,605,401
Payable to Wipro Limited 138,029,879 66,630,744
Salary payable 5,932,353 3,764,138
756,871,886 554,813,473
Schedule 12 Provisions
Warranty provision 22,154,665 25,487,574
22,154,665 25,487,574
8. Wipro Infrastructure Engineering AB
Schedules to profit and loss account
In Rupees
For the year ended 31
March 20010
For the year ended 31
March 2009
Schedule 13 Other income
Profit on disposal of fixed assets 13,678,010 300,902
Scrap sales 5,903,736 21,117,942
Exchange differences - net 165,576,154 -
Interest income, dividend from mutual funds, etc 4,959,445 431,647
Others 13,673,776 16,859,645
203,791,121 38,710,136
Schedule 14 Personnel cost
Salaries and bonus 923,954,348 1,253,038,358
Workmen and Staff welfare 90,315,968 118,687,193
1,014,270,316 1,371,725,551
Schedule 15 Other operating expenses
Raw materials, Finised and Process Stocks 1,084,623,516 2,050,650,472
Stores & spares 72,515,913 125,576,167
Power and fuel 65,516,028 59,325,588
Insurance 4,558,329 6,233,751
Freight 93,399,412 138,188,935
Repairs to buildings 5,399,525 1,100,024
Repairs to Plant & Machniery 23,158,977 53,588,044
Corporate guarantee commission 22,930,817 42,584,157
Packing 29,710,287 53,398,223
Travelling 23,901,414 33,821,506
Communication 9,309,605 11,391,028
Bank charges 14,409,548 62,387,021
Rent 84,854,582 93,560,913
Audit fees 6,528,647 4,176,023
Sub contracting / technical fees 53,690,794 79,933,011
Advertisement and sales promotion 661,787 4,912,163
Exchange differences - net - 134,606,569
Legal and professional 4,339,881 9,290,901
Warranty provision 40,422,001 20,406,222
Provision / write off of bad debts 52,038,702 3,919,731
Miscellaneous 44,443,294 68,252,228
1,736,413,059 3,057,302,677
Schedule 16 Interest
Interest expense, net 33,566,290 36,269,594
33,566,290 36,269,594