1. KENGEN
INITIATION OF COVERAGE AND VALUATION REPORT
I initiate coverage of Kengen midway in its ambitious plan dubbed “Good to great” to generate
3,000MW of power by 2018 which falls in Horizon II. Horizon I was during the period 2008-2013,Horizon
II between 2013-2018 and Horizon III from 2018-2030.The specific achievements are;
Horizon I- To increase installed capacity by 500MW between July 2008 and June 2012.
Horizon II-To increase installed capacity by an additional 1500MW (To 3000MW) between July 2013
and june 2008.
Horizon III-To focus on expansion of opportunities beyond the country. Beyond 2018, KenGen with other power
generators will have achieved power stability and sustainability and therefore the company will trade
power with other Eastern Africa companies.
Their ambitious plan is in tandem with the National LCPDP (Least Cost Power Development Plan) that
seeks to increase and redistribute the energy mix to cheaper energy. During Horizon I they envisaged to
have an installed capacity of 1,500MW .They managed an installed capacity of by 1238.4MW falling
short by 261.4MW thereby managing an additional 292MW (installed Capacity in 2007 was 946MW).The
effective capacity was 1133MW caused by short falls from Hydro plants. Geothermal plants were
stable.The national LCPDP has identified geothermal generation has the main driver to meet this target;
The main risk to meeting this target is that geothermal power plants are very expensive to build.
Installed and Effective installed power by KENGEN stands as follows:
2010 2011 2012 2013 2014 2015
Installed 1,053.8 1,177.1 1,209.6 1,238.4 1,339.4 1,537.4
Effective 1,030.5 1,064.5 1,162.9 1,133.3 1,268.2
(Source Data:Kenya Power Financial statements)
In the Horizon II period meant to achieve 3,000MW, as of August 2015 installed capacity stood at
1,537MW with 200MW injected into the grid during the year. It is highly unlikely that they will meet
Horizon II targets.
Disclaimer: Information in the public domain claims an additional 280MW was injected in
December. This is erroneous as this refers to installed capacity of both olkaria I and IV. By financial end
year 2014 Olkaria I stood at 45MW and Olkaria IV at 70MW.Today it stands at 140MW each thus an
additional 165MW.Olkaria well head 43 struck an additional 33MW that will be added to the proposed
2. Olkaria V.Well head Power generation units are power production units that utilize the available steam
awaiting construction of conventional geothermal plants.
The following are the power projects meant to inject achieve the Horizon II targets.
Geothermal Olkaria I 140 Complete
Olkaria IV 140 Complete
Olkaria I unit 6 70 Financing
Olkaria V 140 Drilling & Financing
Olkaria VI 140 Drilling & Financing
Olkaria VII 140 Drilling & Financing
Well head Generation 350 Drilling & Financing
Wind Ngong wind Phase II 6.8 Implementation
Ngong wind II 13.6 Implementation
Meru Wind 100 Financing
Thermal
Kilifi Coal
Plant 600 Intial Stages
LNG plant 700 Initial Stages
Total 2540
Additional power as from August
2015 2227 (Subtracting complete and
obtained power)
From the above, growth in installed capacity (as from August 2015) is likely to come from wellhead
generation (350MW), wind(120MW) and Olkaria 1 unit 6 expected to inject in 540MW by 2018.Expected
installed capacity will be 1974MW, about 1000MW shortfall from horizon II targets.
Capital restructuring endeavour: Kengen seeks to recapitalize to meet its capital expenditures by
boosting its equity base. Currently it has 2,215,927,528 authorised shares at Ksh2.5 par with
2,198,361,456 shares issued and fully paid for. They intend to increase authorized shares to
10,000,000,000 shares at 2.5 par value by creating 7,784,072,472 shares. Kengen will seek to raise about
28.8 billion shillings from rights issue slated for Q1 2016.The government is not in a position to defend
its rights thus the debt guaranteed by the government to the company totaling 20.151Bn is slated for
conversion to equity, thereby raising 8.6 Bn in cash from the public. As such it is highly likely that the
Kengen will issue 2 shares from every 1 held at about Ksh 6.5 per share. This will reduce the interest
burden of the company, boost its equity capital thereby giving them more headroom to borrow to fund
capital expenditures.
3. The Financials.
Below is a snapshot of the financials.
2010 2011 2012 2013 2014 2015
FIVE YEAR
CAGR
Revenue (Bn) 11.5 15.2 17.4 17.7 18.5 26.6
EBITDA (bn) 7.1 10.2 11.9 11.6 11.5 17.8
Operating Profit (bn) 3.2 5.6 7.0 7.0 6.7 11.7
Pre-Tax Profit (bn) 2.5 3.7 4.0 4.0 4.2 8.7
EPS (Ksh) 1.49 0.95 1.28 2.38 1.29 5.24
DPS (Ksh) 0.50 0.50 0.60 0.60 0.40 0.65
Revenue Growth % -13% 32% 15% 2% 4% 44% 18.2%
EBITDA Growth % -23% 45% 16% -2% -1% 55% 20.3%
Earnings Growth % 59%
-
37% 36% 85% -46% 73% 28.5%
Operating Margin % 28% 37% 40% 40% 36% 44% 29.4%
Net profit margin 29% 14% 16% 29% 15% 43% 28.5%
Dividend Payout % 33% 53% 47% 25% 31% 12%
Return on Equity % 5% 3% 4% 7% 4% 8%
Return on Assets % 2% 1% 2% 3% 1% 3%
Growth of Total
borrowings 126% 12% 1% 17% 68% 8%
Gearing Ratio % 36% 49% 49% 51% 62% 50%
Capex Coverage 16% 24% 34% 60% 20% 45%
EBIT Coverage 1.1 1.3 1.6 1.7 1.6 3.9
P/CFO 17.7 6.6 6.2 1.5 2.0 1.6
Price/Sales 3.3 2.0 1.1 1.9 1.3 0.8
EV/ EBITDA 10.8 8.9 6.7 8.9 11.9 9.0
The five year CAGR has been boosted by the higher performance for the year 2015.
A significant factor in determining the fair value of Kengen (and by extension utility companies) is the
expected Capital expenditure.
2014 2015 2016 2017 2018 2019
Actual Capex (Ksh
Bn) 61.08 27.23 - - - -
Expected Capex (Ksh
Bn). 44.00 57.94 60.46 52.84 38.18 18.71
4. The expected capex is USD 3.16Bn to meet the horizon II target of 3000MW.However due to capital
raising challenges and delays and the time consuming nature of building power plants it is highly likely
they will achieve about 2000MW by end of 2018 at a capex of USD 1.17Bn and having laid down growth
for post 2018.
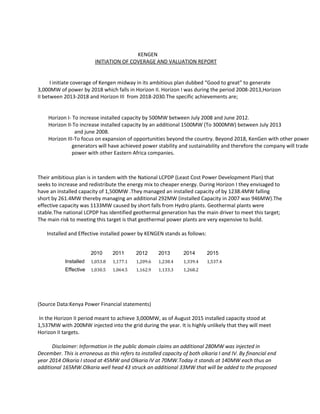
Per Share Data.
Investors seem to currently price utility companies very close to the cash flow generated per share.
(30.00)
(20.00)
(10.00)
0.00
10.00
20.00
30.00
40.00
50.00
60.00
70.00
2001 2003 2005 2007 2009 2011 2013 2015
Book value per share
Free cash flow per share
Year End Price
Cash flow generated from
operations per share
5. 2015 2016E 2017E 2018E 2019E
CFO (Mn) 12,526 14,260 15,510 17,625 18,541
FC Inv (Mn) 27,232 41,596 36,355 26,271 12,870
Int payable (Mn) 2,186 2,749 3,157 3,564 4,380
FCFF (Mn) (13,176) (25,412) (18,636) (6,151) 8,737
Terminal Value 0 210,933
Discount factor 0.956 0.900 0.847 0.797
Discounted Cashflows 0 (24,287) (16,767) (5,210) 6,967
Discounted Terminal
value 0 168,188
FCFF VALUE (Mn) 128,892
COST OF EQUITY NSE 20 Market Return WACC 6.22%
Equity Level 30.00%
30TH APRIL
2002 1,124.82
Risk free rate
(FXD1/2012/20YR) 12.92%
30TH APRIL
2015 4,173.52
Historical equity risk premium 0.70% Annual Return 10.20%
Beta 1.18 Bond YTM 2004 9.50%
CAPM E(R) 13.74%
0.00% CURRENT CAPITAL MIX
cost of equity 4.12% EQUITY 141,594,091 55%
COST OF DEBT DEBT 117,039,768 45%
Debt level 70.00%
Cost of Debt 4.29% TOTAL 258,633,859
After tax cost of Debt 2.10%
FCFF Value 128,891,783
Less Debt 117,039,768
Equity Value 11,852,015
Equity Value per share 5.39
Current Price 8.35
Upside -35.43%
6. ASSUMPTIONS
1.Kengen will not achieve the desired 3000MW by 2018 but rather will have about 2000MW by 2018.
2.They will require about USD 1.17bn to fund installed capacity to 2000MW during Horizon II.
3. Target debt equity mix will be 70:30 inclusive of partnerships under the PPP model.
4.2% longterm growth rate.
5.Ksh 20.151Bn of government guaranteed debt will be converted to equity.
Though Kengen is a company of great national importance whose activities touch every person and
entity in the East African region, it is a poor growth stock. Power pricing structures have evolved to take
into considerations unrealized foreign exchange losses, capacity charging meant to accelerate return on
investments and energy charges to compensate for electricity produced and sold. Such safe guards have
kept Kengen afloat.Further its ambitious expansion plan will have disastrous effects on cash flow.
A further concern investors need to note are accounting policies the Kengen board applies;
a) They capitalize interest during the construction of power plants funded by debt. Power plants
take very long to come to fruition thus though acceptable it’s a concern to investors such that
were they to expense that portion of interest, profitability levels would be significantly affected.
b) They also capitalize a portion of depreciation related to the rigs used in well drilling to the wells
as part of the cost to the well.
It is very evident that they have supported the share price with a high dividend payout ratio. (It
has paid more than 50% of net profits as dividends in two of the last six years yet the share price
as fallen by more than 36% during the June 2009-June 2015 period.
ROE is below most investor expectation, debt is expected to grow considerably to fund plant
development and their market share is expected to reduce with entrants of new power producers.
RECOMMENDATION: SELL
It is highly unlikely for this stock to deliver long term value to its shareholders. Though revenue is
certainly guaranteed, it’s capital requirements make it a poor growth stock.
PAUL MAINA: HEAD OF RESEARCH, RELIC CAPITAL