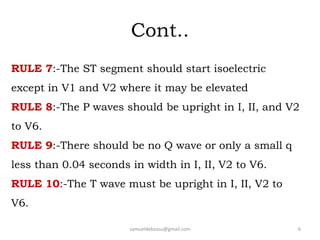
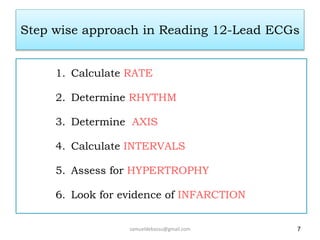
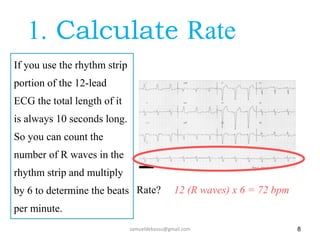
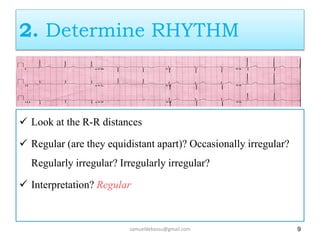
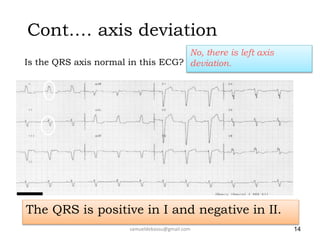
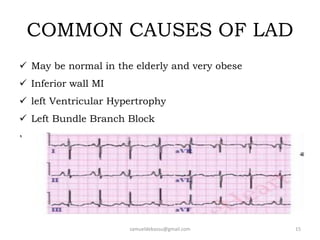
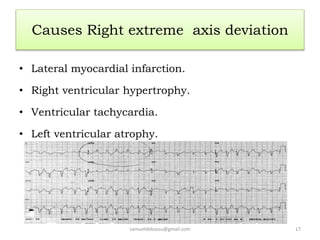
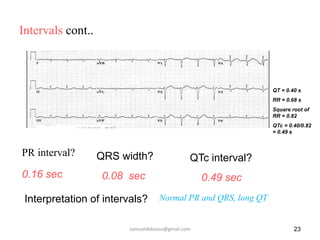
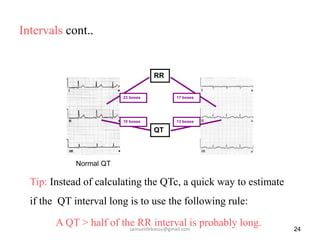
This document provides guidance on interpreting 12-lead electrocardiograms (ECGs). It discusses calculating the heart rate and determining the rhythm from the ECG. It outlines the steps to assess the electrical axis, measure intervals like PR and QT, evaluate for hypertrophy, and identify signs of ischemia or infarction. Common abnormalities are described, including left and right axis deviation, bundle branch blocks, and left ventricular hypertrophy. The summary emphasizes interpreting the ECG involves calculating the rate, assessing the rhythm, axis, intervals, hypertrophy, and looking for evidence of heart disease.
The document provides an overview of electrocardiography (ECG) interpretation. It discusses the heart's electrical conduction system and action potential, as well as the basics of reading an ECG including assessing rhythm, rate, axis, P waves, QRS complex, ST segment, and T waves. It outlines common abnormalities and provides examples of ECG interpretations for case scenarios involving myocardial infarction, left ventricular hypertrophy, sinus arrhythmia, and atrial fibrillation. The goal is to teach readers how to systematically evaluate an ECG tracing and identify potential cardiac issues.
This document provides information on ECG localization of myocardial infarction. It discusses the branches of the coronary arteries and their blood supply territories. It describes concepts like injury vector, ST elevation and depression cut-offs, and ECG changes seen in different types of MI such as anterior wall MI, inferior wall MI, right ventricular MI, and posterior wall MI. It also discusses ECG patterns that can indicate high-risk coronary artery disease such as left main occlusion. Overall, the document is a guide for using the ECG to localize the site and artery of myocardial infarction.
This document provides an overview of basics of ECG, including:
- A brief history of ECG development from 1842 to present day.
- An explanation of what an ECG measures and how it can be used to identify arrhythmias, ischemia, infarction and other cardiac conditions.
- A breakdown of the components of a normal ECG waveform including the P wave, PR interval, QRS complex, ST segment, and T wave.
- Descriptions of the 12-lead ECG system and how each lead views electrical activity from different angles in the heart.
- Explanations of how to analyze an ECG, including determining heart rate and cardiac axis. Bradyarrhythm
The document provides an overview of basic pacing concepts including:
- Types of pacemakers such as single chamber, dual chamber, and triple chamber systems.
- Components of a pacemaker system including the pulse generator, leads, and electrical concepts such as voltage, current, and impedance.
- Factors that can affect pacing thresholds and how to test the pacemaker circuit including identifying high and low impedance conditions.
This document discusses Eisenmenger syndrome, a condition where pulmonary hypertension develops due to increased blood flow through defects between the systemic and pulmonary circulations. It provides details on causes, clinical features, pathology findings, and treatments. Key points include:
- Eisenmenger syndrome is caused by defects like VSDs, ASDs, and PDA that allow high blood flow to the lungs and cause pulmonary hypertension over time.
- Common causes of death include hemoptysis from pulmonary artery ruptures, heart failure, and complications from attempted defect repair surgery.
- Pathological findings show thickened pulmonary arteries that resemble the fetal pattern and contribute to high pulmonary vascular resistance.
- Medical treatments are generally ineffective once int
This document provides an overview of echocardiographic evaluation of restrictive cardiomyopathy. Key points include:
- Restrictive cardiomyopathy is characterized by a nondilated left ventricle with abnormal diastolic function and typically normal systolic function.
- Causes include infiltrative diseases like amyloidosis and storage diseases. Echocardiography can help diagnose but it is more difficult than other cardiomyopathies.
- Findings include low diastolic volume, normal ejection fraction, diastolic dysfunction with rapid early mitral inflow. Echocardiography helps differentiate restrictive cardiomyopathy from constrictive pericarditis.
This document provides information from a student-led tutorial on interpreting electrocardiograms (ECGs). It defines the ECG waveform and relates it to electrical activity in the heart. It discusses normal ranges for intervals like PR, QRS, and QT. Examples of rhythms like sinus arrhythmia, heart block, and atrial fibrillation are presented. Appendices provide guidance on calculating heart rate from ECG tracings and identifying rhythm based on regularity of QRS complexes. Causes and clinical features of different types of heart block are also summarized.
This document provides an overview of ECG interpretation including:
- The anatomy of the heart's conduction system and how ECG leads are attached
- How to read an ECG strip and calculate heart rate
- Normal P, QRS, and T waves along with intervals like PR and QT
- Abnormalities that can indicate conditions like blocks, arrhythmias, and hypertrophy
- Electrolyte imbalances that can affect the ECG tracing
It concludes with examples of ECG strips and questions to test the reader's understanding.
1. The document discusses ECG patterns in acute myocardial infarction, describing ST segment elevations, depressions, and T wave changes associated with occlusions of the left anterior descending, left circumflex, and right coronary arteries.
2. Mechanisms of ECG changes during acute MI including systolic and diastolic currents of injury are explained.
3. Criteria for diagnosing acute MI based on ECG findings are provided.
This document provides an overview of ECG interpretation. It discusses cardiac electrophysiology, including the cardiac action potential and refractory periods. It describes the normal P wave, PR interval, QRS complex, and T wave. Abnormal P waves, prolonged or shortened PR intervals, wide QRS complexes, and high R wave amplitudes are addressed. A systematic approach to ECG interpretation involving assessment of intervals, amplitudes, and morphologies is recommended.
The document provides an overview of electrocardiography (ECG), including its history, importance, physiology, leads, waves, intervals, and abnormalities. Key points covered include the names and functions of the P, QRS, and T waves, as well as common abnormalities like ST segment elevation/depression, T wave inversion, and arrhythmias. The summary analyzes ECGs to recognize conditions like myocardial infarction and ventricular hypertrophy.
This document provides an overview of ECG basics:
- It outlines the history of ECG development from early discoveries in the 1800s to modern uses. Key figures mentioned include Matteucci, Marey, Einthoven.
- Components of the ECG waveform are defined including the P wave, QRS complex, T wave, and segments. Normal values and interpretations are provided.
- The 12-lead ECG system is described including standard and augmented limb leads and precordial leads.
- Normal sinus rhythm and procedures for analyzing ECGs such as determining heart rate and electrical axis are explained.
- Common abnormalities that can be detected from the ECG are listed such as arrhythmias,
This document discusses the use of echocardiography in emergency clinical situations. It provides examples of common clinical indications for emergency echocardiography including hemodynamic instability, aortic dissection, acute coronary syndromes, and critically ill patients. The document outlines echocardiography algorithms and describes how to use echocardiography to diagnose conditions like cardiac tamponade, pulmonary embolism, hypotension, and penetrating chest trauma. Key findings are highlighted for various emergency scenarios.
This document provides a history of the electrocardiogram (EKG/ECG) and describes how it is used to evaluate cardiac electrical activity and identify various cardiac conditions. Some key points:
- The EKG was developed in the late 19th/early 20th century, with scientists like Matteucci, Marey, and Einthoven contributing to its invention and clinical use.
- An EKG records the heart's electrical activity through electrodes on the skin and can be used to detect arrhythmias, ischemia, infarction, and other conditions.
- It analyzes the P wave, QRS complex, ST segment, and T wave to evaluate conduction and identify abnormalities.
This document outlines the course for ECG interpretation. It includes:
1. An overview of the anatomy and physiology of the heart
2. A breakdown of the course objectives and outline which covers ECG components, cardiac rhythms, arrhythmias, conduction blocks, and hypertrophies
3. Details of the locations of the heart and its layers, vessels, valves, and the pathway of blood flow
The document provides information on how to perform and interpret a basic electrocardiogram (ECG). It outlines the 10 main components that should be evaluated in a normal ECG, including the P wave, PR interval, QRS complex, ST segment, T wave, and QT interval. Reference ranges for durations and amplitudes of each component are provided. The document also discusses how to determine heart rate using the Rule of 300 or 10 Second Rule and identifies some abnormal findings that may be present, such as signs of atrial or ventricular enlargement.
This document provides an overview of electrocardiogram (ECG or EKG) basics including:
- The 12 leads of a standard ECG and what each views of the heart
- Components of the ECG tracing including the P, Q, R, S, and T waves
- Methods for calculating heart rate from the ECG
- Identification and classification of common cardiac rhythms, arrhythmias, conduction abnormalities, chamber enlargements, and other ECG findings
- Interpretation of ECG findings in the context of underlying cardiac conditions, structures, or pathologies
This document describes the case of a 77-year-old male who was found unconscious on the street by EMS with a heart rate of 250 beats per minute. He has a history of atrial fibrillation, hypertension, diabetes, and had a pacemaker inserted in 2014. Initial workup found ventricular tachycardia. He received amiodarone and cardioversion with temporary success. Over the following days he experienced recurrent arrhythmias and heart failure exacerbation. Angiography found no obstructive coronary artery disease. An ICD was implanted for secondary prevention of further lethal arrhythmias given his cardiomyopathy and recurrent instabilities.
Fascicular ventricular tachycardia is a type of ventricular tachycardia that originates in the Purkinje fibers near the fascicles of the left bundle branch. It typically presents in young males as palpitations or dizziness. The electrocardiogram shows a narrow QRS complex tachycardia with right bundle branch block morphology that is sensitive to verapamil. The reentrant circuit involves abnormal Purkinje fibers as the slow pathway and the left posterior fascicle as the fast pathway. Radiofrequency ablation targeting Purkinje potentials in the left ventricular septum is effective for treatment.
The document provides an overview of electrocardiogram (ECG) interpretation. It discusses the key steps including assessing quality, rate, rhythm, axis, P wave, PR interval, QRS duration and morphology, ST segment, T wave, QT interval, and identifying common abnormalities. Examples of important ECG patterns are also shown, such as lateral myocardial infarction, left bundle branch block, ventricular tachycardia, and Wolff-Parkinson-White syndrome. The overall document aims to develop a structured approach for interpreting ECGs in clinical practice.
The patient presented with an irregular pulse. An ECG showed evidence of two foci of atrial depolarization, indicating both right and left atrial premature depolarizations (APDs). The ECG pattern is known as atrioventricular bigeminy. The APDs are arising from a single irritable focus in the atria, which can be caused by various stimulants, toxins, or medical conditions. While usually benign, atrial bigeminy can potentially lead to more serious arrhythmias. Management involves correcting any underlying predisposing factors.
This document discusses M-mode echocardiography, including its physics, applications, and findings. M-mode provides high temporal resolution to evaluate cardiac structure movement and timing. It can be used to assess valves, walls, intervals, and morphology. Examples are given of M-mode findings in various cardiac pathologies at the mitral, aortic, pulmonary, and tricuspid valves as well as the left ventricle. Measurements like fractional shortening and ejection fraction are also reviewed.
A 45-year-old female presented with difficulty breathing, palpitations, and sweating for 4 hours. An ECG showed Wolff-Parkinson-White (WPW) syndrome, characterized by a short PR interval, delta wave, and widened QRS complex. WPW is a congenital condition involving an accessory pathway that allows supraventricular impulses to bypass the AV node and activate the ventricles early. Treatment options include antiarrhythmic drugs or radiofrequency ablation to destroy the accessory pathway.
This document provides a guide for medical students to interpret electrocardiograms (ECGs). It aims to enable students to determine normal ECG features, assess rate and rhythm, and identify myocardial infarctions. The guide outlines how to present ECG findings in a logical order, covering rate and rhythm, conduction intervals, cardiac axis, QRS complexes, and ST segments and T waves. Key normal and abnormal ECG patterns are defined. The guide is intended to help standardize ECG interpretation training for medical students.
Double outlet right ventricle (DORV) is a congenital heart defect where both the aorta and pulmonary artery exit from the right ventricle, with no arteries arising from the left ventricle. DORV occurs in multiple forms depending on the position and size of the great arteries and location of the ventricular septal defect. Surgical repair is the definitive treatment and involves correcting any pulmonary stenosis and patching the VSD to direct blood from the left ventricle to the aorta.
This document contains 14 cases with ECG findings and questions. It discusses various cardiac conditions that can present with abnormal ECG patterns, including STEMI, arrhythmias, congenital heart defects, electrolyte imbalances, and more. The key takeaways are: lead reversals can change the appearance of STEMI, sinus bradycardia U waves require specific criteria to diagnose hypokalemia, treating hyperkalemia requires membrane stabilizers followed by agents causing potassium influx, tricuspid atresia is the most common cyanotic congenital heart defect, lead issues can cause pacing problems in STEMI patients, inferior MI with RBBB could indicate distant LAD ischemia, mirror imaging limb leads results in a normal E
The document provides an overview of electrocardiography (ECG), including its history, the cardiac conduction system, ECG waveforms and intervals, ECG leads, and basic ECG interpretation. It describes the action potential of cardiac cells and its relationship to the ECG. Key topics covered include pacemakers of the heart, normal impulse conduction, the P wave, PR interval, QRS complex, T wave, QT interval, U wave, what an ECG is used to diagnose, the different ECG leads, and how to analyze normal rhythm.
This document provides an overview of electrocardiography (ECG) basics including:
1. It describes what an ECG is and what conditions it can be useful for diagnosing.
2. It outlines the different ECG leads including the standard and precordial leads used to measure electrical activity from different angles.
3. It explains the typical ECG waveforms including the P, QRS, T, and U waves as well as intervals like the PR and QT, and how to interpret abnormalities.
4. It provides guidance on interpreting an ECG including assessing lead position, rhythm, rate, axis, and looking for signs of conditions like bundle branch blocks or chamber enlargement.
This document provides an overview of how to systematically interpret an electrocardiogram (EKG or ECG). It describes evaluating the rhythm, rate, axis, intervals, waves, and arriving at a final diagnosis by considering abnormalities in relationship to clinical data. Key aspects include assessing the P wave, QRS complex, ST segment, T wave, and U wave in each lead in a specified order. Factors that can affect the ST segment, T wave, and U wave are also discussed.
This document provides a summary of the basics of electrocardiography (ECG). It discusses the history and development of ECG technology. It describes the normal cardiac conduction system and the waves that make up a normal ECG, including the P, QRS, and T waves. It outlines the 12 standard ECG leads and how they are positioned on the body. It reviews criteria for interpreting common cardiac abnormalities based on ECG findings such as hypertrophy, infarction, and arrhythmias.
This document provides instructions for analyzing cardiac rhythms based on an electrocardiogram (ECG). It describes 5 steps: 1) calculating the heart rate, 2) determining rhythm regularity, 3) assessing P waves, 4) measuring the PR interval, and 5) measuring QRS duration. Normal values for these metrics in normal sinus rhythm are also provided. The document additionally covers ECG lead placements and how the cardiac electrical conduction system generates the ECG tracings.
This document provides a summary of basics of electrocardiography (ECG/EKG). It discusses the history and development of ECG technology. It describes the components of a normal ECG waveform including the P, QRS, and T waves. It explains how to determine heart rate from an ECG and identify different arrhythmias based on the waveform. Key anatomical structures involved in heart's electrical conduction system are also outlined.
This document provides a 100 step guide to electrocardiogram (ECG) interpretation written by Dr. S. Aswini Kumar. It begins with basic definitions of an ECG, the machine used to record it, and how the paper is formatted. It then explains how to analyze various aspects of the ECG including heart rate, rhythm, electrical axis, P wave, PR interval, QRS duration, ST segment, T wave, and conditions like myocardial infarction. The document provides criteria for interpreting abnormalities and identifying conditions. It concludes with examples of analyzing ECG findings and providing an impression.
This document provides guidance on interpreting an electrocardiogram (ECG or EKG). It describes the normal components of the ECG including the P, QRS, T waves and segments. It outlines 10 steps for analyzing an ECG, such as determining the rhythm and rate, measuring intervals, calculating electrical axis, and inspecting for abnormalities. Key things to examine include the P waves, QRS complexes, ST segments, T waves and QT interval. Common abnormalities like ventricular hypertrophy, conduction blocks and electrolyte imbalances are also discussed.
Yes, there is evidence of right ventricular hypertrophy (RVH) based on the following criteria seen in this ECG:
- Tall R wave in V1 with R>>S
- Deep S waves in leads V4, V5, V6
- Associated right axis deviation
- Deep T wave inversions in V1, V2, V3
The findings are consistent with RVH. Causes of RVH include pulmonary hypertension, congenital heart disease, pulmonary embolism etc.
55
56
Is there any hypertrophy ?
56
Criteria and Causes of LVH
Criteria of LVH
Tall R waves in L1
Anesthesia related presentation very helpfulMalikArifUllah
This document provides an overview of coronary circulation, electrocardiography, and EKG interpretation. It describes the electrical conduction system of the heart and how it correlates to the EKG waveform. Key aspects of EKG interpretation including rate, rhythms, intervals, and waveform analysis are discussed. Various cardiac arrhythmias that can be lethal if left untreated are also reviewed.
This document provides instruction on systematically analyzing a 12-lead electrocardiogram (ECG). It outlines a 6-step approach to analyze the ECG, covering the last 3 steps in this module:
1. Calculate the heart rate
2. Determine the rhythm
3. Determine the QRS axis
4. Calculate the PR, QRS, and QT intervals
5. Assess for evidence of right or left atrial and ventricular hypertrophy
6. Look for evidence of myocardial infarction by examining for abnormal Q waves, ST segment elevation or depression, and abnormal T waves
Criteria are provided to diagnose abnormalities in each of the last 3 steps.
This presentation covers few basic things about ECG, especially for UG Medical students like ECG leads, normal ECG waves, axis of ECG and how to look for common ECG misplacements.
The document provides an overview of electrocardiography (ECG), describing what a 12-lead ECG is and why it is performed. It explains ECG components like the P wave, QRS complex, and T wave, and how they relate to electrical conduction through the heart. Common arrhythmias, blocks, abnormalities and their ECG presentations are outlined to aid in ECG interpretation.
To summarize the document:
1. The document outlines the steps for systematically analyzing a 12-lead ECG: rate, rhythm, axis, intervals, hypertrophy, and evidence of infarction.
2. It describes how to calculate and interpret the PR, QRS, and QT intervals and defines normal values.
3. Criteria are provided to assess for right and left atrial enlargement, right and left ventricular hypertrophy on the ECG.
4. The document instructs the reader to look for abnormal Q waves, ST elevation or depression, and T wave changes when analyzing the ECG for evidence of a myocardial infarction.
This document provides an overview of electrocardiography (ECG), including how an ECG works, the basics of recording an ECG, ECG leads, normal ECG waveforms and intervals, interpreting an ECG, common abnormalities, and how to report an ECG. It discusses topics such as the cardiac conduction system, Einthoven's triangle, the 12-lead ECG, determining heart rate and axis, normal sinus rhythm, P waves, QRS complex, ST segment, T waves, and the QT interval.
This document provides an overview of electrocardiography (ECG) including its history, basics, components, and interpretation. It discusses that ECG was invented in 1895 and measures the heart's electrical activity through electrodes placed on the skin. The ECG waveform includes the P wave, QRS complex, and T wave which represent atrial depolarization, ventricular depolarization, and ventricular repolarization, respectively. It also describes the normal ranges for components, abnormalities, cardiac axis determination, and standard 12-lead ECG. The document is a comprehensive review of electrocardiography fundamentals.
The document provides an overview of basics of ECG reading, including:
- What a 12-lead ECG is and why it is performed to monitor heart rate, rhythm, and detect diseases or disturbances.
- The anatomical position of the heart and impulse conduction pathway.
- Explanation of the P, Q, R, S, and T waves and normal ECG intervals.
- Description of the limb leads and chest leads used to view the heart from different angles.
- How to determine heart rate, rhythm, axis, and identify abnormalities.
The document outlines a systematic 7+2 step approach for interpreting electrocardiograms (ECGs) that involves analyzing the rhythm, rate, conduction, axes, wave morphologies, segment changes, and comparing to previous ECGs to form a clinical conclusion. The 7 steps examine the rhythm, rate, conduction intervals, axes, P wave, QRS, and ST-T wave morphologies. The +2 steps involve comparing the ECG to previous tracings and formulating a concluding statement.
This document provides an overview of electrocardiography (ECG or EKG):
- The ECG is essential for diagnosing cardiac rhythm abnormalities and chest pain, and guides treatment like thrombolysis for heart attacks.
- The history of ECG development is traced from early experiments in the 1800s to William Einthoven's invention of the first clinical ECG machine in the early 1900s.
- A normal ECG shows a regular rhythm between 60-100 beats per minute, visible P waves before each QRS complex, and normal durations for the P-R interval, QRS complex, and T wave.
Similar to 2. advanced 12 lead ecg interpretation by sammy (20)
How to Manage Reception Report in Odoo 17Celine George
A business may deal with both sales and purchases occasionally. They buy things from vendors and then sell them to their customers. Such dealings can be confusing at times. Because multiple clients may inquire about the same product at the same time, after purchasing those products, customers must be assigned to them. Odoo has a tool called Reception Report that can be used to complete this assignment. By enabling this, a reception report comes automatically after confirming a receipt, from which we can assign products to orders.
Temple of Asclepius in Thrace. Excavation resultsKrassimira Luka
The temple and the sanctuary around were dedicated to Asklepios Zmidrenus. This name has been known since 1875 when an inscription dedicated to him was discovered in Rome. The inscription is dated in 227 AD and was left by soldiers originating from the city of Philippopolis (modern Plovdiv).
Gender and Mental Health - Counselling and Family Therapy Applications and In...PsychoTech Services
A proprietary approach developed by bringing together the best of learning theories from Psychology, design principles from the world of visualization, and pedagogical methods from over a decade of training experience, that enables you to: Learn better, faster!
CapTechTalks Webinar Slides June 2024 Donovan Wright.pptxCapitolTechU
Slides from a Capitol Technology University webinar held June 20, 2024. The webinar featured Dr. Donovan Wright, presenting on the Department of Defense Digital Transformation.
How to Setup Default Value for a Field in Odoo 17Celine George
In Odoo, we can set a default value for a field during the creation of a record for a model. We have many methods in odoo for setting a default value to the field.
Elevate Your Nonprofit's Online Presence_ A Guide to Effective SEO Strategies...TechSoup
Whether you're new to SEO or looking to refine your existing strategies, this webinar will provide you with actionable insights and practical tips to elevate your nonprofit's online presence.
🔥🔥🔥🔥🔥🔥🔥🔥🔥
إضغ بين إيديكم من أقوى الملازم التي صممتها
ملزمة تشريح الجهاز الهيكلي (نظري 3)
💀💀💀💀💀💀💀💀💀💀
تتميز هذهِ الملزمة بعِدة مُميزات :
1- مُترجمة ترجمة تُناسب جميع المستويات
2- تحتوي على 78 رسم توضيحي لكل كلمة موجودة بالملزمة (لكل كلمة !!!!)
#فهم_ماكو_درخ
3- دقة الكتابة والصور عالية جداً جداً جداً
4- هُنالك بعض المعلومات تم توضيحها بشكل تفصيلي جداً (تُعتبر لدى الطالب أو الطالبة بإنها معلومات مُبهمة ومع ذلك تم توضيح هذهِ المعلومات المُبهمة بشكل تفصيلي جداً
5- الملزمة تشرح نفسها ب نفسها بس تكلك تعال اقراني
6- تحتوي الملزمة في اول سلايد على خارطة تتضمن جميع تفرُعات معلومات الجهاز الهيكلي المذكورة في هذهِ الملزمة
واخيراً هذهِ الملزمة حلالٌ عليكم وإتمنى منكم إن تدعولي بالخير والصحة والعافية فقط
كل التوفيق زملائي وزميلاتي ، زميلكم محمد الذهبي 💊💊
🔥🔥🔥🔥🔥🔥🔥🔥🔥
Andreas Schleicher presents PISA 2022 Volume III - Creative Thinking - 18 Jun...EduSkills OECD
Andreas Schleicher, Director of Education and Skills at the OECD presents at the launch of PISA 2022 Volume III - Creative Minds, Creative Schools on 18 June 2024.
2. 2
samueldebassu@gmail.com
The 12-lead can provide a computer generated
interpretation.
The computer is right about 98% of the
time.
But if the computer isn’t absolutely sure, it
will not say anything about it.
So YOU are the primary interpreter, the
computer is your backup.
4. Normal ECG RULES
samueldebassu@gmail.com 4
RULE 1:-PR interval should be 3 to 5 little squares
RULE 2:-The width of the QRS should 2 -3 little squares
RULE 3:-The QRS complex should be dominantly upright in
leads I and II
RULE 4:-QRS and T waves tend to have the same general
direction in the limb leads
RULE 5:- All waves are negative in lead aVR
5. Cont.…
RULE 6
The R wave must grow from V1 to at least V4
The S wave must grow from V1 to at least V3
and disappear in V6
samueldebassu@gmail.com 5
6. Cont..
RULE 7:-The ST segment should start isoelectric
except in V1 and V2 where it may be elevated
RULE 8:-The P waves should be upright in I, II, and V2
to V6.
RULE 9:-There should be no Q wave or only a small q
less than 0.04 seconds in width in I, II, V2 to V6.
RULE 10:-The T wave must be upright in I, II, V2 to
V6.
samueldebassu@gmail.com 6
7. Step wise approach in Reading 12-Lead ECGs
1. Calculate RATE
2. Determine RHYTHM
3. Determine AXIS
4. Calculate INTERVALS
5. Assess for HYPERTROPHY
6. Look for evidence of INFARCTION
7
samueldebassu@gmail.com
8. 1. Calculate Rate
If you use the rhythm strip
portion of the 12-lead
ECG the total length of it
is always 10 seconds long.
So you can count the
number of R waves in the
rhythm strip and multiply
by 6 to determine the beats
per minute.
8
Rate? 12 (R waves) x 6 = 72 bpm
samueldebassu@gmail.com
9. 2. Determine RHYTHM
Look at the R-R distances
Regular (are they equidistant apart)? Occasionally irregular?
Regularly irregular? Irregularly irregular?
Interpretation? Regular
9
samueldebassu@gmail.com
10. 3. DETERMINE AXIS
• The QRS axis represents the net overall direction of
the heart’s electrical activity.
Determine QRS AXIS
Normal
Left axis deviation
Right axis deviation
Right superior axis deviation
samueldebassu@gmail.com 10
11. Cont. ..
Normal = -30° to +90°.
-30° to -90° =LAD
+90° to +180° =RAD
-90°to +180 = Right
extrime axis deviation
samueldebassu@gmail.com 11
13. Determining the axis..cont
Examine the QRS complex in lead I ,II and aVF to
determine if they are predominantly positive or
predominantly negative.
The combination should place the axis into one of
the 4 quadrants below.
samueldebassu@gmail.com 13
14. Cont.… axis deviation
Is the QRS axis normal in this ECG?
14
No, there is left axis
deviation.
The QRS is positive in I and negative in II.
samueldebassu@gmail.com
15. COMMON CAUSES OF LAD
May be normal in the elderly and very obese
Inferior wall MI
left Ventricular Hypertrophy
Left Bundle Branch Block
Emphysema
samueldebassu@gmail.com 15
16. COMMON CAUSES OF RAD
Normal variant
Right Ventricular Hypertrophy
Anterior MI
Right Bundle Branch Block
Left Posterior Hemiblock
samueldebassu@gmail.com 16
17. Causes Right extreme axis deviation
• Lateral myocardial infarction.
• Right ventricular hypertrophy.
• Ventricular tachycardia.
• Left ventricular atrophy.
samueldebassu@gmail.com 17
18. 4. Calculate INTERVALS
Intervals refers to the length of:
PR
QT intervals and
the width of the QRS complexes.
samueldebassu@gmail.com 18
19. PR interval
< 0.12 s 0.12-0.20 s > 0.20 s
High catecholamine
states
Wolff-Parkinson-
White
Normal AV nodal blocks
19
Wolff-Parkinson-White 1st Degree AV Block
samueldebassu@gmail.com
20. QRS complex
< 0.10 s 0.10-0.12 s > 0.12 s
Normal
Incomplete bundle
branch block
Bundle branch block
Ventricular rhythm
20
3rd degree AV block
with ventricular
escape rhythm
Incomplete bundle
branch block
samueldebassu@gmail.com
21. 21
The duration of the QT interval is ~ HR.
The faster the HR, the faster the ventricles
repolarize so the shorter the QT interval.
For each heart rate you need to calculate an
adjusted QT interval, called the “corrected
QT” (QTc):
QTc = QT / square root of RR interval
samueldebassu@gmail.com
QT interval
22. QTc interval
0.38-0.44 s > 0.44 s
Normal Long QT
22
A prolonged QT can be very dangerous. It may
predispose an individual to a type of ventricular
tachycardia called Torsades de Pointes. Causes
include drugs, electrolyte abnormalities, CNS
disease, post-MI, and congenital heart disease.
Torsades de Pointes
Long QT
samueldebassu@gmail.com
23. Intervals cont..
23
PR interval? QRS width? QTc interval?
0.08 sec
0.16 sec 0.49 sec
QT = 0.40 s
RR = 0.68 s
Square root of
RR = 0.82
QTc = 0.40/0.82
= 0.49 s
Interpretation of intervals? Normal PR and QRS, long QT
samueldebassu@gmail.com
24. Intervals cont..
24
Tip: Instead of calculating the QTc, a quick way to estimate
if the QT interval long is to use the following rule:
A QT > half of the RR interval is probably long.
Normal QT Long QT
QT
RR
10 boxes
23 boxes 17 boxes
13 boxes
samueldebassu@gmail.com
25. 5. Assess for HYPERTROPHY
Three things can happen to a wave on the ECG when a
chamber hypertrophies or enlarges:
1. The chamber can take longer to depolarize. The ECG
wave may therefore increase in duration.
2. The chamber can generate more current and thus a
larger voltage. The wave may therefore increase in
amplitude.
3. A larger percentage of the total electrical current can
move through the expanded chamber.
samueldebassu@gmail.com 25
26. Right atrial enlargement (RAE)
Left atrial enlargement (LAE)
Right ventricular hypertrophy (RVH)
Left ventricular hypertrophy (LVH)
samueldebassu@gmail.com 26
In this step, we use the ECG to
determine
27. a. Right atrial enlargement is diagnosed by
P waves with an amplitude >2.5 mm in at
least one of the inferior leads II, III, and aVF
or >1.5mm in chest leads.
No change in the duration of the P wave
Possible right axis deviation of the P wave
samueldebassu@gmail.com 27
29. b. To diagnose Left atrial enlargement
you can use the following criteria:
II > 0.04 s (1 box) between notched peaks,
or
V1 Neg. deflection > 1 box wide x 1 box deep
The duration of the P wave is increased.
No significant axis deviation is seen because the
left atrium is normally electrically dominant.
samueldebassu@gmail.com 29
31. c. Right ventricular hypertrophy
– Take a look at this ECG. What do you notice
about the axis and QRS complexes over the right
ventricle (V1, V2)?
samueldebassu@gmail.com 31
There is right axis deviation (negative in I, positive in
II) and there are tall R waves in V1, V2.
32. Cont. …RVH
To diagnose RVH you can use the following
criteria:
Right axis deviation, and
V1 R wave > 7mm tall
In lead V1, the R wave is larger than the S
wave.
In lead V6, the S wave is larger than the R
wave.
samueldebassu@gmail.com 32
34. d. Left ventricular hypertrophy
Take a look at this ECG. What do you notice about the axis
and QRS complexes over the left ventricle (V5, V6) and right
ventricle (V1, V2)?
There is left axis deviation (positive in I, negative in II) and
there are tall R waves in V5, V6 and deep S waves in V1, V2.
samueldebassu@gmail.com 34
35. LVH… cont
• The deep S waves seen in the leads
over the right ventricle are created
because the heart is depolarizing left,
superior and posterior (away from
leads V1, V2).
samueldebassu@gmail.com 35
36. LVH… cont
To diagnose LVH you can use the following
criteria*:
S in V1+ R in V5 or V6 > 35 mm
The R-wave amplitude in lead V5 exceeds 26 mm.
The R-wave amplitude in lead V6 exceeds 20 mm.
samueldebassu@gmail.com 36
40. Q Waves
Pathologic Q waves present in II, III and aVF suggest necrosis
has occurred in the inferior region of the left ventricle.
samueldebassu@gmail.com 40
41. Summary of ischemia and infraction
A normal ECG does NOT rule out Acute
Coronary Syndrome(ACS).
ST segment depression represents ischemia
-Possible infarct
ST segment elevation is evidence of AMI
Q wave MI may follow ST elevation or
depression
41
samueldebassu@gmail.com
42. Practical example
A 63 years old man has longstanding, uncontrolled
hypertension. Is there evidence of heart disease from
his hypertension? (Hint: There a 3 abnormalities)
samueldebassu@gmail.com 42
43. samueldebassu@gmail.com 43
Yes, there is left axis deviation (positive in I,
negative in II), left atrial enlargement (> 1 x 1
boxes in V1) and LVH (R in V5 = 27 + S in V2 = 10
> 35 mm).
44. Summary to 12 lead ECG interpretation
1. Calculate RATE
2. Determine RHYTHM
3. Determine QRS AXIS
– Normal
– Left axis deviation
– Right axis deviation
– Right superior axis
deviation
4. Calculate INTERVALS
– PR
– QRS
– QT
5.Assess for HYPERTROPHY
– Right and left atrial
enlargement
– Right and left ventricular
hypertrophy
6.Look for evidence of
INFARCTION
– Abnormal Q waves
– ST elevation or
depression
– Peaked, flat or inverted T
samueldebassu@gmail.com 44