This document provides instructions for a laboratory work in the mathematical environment MathCAD. It describes how to enter and edit mathematical expressions, perform calculations, solve equations and systems of equations, and build function graphs in MathCAD. The tasks include performing arithmetic operations, solving equations for given variable values, simplifying expressions, and solving systems of nonlinear equations.
Gentle Introduction to Functional ProgrammingSaurabh Singh
This slide is basically aimed at professionals and students to introduce them with functional programming.
I haven't used much functional programming terminologies because I personally feel they could be overwhelming to people getting introduced to FP for the first time. For similar reasons I have deliberately avoided using any functional programming language and kept the discussions programming language agnostic as far as possible.
Explanation on Tensorflow example -Deep mnist for expert홍배 김
you can find the exact and detailed network architecture of 'Deep mnist for expert' example of tensorflow's tutorial. I also added descriptions on the program for your better understanding.
Explanation on Tensorflow example -Deep mnist for expert홍배 김
you can find the exact and detailed network architecture of 'Deep mnist for expert' example of tensorflow's tutorial. I also added descriptions on the program for your better understanding.
Notebooks such as Jupyter give programming languages a level of interactivity approaching that of spreadsheets.
I present here an idea for a programming language specifically designed for an interactive environment similar to a notebook.
It aims to combining the power of a programming language with the usability of a spreadsheet.
Instead of free-form code, the user creates fields / columns, but these can be combined into tables and object classes.
By decoratively cycling through field elements, loops and other programming constructs can be created.
I give examples from classical computer science, machine learning and mathematical finance, specifically:
Nth Prime Number, 8 Queens, Poker Hand, Travelling Salesman, Linear Regression, VaR Attribution
This is the version of my 3D math talk that I used at CocoaConf Atlanta. This version includes the graphic representations of the different steps in implementing the shader.
More instructions for the lab write-up1) You are not obli.docxgilpinleeanna
More instructions for the lab write-up:
1) You are not obligated to use the 'diary' function. It was presented only for you convenience. You
should be copying and pasting your code, plots, and results into some sort of "Word" type editor that
will allow you to import graphs and such. Make sure you always include the commands to generate
what is been asked and include the outputs (from command window and plots), unless the problem
says to suppress it.
2) Edit this document: there should be no code or MATLAB commands that do not pertain to the
exercises you are presenting in your final submission. For each exercise, only the relevant code that
performs the task should be included. Do not include error messages. So once you have determined
either the command line instructions or the appropriate script file that will perform the task you are
given for the exercise, you should only include that and the associated output. Copy/paste these into
your final submission document followed by the output (including plots) that these MATLAB
instructions generate.
3) All code, output and plots for an exercise are to be grouped together. Do not put them in appendix, at
the end of the writeup, etc. In particular, put any mfiles you write BEFORE you first call them.
Each exercise, as well as the part of the exercises, is to be clearly demarked. Do not blend them all
together into some sort of composition style paper, complimentary to this: do NOT double space.
You can have spacing that makes your lab report look nice, but do not double space sections of text
as you would in a literature paper.
4) You can suppress much of the MATLAB output. If you need to create a vector, "x = 0:0.1:10" for
example, for use, there is no need to include this as output in your writeup. Just make sure you
include whatever result you are asked to show. Plots also do not have to be a full, or even half page.
They just have to be large enough that the relevant structure can be seen.
5) Before you put down any code, plots, etc. answer whatever questions that the exercise asks first.
You will follow this with the results of your work that support your answer.
SAMPLE QUESTION:
Exercise 1: Consider the function
f (x,C)=
sin(C x)
Cx
(a) Create a vector x with 100 elements from -3*pi to 3*pi. Write f as an inline or anonymous function
and generate the vectors y1 = f(x,C1), y2 = f(x,C2) and y3 = f(x,C3), where C1 = 1, C2 = 2 and
C3 = 3. Make sure you suppress the output of x and y's vectors. Plot the function f (for the three
C's above), name the axis, give a title to the plot and include a legend to identify the plots. Add a
grid to the plot.
(b) Without using inline or anonymous functions write a function+function structure m-file that does
the same job as in part (a)
SAMPLE LAB WRITEUP:
MAT 275 MATLAB LAB 1 NAME: ...
The name MATLAB stands for MATrix LABoratory.MATLAB is a high-performance language for technical computing.
It integrates computation, visualization, and programming environment. Furthermore, MATLAB is a modern programming language environment: it has sophisticated data structures, contains built-in editing and debugging tools, and supports object-oriented programming.
These factor make MATLAB an excellent tool for teaching and research.
Research Inventy : International Journal of Engineering and Scienceresearchinventy
Research Inventy : International Journal of Engineering and Science is published by the group of young academic and industrial researchers with 12 Issues per year. It is an online as well as print version open access journal that provides rapid publication (monthly) of articles in all areas of the subject such as: civil, mechanical, chemical, electronic and computer engineering as well as production and information technology. The Journal welcomes the submission of manuscripts that meet the general criteria of significance and scientific excellence. Papers will be published by rapid process within 20 days after acceptance and peer review process takes only 7 days. All articles published in Research Inventy will be peer-reviewed.
How to Make a Field invisible in Odoo 17Celine George
It is possible to hide or invisible some fields in odoo. Commonly using “invisible” attribute in the field definition to invisible the fields. This slide will show how to make a field invisible in odoo 17.
Model Attribute Check Company Auto PropertyCeline George
In Odoo, the multi-company feature allows you to manage multiple companies within a single Odoo database instance. Each company can have its own configurations while still sharing common resources such as products, customers, and suppliers.
Welcome to TechSoup New Member Orientation and Q&A (May 2024).pdfTechSoup
In this webinar you will learn how your organization can access TechSoup's wide variety of product discount and donation programs. From hardware to software, we'll give you a tour of the tools available to help your nonprofit with productivity, collaboration, financial management, donor tracking, security, and more.
Palestine last event orientationfvgnh .pptxRaedMohamed3
An EFL lesson about the current events in Palestine. It is intended to be for intermediate students who wish to increase their listening skills through a short lesson in power point.
Instructions for Submissions thorugh G- Classroom.pptxJheel Barad
This presentation provides a briefing on how to upload submissions and documents in Google Classroom. It was prepared as part of an orientation for new Sainik School in-service teacher trainees. As a training officer, my goal is to ensure that you are comfortable and proficient with this essential tool for managing assignments and fostering student engagement.
The Indian economy is classified into different sectors to simplify the analysis and understanding of economic activities. For Class 10, it's essential to grasp the sectors of the Indian economy, understand their characteristics, and recognize their importance. This guide will provide detailed notes on the Sectors of the Indian Economy Class 10, using specific long-tail keywords to enhance comprehension.
For more information, visit-www.vavaclasses.com
How to Split Bills in the Odoo 17 POS ModuleCeline George
Bills have a main role in point of sale procedure. It will help to track sales, handling payments and giving receipts to customers. Bill splitting also has an important role in POS. For example, If some friends come together for dinner and if they want to divide the bill then it is possible by POS bill splitting. This slide will show how to split bills in odoo 17 POS.
1. 1
Лабораторна робота № 4
РОБОТА З ТЕКСТОВИМ І ФОРМУЛЬНИМ РЕДАКТОРОМ В MathCAD
Мета: практичне знайомство з математичним середовищем, засвоєння
синтаксису операторів, здійснення основних операцій по введенню, обробці
і отриманню даних, навчитися проводити елементарні обчислення за
допомогою системи MathCAD, розв’язувати рівняння, системи рівнянь в
математичному середовищі MathCAD, будувати графіки функцій
ХІД РОБОТИ
I. Ввійти в середовище Mathcad.
II. Виконати обчислення (пункти 3-5), результати занести в звіт.
Введення й редагування математичних виразів
Щоб надати значення простій змінній, слід натиснути на клавішу із
символом (:). На екрані ця дія позначається символом (:=). (Наприклад
х:=3).
Щоб надати значення змінній – діапазону, слід натиснути на клавішу
із символом (;). На екрані це буде виглядати наступним чином х1:=1..4
(при цьому крок збільшення за замовчуванням буде рівний 1).
Якщо задати три значення аргументу, то крок буде дорівнює різниці
між другим і першим значенням аргументу;
Щоб отримати результат обчислень числового чи іншого виразу, слід
натиснути на клавішу =
Щоб ввести символ = в сенсі «рівно», наприклад в рівнянні, треба
натиснути Ctrl+.
Щоб вставити дужки натисніть апостроф (‘) .
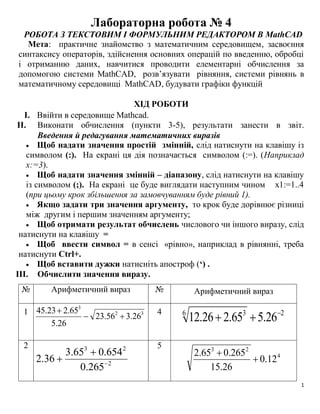
III. Oбчислити значення виразу.
№
нта
Арифметичний вираз № Арифметичний вираз
1 3
2
3
26
.
3
56
.
23
26
.
5
65
.
2
23
.
45
4 2
6 3
26
.
5
65
.
2
26
.
12
2
2
2
3
265
.
0
654
.
0
65
.
3
36
.
2
5
4
2
3
12
.
0
26
.
15
265
.
0
65
.
2
2. 2
3 456
.
0
2
.
1
126
26
.
2
5
.
0 4
6 8 4
26
.
3
26
.
12
25
.
0
IV. Обчислити значення виразу при заданих значеннях змінних:
№
варіанта
Змінні Вираз
а b с X
1 2.23 0.45 3.25 0.123
c
bx
e
a x
cos
2 0.23 135 0.36 0.231 c
x
bc
a
)
sin
cos(
3 1.23 0.68 136 1.235
1
sin
x
c
b
a
4 2.36 0.56 3.65 1.365 3 sin b
c
tgx
a
5 0.36 1.23 5.26 0.236
3 35
.
0
2
2
1
ac
x
e
a
bx
ax
6 2.65 3.23 1.25 0.254
bx
c
x
a
x
ln
sin
1
sin
2
3
V. Обчислити вираз при заданих дискретних значеннях змінних.
Дискретна змінна вводиться у форматі:
var:=початкове значення, [початкове значення+крок] .. кінцеве значення
у дужках зазначений необов'язковий параметр, за
замовчуванням крок рівний 1. Двокрапка ".." вводиться клавішею
c
b
a
b
x
a
x 2
2
2
2
a:=0.8 c:=1.35
b:=-3.2
x:=2, 2.1..4
3. 3
крапка з комою ";" або кнопкою арифметичної палітри
Завдання для виконання
№ Змінні Дискретний
аргумент
Вираз
a b с Інтервал крок
1 2.32 0.45 3.25 X ε
(0.1;0.4)
0.025
c
b
a
x
x
a
x
3
sin
2
cos
2 1.23 1.35 0.36 X ε (1;3) 0.2
a
bx
b
ax
e bx
)
sin(
3 2.36 0.68 1.36 X ε (0;2) 0.25 )
cos(
3
)
(
2 b
x
a
x
arctg bx
x
4 3.21 9.56 3.65 X ε (1;4) 0.5 )
lg(
)
lg( 3
2
x
b
b
x
a
e x
x
5 2.36 4.23 5.26 X ε (1;2) 0.2
b
x
b
a
x
xarctg arcsin
6 4.12 3.23 1.25 X ε (0;3) 0.5
1
)
cos(
2
x
x
b
a
b
a x
x
VI. Розкласти на множники вирази: (Символы/Расширить)
(𝑎 + 𝑏)2
(𝑧 + 2𝑥)2
(𝑎 + 𝑏)3
(𝑥 − 1)2
∙ (𝑥2
+ 𝑥 + 1)
(𝑎 + 𝑏) ∙ (𝑎 − 𝑏)
VII. Спростити вирази: ( Символы/Расширить, Символы/Упростить)
(𝟏 +
𝟐
𝟑𝒙−𝟏
) ∙ (𝟏 −
𝟗𝒙−𝟗𝒙𝟐
𝟑𝒙+𝟏
) + 𝟏;
𝒙𝟐+𝟑𝒙+𝟏−𝟓𝒙
(𝒙−𝟏)𝟐
;
𝒙𝟐−𝟐𝒙+𝟏
(𝒙−𝟏)𝟐(𝒙+𝟐𝒙+𝟏)
(відповіді для перевірки: 3х, 1, 1/(3х+1)
ПРИКЛАД:
4. 4
Необхідно спростити вираз:
(𝑎 + 𝑏)(𝑎 − 𝑏)
𝑎2 − 𝑏2
1. Визначити постановку завдання в текстовому редакторі:
а) у меню Вставка вибрати команду Текстова Область або клацнути по
клавіші “;
б) у текстовій області, що відкрилася, набрати текст «Спростити вираз»;
в) для виходу у формульний редактор клацнути мишкою поза текстовою
областю;
2. Увести вираження - де при введенні дробів або дужок необхідно
дотримувати розміщення синього куточка, тому що при неправильному
уведенні результат буде помилковим або взагалі не буде обчислення.
3. Виділити вираження або розмістити синій куточок так, щоб він
охоплював весь вираз.
4. Символы /Стиль вычислений/Горизонтально.
5. Симолы /Упростить.
VIII. Розв’язати рівняння
Нелінійне рівняння з одним невідомим можна завжди представити у
вигляді f(x)=0 шляхом переносу правої частини в ліву із протилежним
знаком. Для розв’язання такого рівняння використовується функція
root( f(z), z) . Аргументами цієї функції є сама функція і змінна, щодо якої
вирішується рівняння.
!!! Для введення даних використовується знак
«:=»
Для отримання результату - знак « =»
Другий спосіб виклику функції
root полягає в тому, що для х не
вказується початкове значення.
Замість цього визначається інтервал
по х, на якому відбувається пошук
кореня. Причому значення функції в
кінцях цього інтервалу повинні бути різними за знаком.
5. 5
Завдання для виконання
№ f(x) відрізок № f(x) відрізок
1 √3𝑥2(−3)𝑥
3
[−1,6] 11 2(𝑥2
+ 3)
𝑥2
− 2𝑥
[−1,1]
2 1 + √2(𝑥 − 1)(𝑥 − 7)
3 [−1,5] 12 10𝑥
𝑥2 + 1
− 3
[−1,0]
3 4𝑥
𝑥2 + 4
[−4,2] 13
8 +
8
𝑥
−
𝑥2
2
[−3,1]
4 √2(𝑥 + 1)2(5 − 𝑥)
3
[−3,3] 14 2√𝑥-x-0.5 [−2,1]
5
2 − 𝑥 −
4
(𝑥 + 2)2
[−1,2] 15 𝑥 − 4√𝑥 + 2 [−1,2]
6 √2(𝑥 − 2)2(8 − 𝑥) − 1
3
[0, −6] 16 2(−𝑥2
+ 7𝑥 − 7)
𝑥2 − 2𝑥
[−1,1]
7
4 − 𝑥 −
4
𝑥2
[−1,6] 17 𝑥 − 4√𝑥+3 [−3,1]
8 𝑥2
+
16
𝑥
-16 [−2,1] 18 1 − √2(5 − 𝑥)2
3
[−2,1]
9
2𝑥2
+
108
𝑥2
− 59
[−3,0] 19 10𝑥2
𝑥2 + 1
− 2
[−1,5]
10 1 + √2𝑥2(𝑥 − 6)
3
[−1,4] 20
2𝑥 − 𝑥 −
4
𝑥2
[−6,3]
ІХ. Розв’язок системи нелінійних рівнянь здійснюється за
допомогою функції find .
1. Розв’язати систему нелінійних рівнянь
{
𝑥2
− 𝑦 − 1 = 0
𝑥 + 𝑦 = −1
2. Надрукуйте слово given, це повідомить
MathCad, що далі буде введена система
рівнянь.
3. Введіть систему рівнянь.
4. Переконайтеся, що для введення знака =
використовується Ctrl = .
given
x
2
y
1
0
x 1 y
find x y
( )
1
0
2
3
6. 6
5. Надрукуйте функцію find. Аргументами функції являються змінні,
відносно яких розв’язується система рівнянь (в нашому випадку це
find(x,y).
6. Натисніть Ctrl .( клавіша Ctrl і крапка). MathCad відображає
символьний знак дорівнює ().
7. Натисніть Enter для отримання результату.
В даному прикладі Given – ключове слово, find – вбудована функція для
рішення системи.
Завдання для виконання. Знайти символьне рішення системи рівнянь
Варіан
т
а б в
1 5
2 2
x
у
х
4
у
9
3 2
x
у
1
х
у
2
1 x
у
х
у
3
2 2
2 x
у
1
х
у
1
3
x
у
х
4
у
1
2 2
x
у
х
у
3
3 4
9 2
x
у
х
у
3
2
5
1 x
у
1
х
у
2
1 x
у
х
4
у
4 12
2
х
у
1
х
у
1
2
х
у
х
у
3
6
2
х
у
х
4
у
5 1
4 2
х
у
х
у
3
2
1 x
у
х
4
у
1
3 2
x
у
1
х
у
6 5
2 2
x
у
2
х
у
9
3 2
x
у
1
-
х
у
2
1 x
у
х
у
5
7. 7
Функція Minerr(x,y,...) – повертає наближений
розв’язок системи рівнянь і нерівностей.
x, y,... є скалярні змінні, значення яких
шукаються в блоці рішення рівнянь.
Перед використанням цієї функції необхідно
задати початкове наближення для кожної
невідомої. Якщо система має декілька рішень, то
знайдений розв’язок визначається заданим
початковим наближенням.
Завдання для виконання Розв’язати систему нелінійних рівнянь за
допомогою функції Minerr.
№
варіант
а
Система рівнянь
№
варіанта
Система рівнянь
1. sin(x) + 2y =2
cos(y-1) + x=0,7
6 sin(x+0,5) - y=1
cos(y-2) - x=0
2. sin(x+0,5) - y=1
cos(y-2) - x=0
7 cos(x)+y=1,5
2x-sin(y-0,5)=1
3. cos(x)+y=1,5
2x-sin(y-0,5)=1
8 cos(x+0,5)+y=0,8
sin(y) - 2x=1,6
4. cos(x+0,5)+y= 0,8
sin(y) - 2x=1,6
9 sin(x-1)=1,3 –y
x-sin(y+1)=0,8
5. sin(x-1)=1,3 – y 10 cos(x+0,5)+y=1
8. 8
x-sin(y+1)=0,8 sin(y) - 2x=2
IX. Розв’язок системи рівнянь в матричній формі
Приклад 1 . Розв’язати систему рівнянь в матричній формі
{
𝑥1 + 2𝑥2 − 3𝑥3 = 10
4𝑥1 + 5𝑥2 + 6𝑥3 = 20
7𝑥1 − 8𝑥2 − 9𝑥3 = 30
Алгоритм розв’язання системи рівнянь
1. Створити 3 математичних блока і заповнити їх наступними матрицями
a, b, x. Щоб створити матрицю необхідно: на панелі інструментів
Математика вибрати вкладку Векторные и матричне операции –
відкриється панель
Матрицы. На панелі
Матрицы вибрати вкладку
Создать матрицу. Вказати
кількість рядків і стовпців
для кожної матриці.(
Наприклад, для матриці а
необхідно 3 рядка, 3
стовпця).
2. Відкриваємо блок рішення,
який починається
службовим словом given.
3. Вводимо вираз: ax=b (щоб
ввести символ = в сенсі «рівно», треба натиснути Ctrl +).
4. Закриваємо блок рішення службовим словом find. Запис повинен мати
вигляд find(x) = . (Щоб отримати результат обчислень числового чи
іншого виразу, слід натиснути на клавішу =).
5. Результат розв’язання системи ви бачите на мал.1
9. 9
Завдання для виконання
№ а б в
1
2
3
2
16
2
3
2
34
8
5
3
2
1
3
2
1
3
2
1
х
х
х
х
х
х
х
х
х
2
7
2
17
3
5
3
2
2
3
2
1
3
2
1
3
2
1
х
х
х
х
х
х
х
х
х
9
3
2
1
2
3
2
5
8
5
3
2
1
3
2
1
3
2
1
х
х
х
х
х
х
х
х
х
2
7
4
3
2
1
4
11
4
26
2
5
7
3
2
1
3
2
1
3
2
1
х
х
х
х
х
х
х
х
х
6
2
8
3
4
4
3
2
1
3
2
1
3
2
1
х
х
х
х
х
х
х
х
х
6
5
17
3
4
2
4
2
4
3
3
2
1
3
2
1
3
2
1
х
х
х
х
х
х
х
х
х
3
8
3
4
15
6
3
8
1
3
2
1
3
2
1
3
2
1
х
х
х
х
х
х
х
х
х
6
5
2
3
1
4
3
2
8
3
2
3
2
1
3
2
1
3
2
1
х
х
х
х
х
х
х
х
х
8
3
4
15
6
3
8
1
3
2
1
3
2
1
3
2
1
х
х
х
х
х
х
х
х
х
4
7
2
6
5
2
3
5
2
17
2
3
4
3
2
1
3
2
1
3
2
1
х
х
х
х
х
х
х
х
х
6
3
2
6
3
2
3
2
3
3
2
1
3
2
1
3
2
1
х
х
х
х
х
х
х
х
х
17
5
2
3
4
4
3
2
1
3
2
3
2
1
3
2
1
3
2
1
х
х
х
х
х
х
х
х
х
5
3
2
6
5
2
3
5
2
6
2
3
4
3
2
1
3
2
1
3
2
1
х
х
х
х
х
х
х
х
х
6
4
4
0
2
2
5
2
3
2
1
3
2
1
3
2
1
х
х
х
х
х
х
х
х
х
1
4
2
3
1
2
4
3
6
2
3
2
1
3
2
1
3
2
1
х
х
х
х
х
х
х
х
х
XI.Графіки функцій
Приклад. Побудуйте у декартових координатах графік функції )
tan( x
y
− Для побудови у декартових координатах графіка функції можна
скористатися панеллю інструментів «Графік»:
− Після вибору режиму побудови двомірного графіка у координатних
осях Х-Y на робочому листі створюється шаблон з полями-
заповнювачами, для завдання відображуваних даних по осям абсцис та
ординат. Заповнювач у середини осі координат призначено для змінної
10. 10
або виразу, відображуваного по цій осі. Заповнювачі для граничних
значень з'являються після введення аргументу або функції. Граничні
значення по осях вибираються автоматично відповідно з діапазоном
зміни величин, але їх можна задати, клацнувши в області відповідних
полів-наповнювачів і змінивши значення в них. Напр. по ОХ – х, по ОУ –
tan(x)
10
5
0 5 10
30
20
10
0
10
20
30
tan x
( )
x
− Для зміни формату осей, засобу їх оцифровки, коліру графіків
необхідно виділити графік, виконати команду Формат – Графік –
Точка Х-Y та виконати потрібне форматування.
Завдання для виконання
Побудуйте у декартових координатах графіки функцій та самостійно
відформатуйте їх.
а) y:= ex
б) y:=cos(x) * e -0.05*x
в) y:=x2
+3x+6
ТЕОРЕТИЧНИЙ МАТЕРІАЛ
MathCad — середовище виконання чисельних та символьних обчислень
вищої математики з класу систем автоматизованого проектування (САПР),
орієнтоване на створення інтерактивних документів з математичними
обчисленнями будь-якої складності і зручним візуальним супроводженням
вихідних даних, проміжних і кінцевих результатів.
11. 11
.Основним документом Mathcad є робочий аркуш, межі якого
виділяються суцільною лінією, а поля – штриховою . Mathcad допускає
введення формул і тексту в будь-якому місці робочого документа.
Кожний математичний вираз або фрагмент тексту є областю. Робочій
документ Mathcad є сукупність таких областей. Mathcad створює три типа
областей – текстову, математичну й графічну. Щоб зробити області
видимими необхідно виконати команду Вид/Границы.
Панель Математика призначена для введення і редагування
математичних символів (Вид/Панели инструментов/Математика)
Огляд команд Mathcad
В Mathcad команду можна виконати трьома способами: через меню
команд, відповідними кнопками на панелях, за допомогою комбінації
клавіатурних клавіш.
1. Команда «Формат»
Уравнение… - створення й редагування стилю оформлення математичних
виразів.
Результат… - редагування стилю оформлення результатів обчислень
(точність, система вимірів і т.п.).
Выровнять области - вирівнювання областей по верхній або лівої межы.
2. Команда «Математика»
Вычислить – обчислення виражень, у випадку якщо відключений режим
автоматичних обчислень.
Просчитать Документ – перерахувати робочий аркуш. Звичайно
використовується у випадках, коли відключений режим автоматичних
обчислень.
Автоматическое вычисление – установка режиму автоматичних
обчислень.
Оптимизация – оптимізація виражень перед обчисленнями.
Параметри… - завдання властивостей змінних, обчислень, системи вимірів
і розмірності системи вимірів
3. Команда «Символи»
Расчеты – відображення результату символьних обчислень (символьний, із
плаваючою комою, з комплексним числом).
Упростить – спростити обране вираження, виконуючи арифметичні дії,
скорочуючи подібні, що складаються й використовуючи основні
тригонометричні тотожності.
12. 12
Расширить– розкладання всіх ступенів і добутків сум у математичних
виразах.
Фактор – розкладає на множники обраний вираз, якщо всі вирази можуть
бути записані у вигляді добутку співмножників.
Подобные – поєднує члени, що містять однакові ступені виділеного
підвиразу.
Змінні – дії щодо змінної (диференціювати, інтегрувати по змінній,
розв'язати щодо змінної
або замінити змінну).
Матрицы – символьні перетворення матричних виразів(транспонувати,
звернути, знайти визначник).
Преобразование – вибір виду перетворень (Фур'є, Лапласа й Z –
перетворення).
Стиль Вычислений… - відображення положення результатів обчислення
(вертикально, горизонтально й т.п.), відносно первісного виразу.
3.Створення текстових областей:
Клацніть у місці створення області.
Виберіть команду Вставка/Текстовая область.
Щоб покинути текстову область, клацніть поза нею. Не натискайте
Enter, це просто приведе до переходу на новий рядок усередині тексту.
КОНТРОЛЬНІ ЗАПИТАННЯ:
1. Призначення програми Mathcad.
2. Що є основним документом Mathcad.
3. Які області можуть утворювати робочий документ Mathcad.
4. Яким чином можна викликати команду Mathcad?
5. Основні етапи введення і редагування математичних виразів.
6. Функція ROOT. Призначення, правила застосування.
7. Функція FIND. Призначення, правила застосування.
8. Функція MINNER. Призначення, правила застосування.
9. Правила побудови графіків функцій.
![2
3 456
.
0
2
.
1
126
26
.
2
5
.
0 4
6 8 4
26
.
3
26
.
12
25
.
0
IV. Обчислити значення виразу при заданих значеннях змінних:
№
варіанта
Змінні Вираз
а b с X
1 2.23 0.45 3.25 0.123
c
bx
e
a x
cos
2 0.23 135 0.36 0.231 c
x
bc
a
)
sin
cos(
3 1.23 0.68 136 1.235
1
sin
x
c
b
a
4 2.36 0.56 3.65 1.365 3 sin b
c
tgx
a
5 0.36 1.23 5.26 0.236
3 35
.
0
2
2
1
ac
x
e
a
bx
ax
6 2.65 3.23 1.25 0.254
bx
c
x
a
x
ln
sin
1
sin
2
3
V. Обчислити вираз при заданих дискретних значеннях змінних.
Дискретна змінна вводиться у форматі:
var:=початкове значення, [початкове значення+крок] .. кінцеве значення
у дужках зазначений необов'язковий параметр, за
замовчуванням крок рівний 1. Двокрапка ".." вводиться клавішею
c
b
a
b
x
a
x 2
2
2
2
a:=0.8 c:=1.35
b:=-3.2
x:=2, 2.1..4](data:image/gif;base64,R0lGODlhAQABAIAAAAAAAP///yH5BAEAAAAALAAAAAABAAEAAAIBRAA7)