Download as PDF, PPTX


![Sample Implementation with sklearn
Output3
4
5
6
7
8
9
10
11
12
13
14
15
16
# Principal Component Analysis
from numpy import array
from sklearn.decomposition import PCA
# define a matrix
A = array([[1, 2], [3, 4], [5, 6]])
print(A)
# create the PCA instance
pca = PCA(2)
# fit on data
pca.fit(A)
# access values and vectors ie.covariance
matrix
print(pca.components_)
print(pca.explained_variance_)
# transform data
B = pca.transform(A)
print(B)
[[1 2][3 4][5 6]]
[[ 0.70710678 0.70710678]
[ 0.70710678 -0.70710678]]
[ 8.00000000e+00 2.25080839e-33]
[[ -2.82842712e+00 2.22044605e-16]
[ 0.00000000e+00 0.00000000e+00]
[ 2.82842712e+00
-2.22044605e-16]]](https://image.slidesharecdn.com/principalcomponentanalysisandlda-190302090514/75/Principal-component-analysis-and-lda-18-2048.jpg)
![References
● LDA and PCA for dimensionality reduction
[https://sebastianraschka.com/faq/docs/lda-vs-pca.html]
● A. M. Martinez and A. C. Kak, "PCA versus LDA," in IEEE Transactions on
Pattern Analysis and Machine Intelligence, vol. 23, no. 2, pp. 228-233, Feb.
2001.
● Principal Component Analysis
[http://setosa.io/ev/principal-component-analysis/]](https://image.slidesharecdn.com/principalcomponentanalysisandlda-190302090514/75/Principal-component-analysis-and-lda-34-2048.jpg)
![References (contd...)
● Introduction to Principal Components and Factor Analysis
[ftp://statgen.ncsu.edu/pub/thorne/molevoclass/AtchleyOct19.pdf]
● Introduction to PCA
[https://www.dezyre.com/data-science-in-python-tutorial/principal-component-a
nalysis-tutorial]
● Linear Discriminant Analysis - A Brief Analysis
[http://www.sthda.com/english/wiki/print.php?id=206]](https://image.slidesharecdn.com/principalcomponentanalysisandlda-190302090514/75/Principal-component-analysis-and-lda-35-2048.jpg)


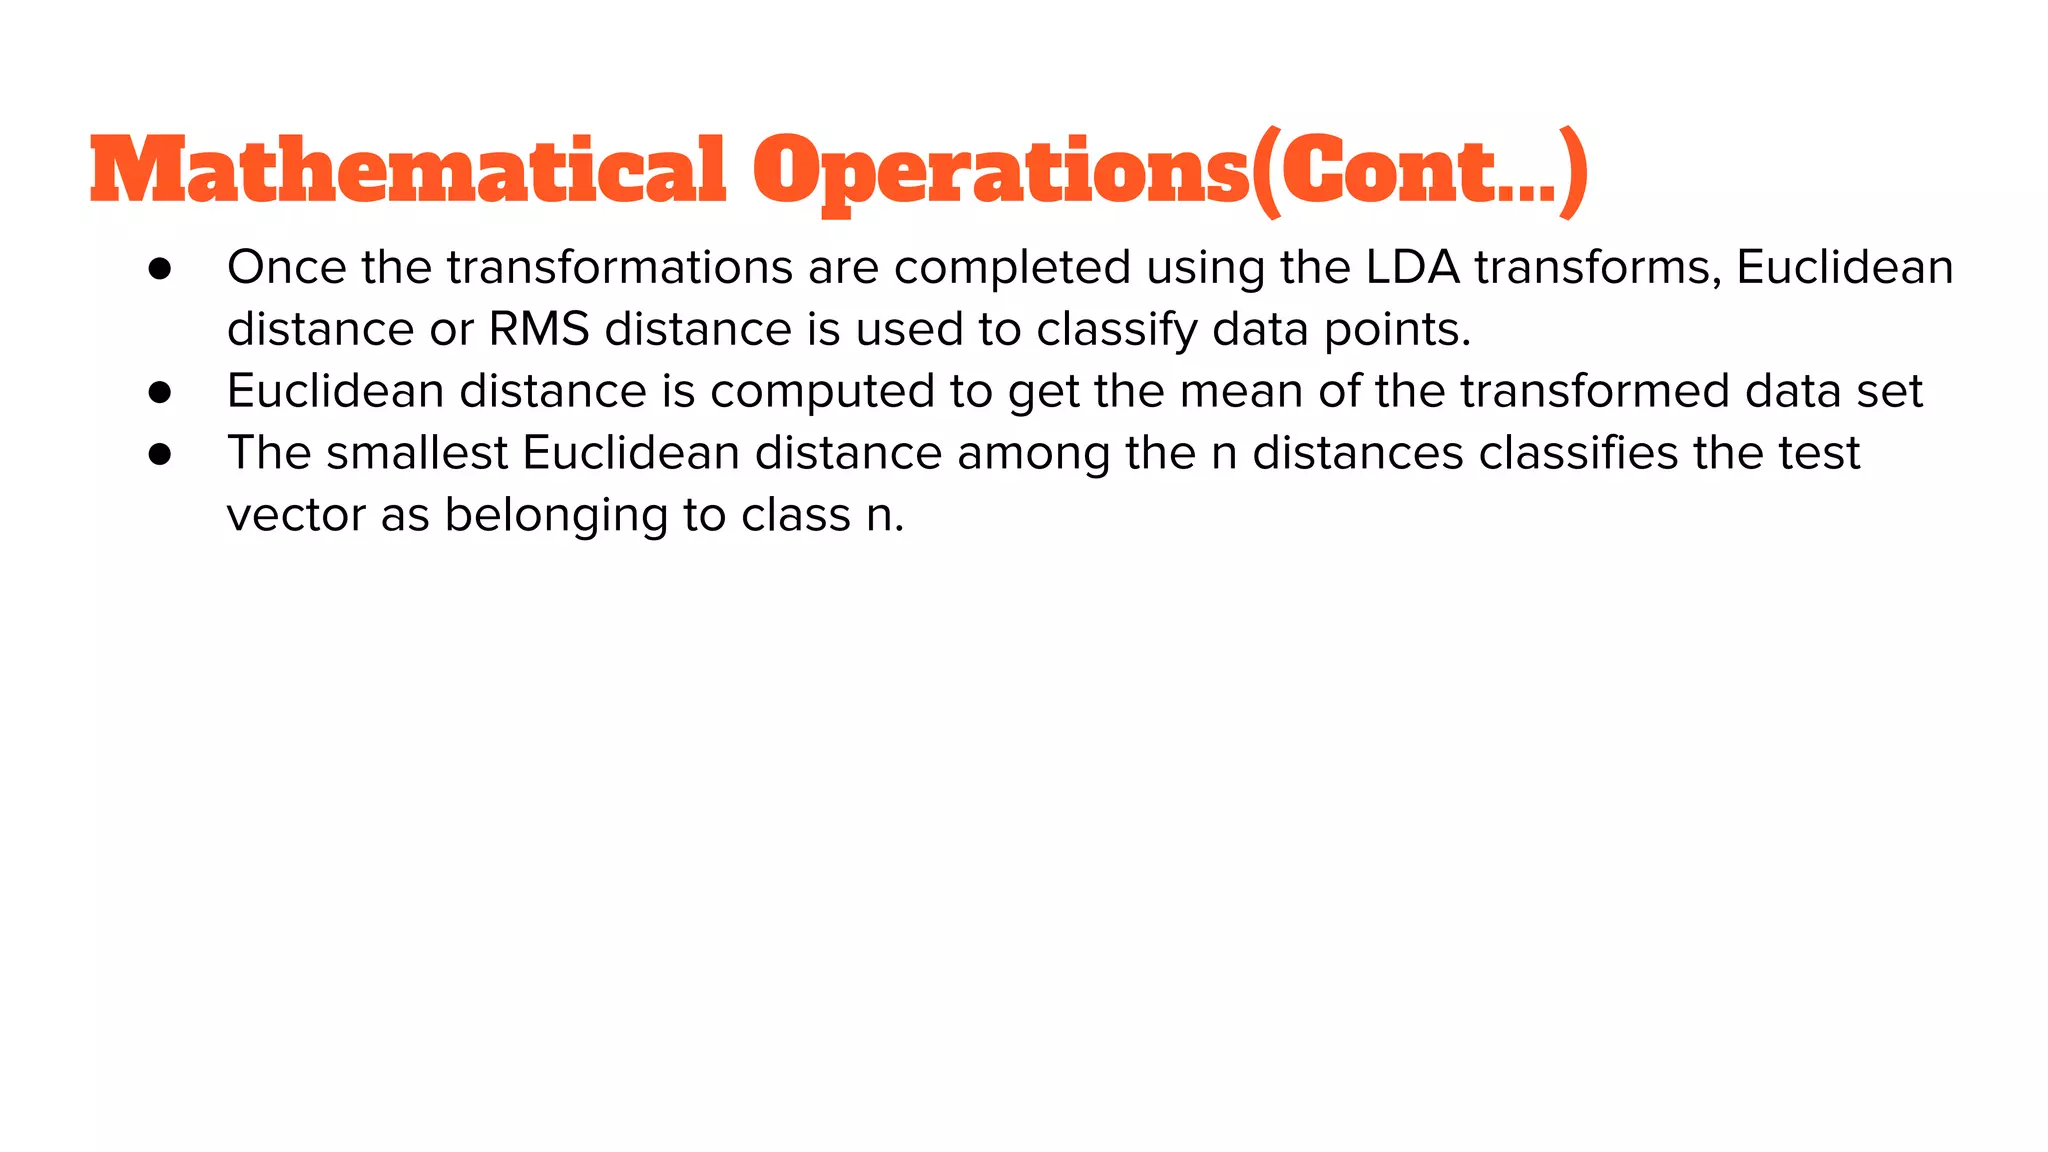
PCA and LDA are dimensionality reduction techniques. PCA transforms variables into uncorrelated principal components while maximizing variance. It is unsupervised. LDA finds axes that maximize separation between classes while minimizing within-class variance. It is supervised and finds axes that separate classes well. The document provides mathematical explanations of how PCA and LDA work including calculating covariance matrices, eigenvalues, eigenvectors, and transformations.
Presentation on Principal Component Analysis (PCA) and Linear Discriminant Analysis (LDA) by authors.
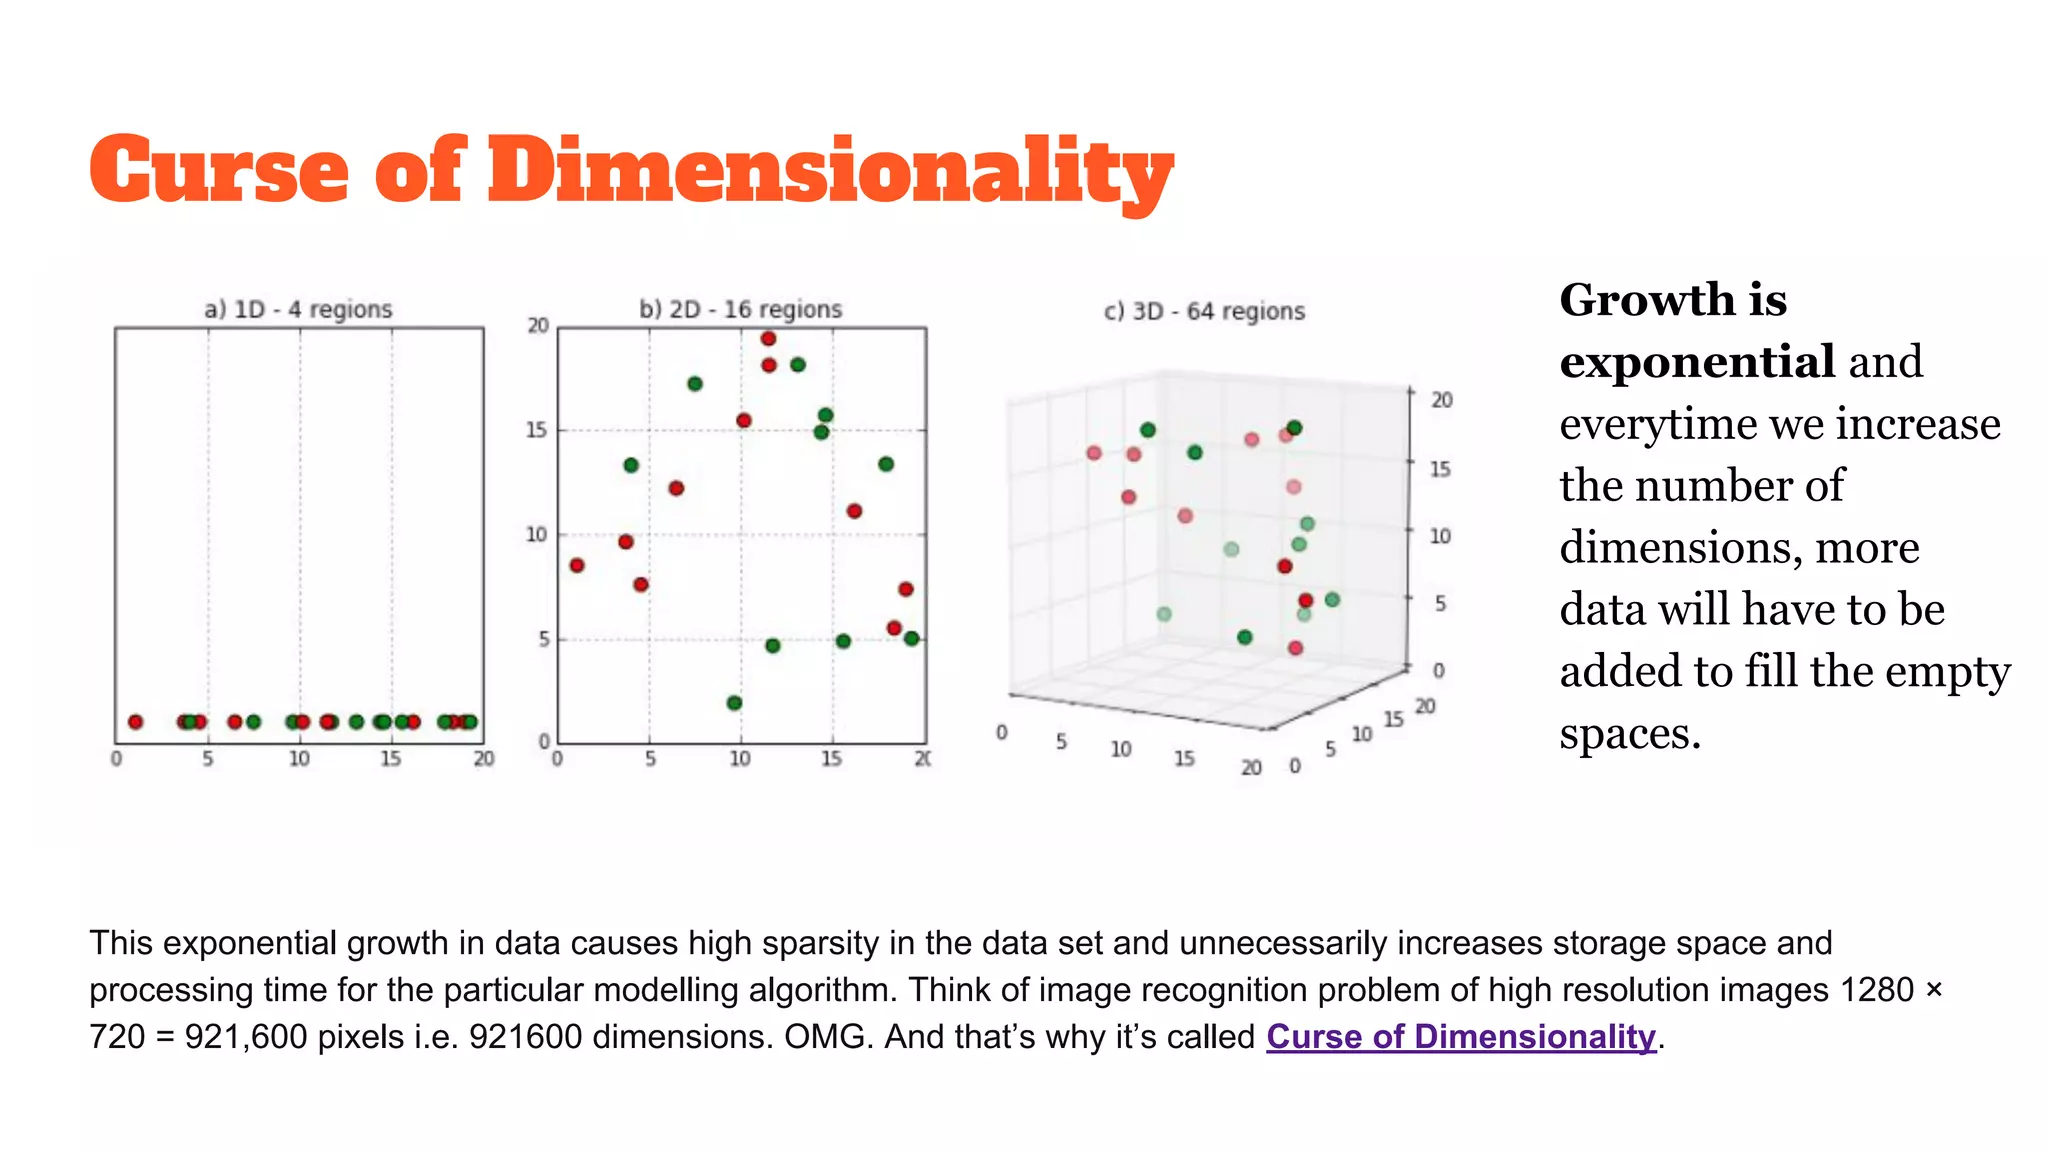
Describes the exponential growth in data dimensions leading to sparsity and increased processing time, referred to as the Curse of Dimensionality.
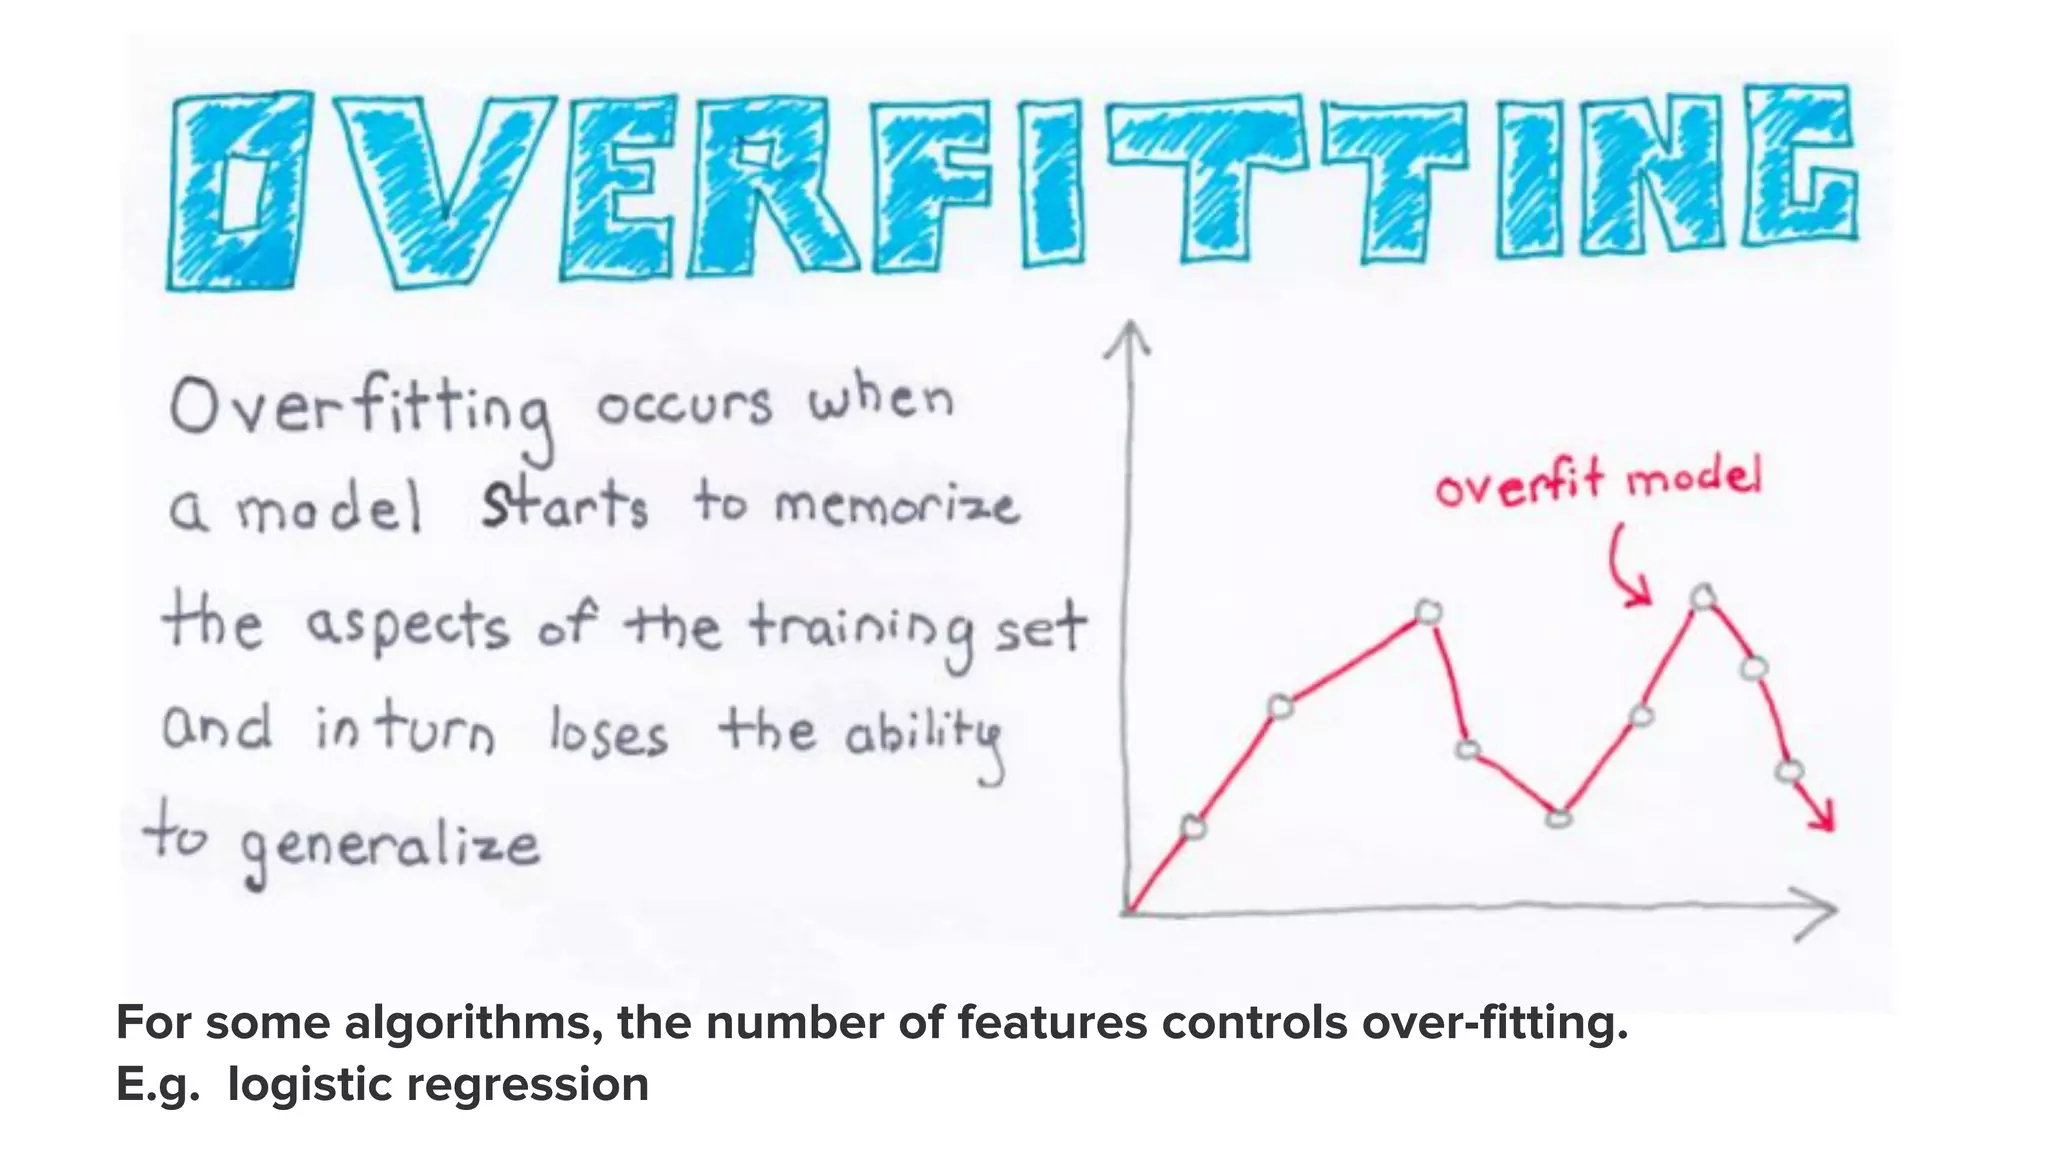
Highlights the significance of the number of features in preventing overfitting, specifically mentioning logistic regression.
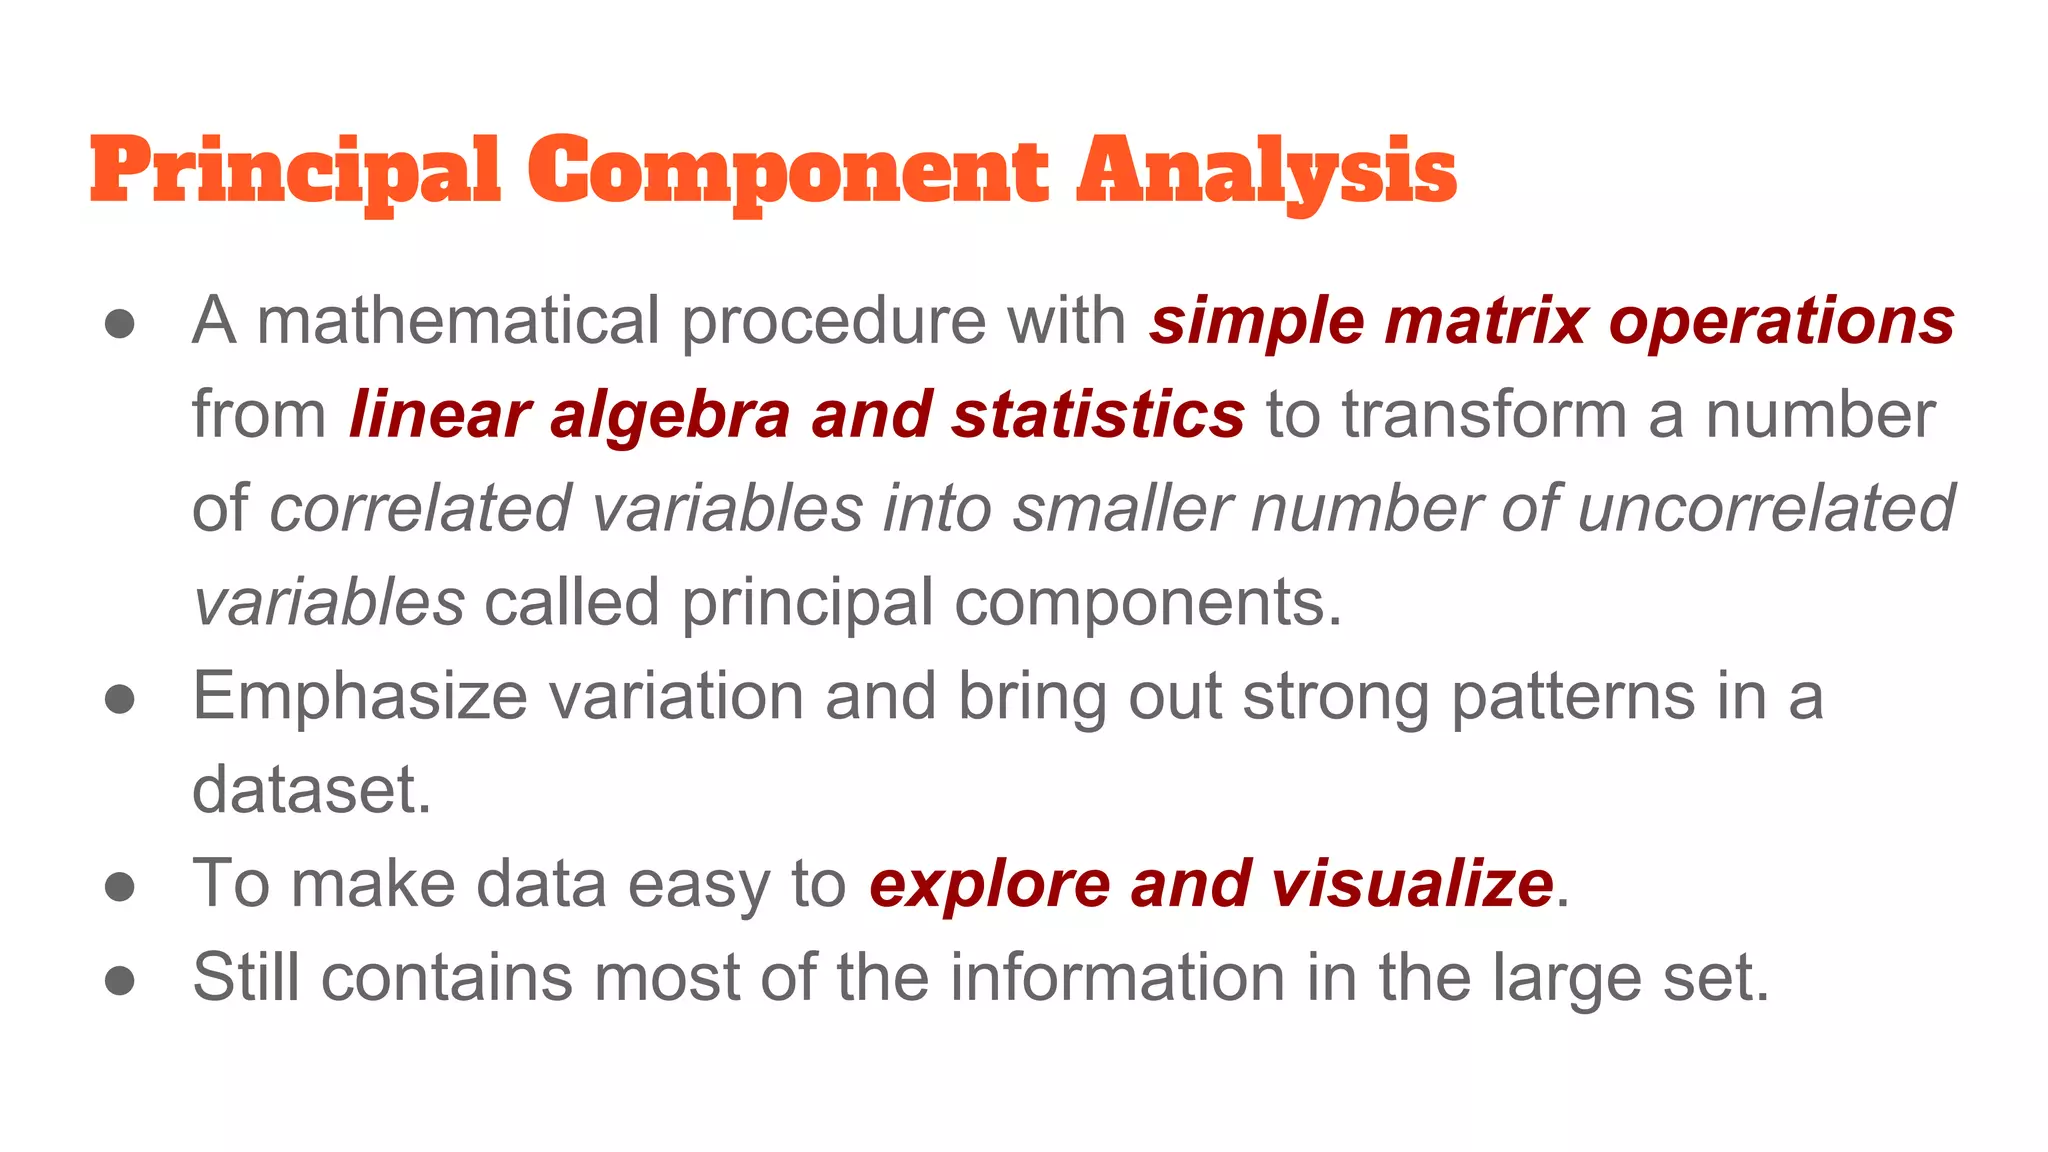
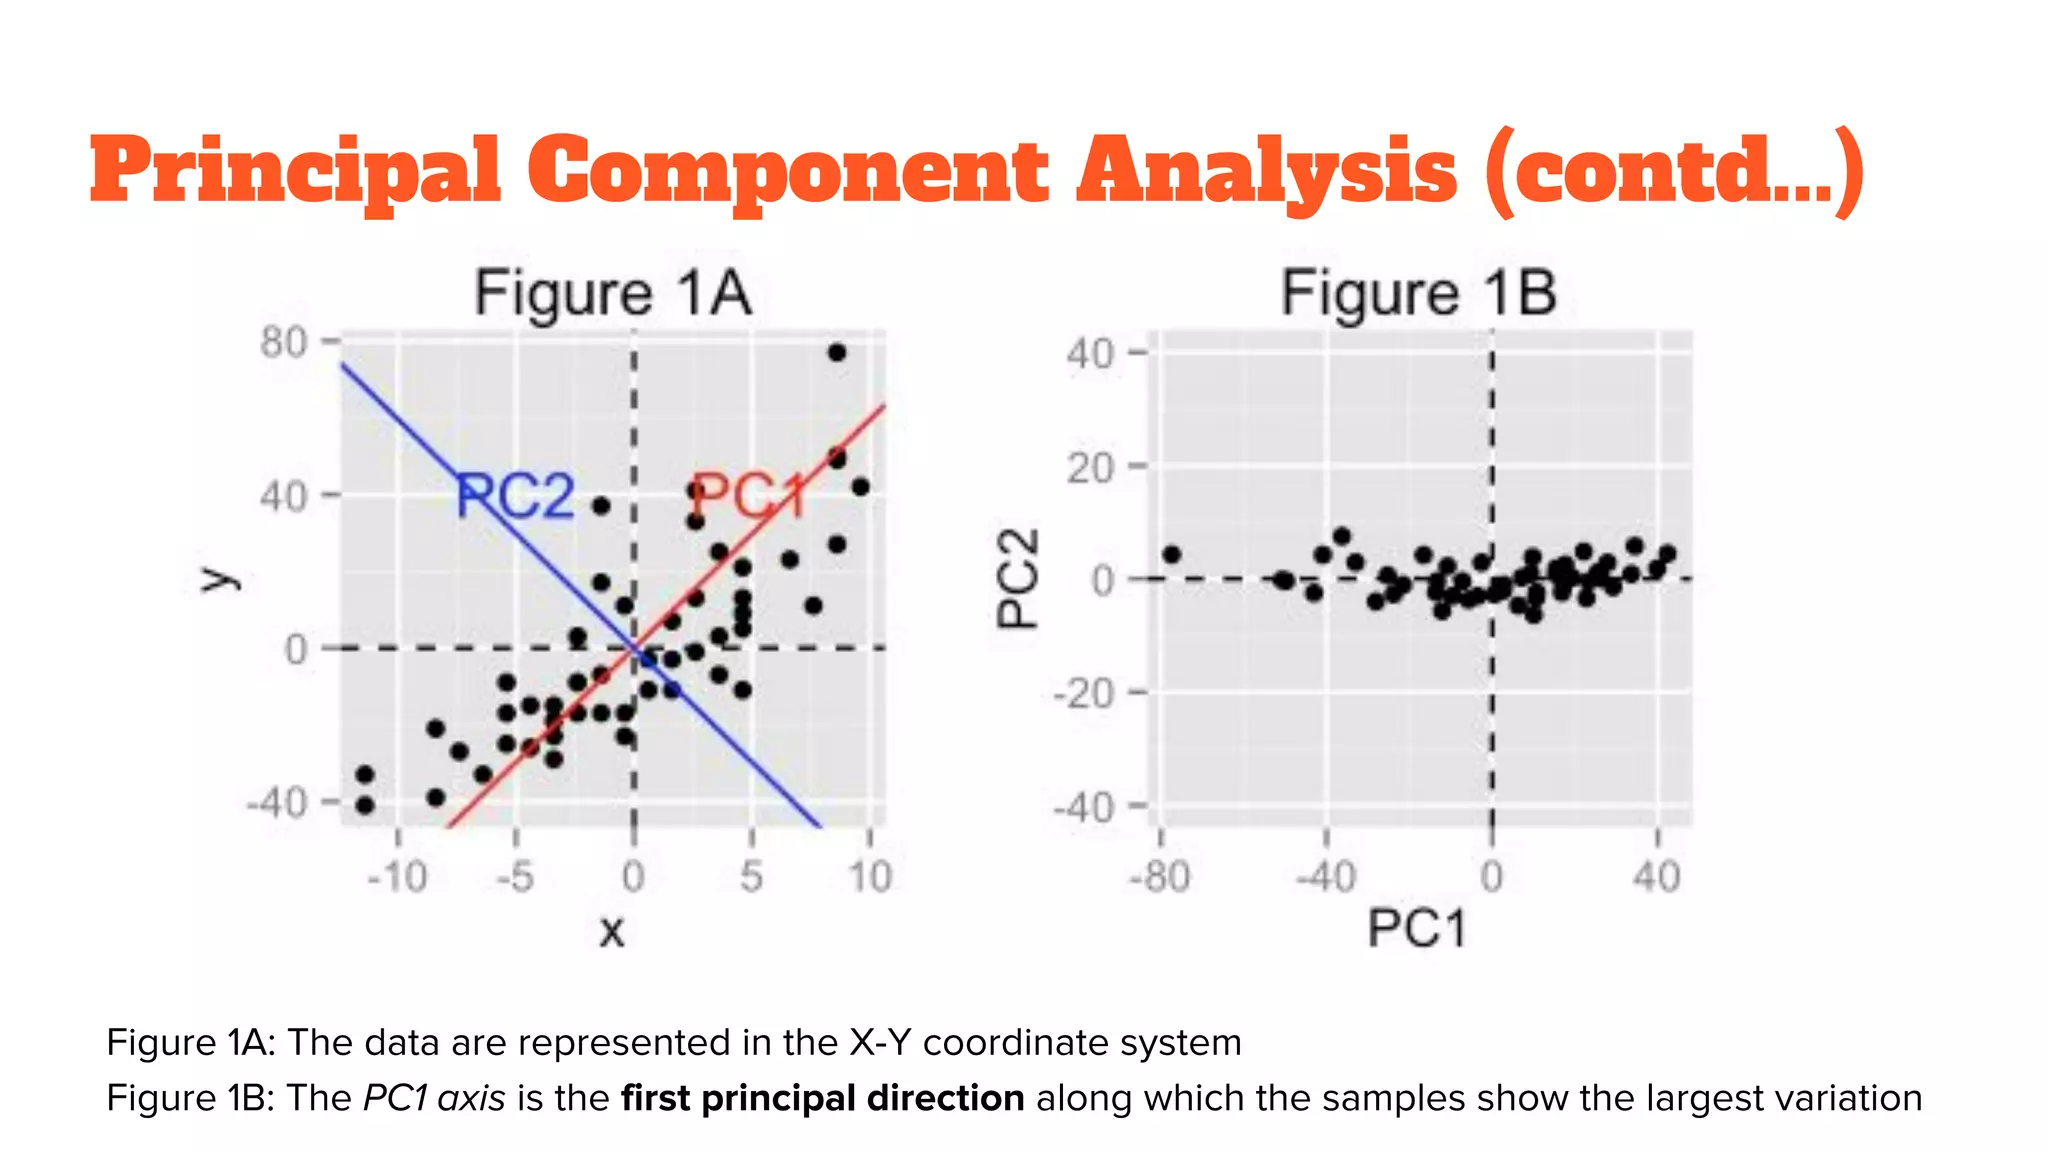
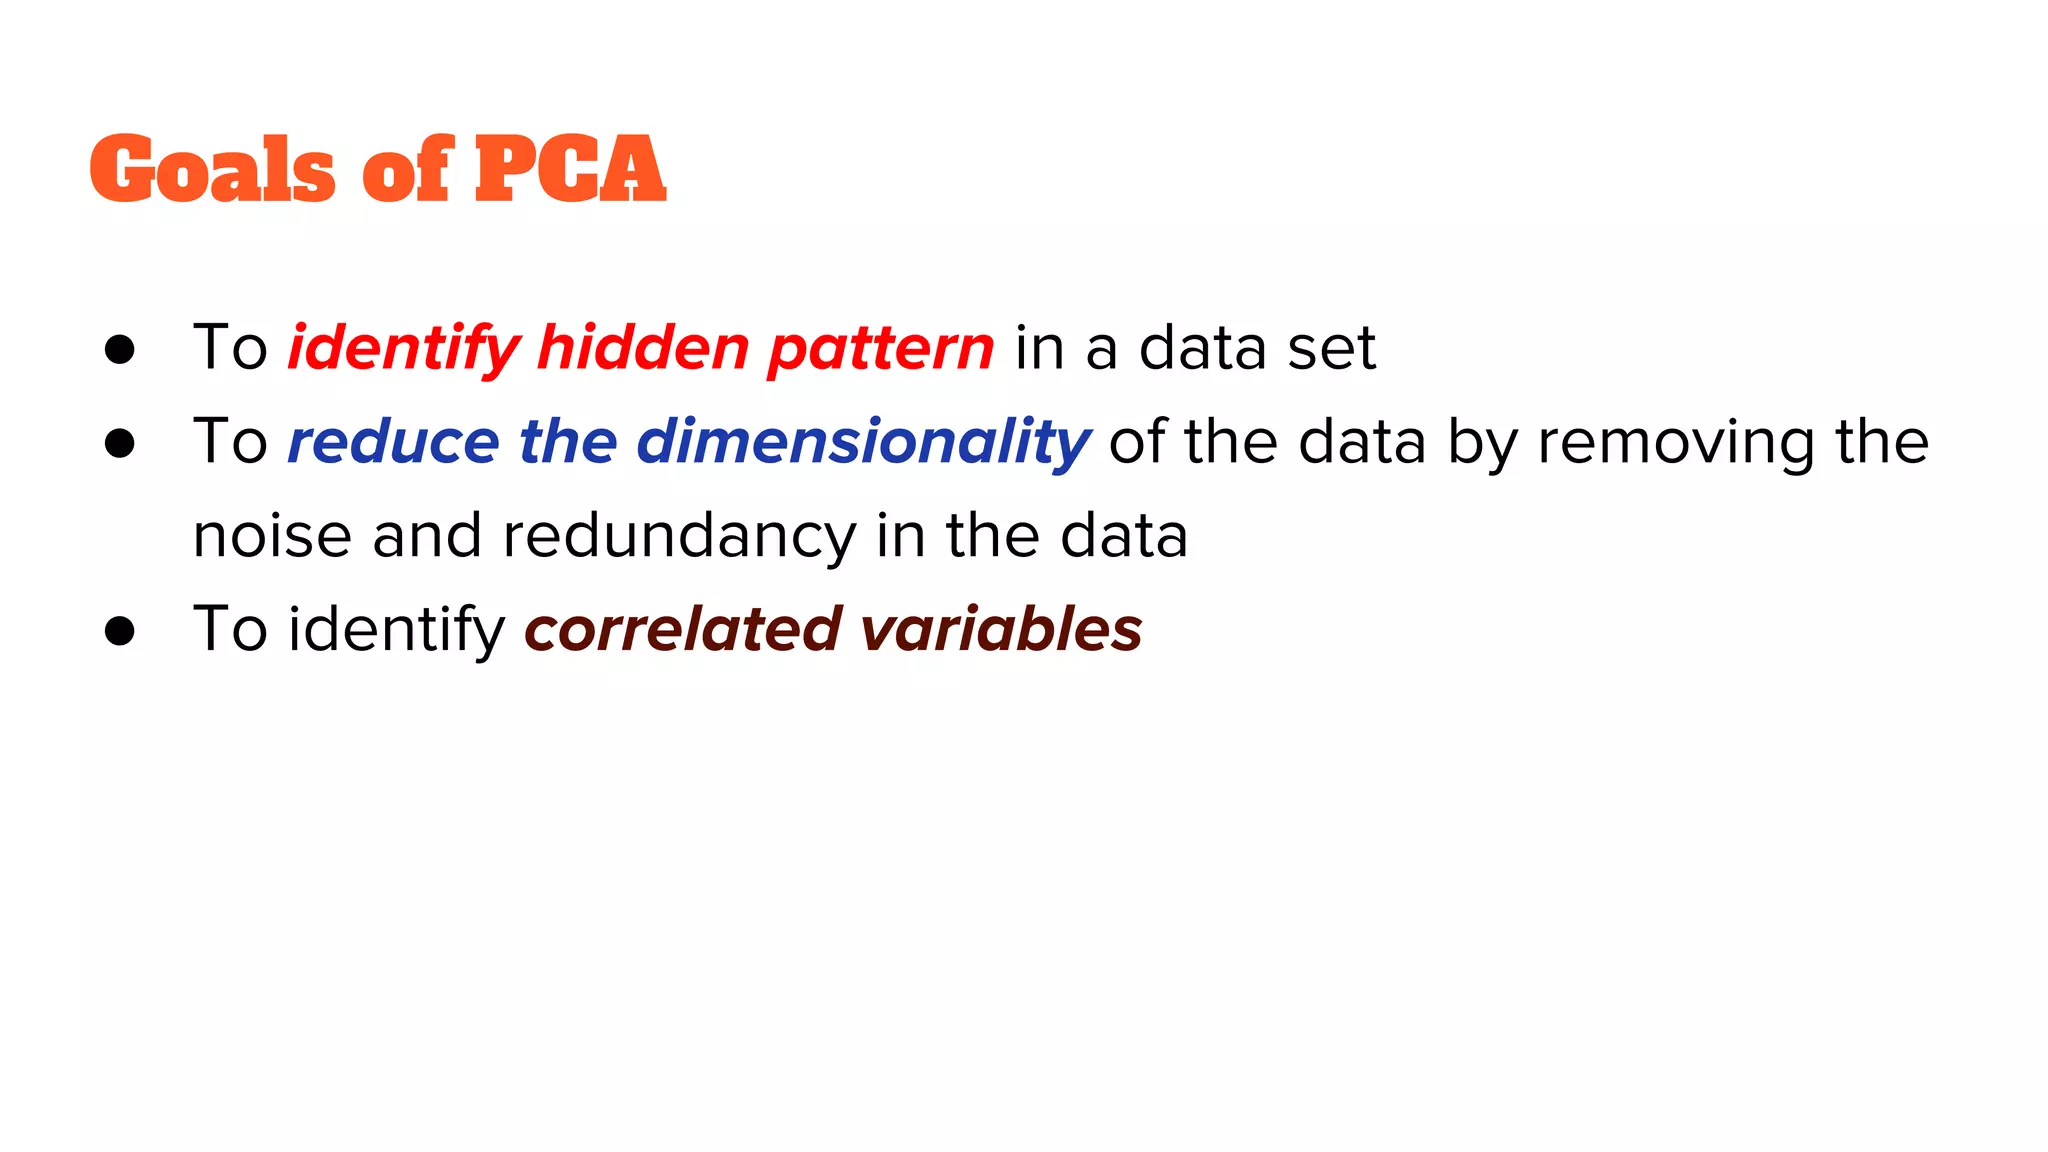
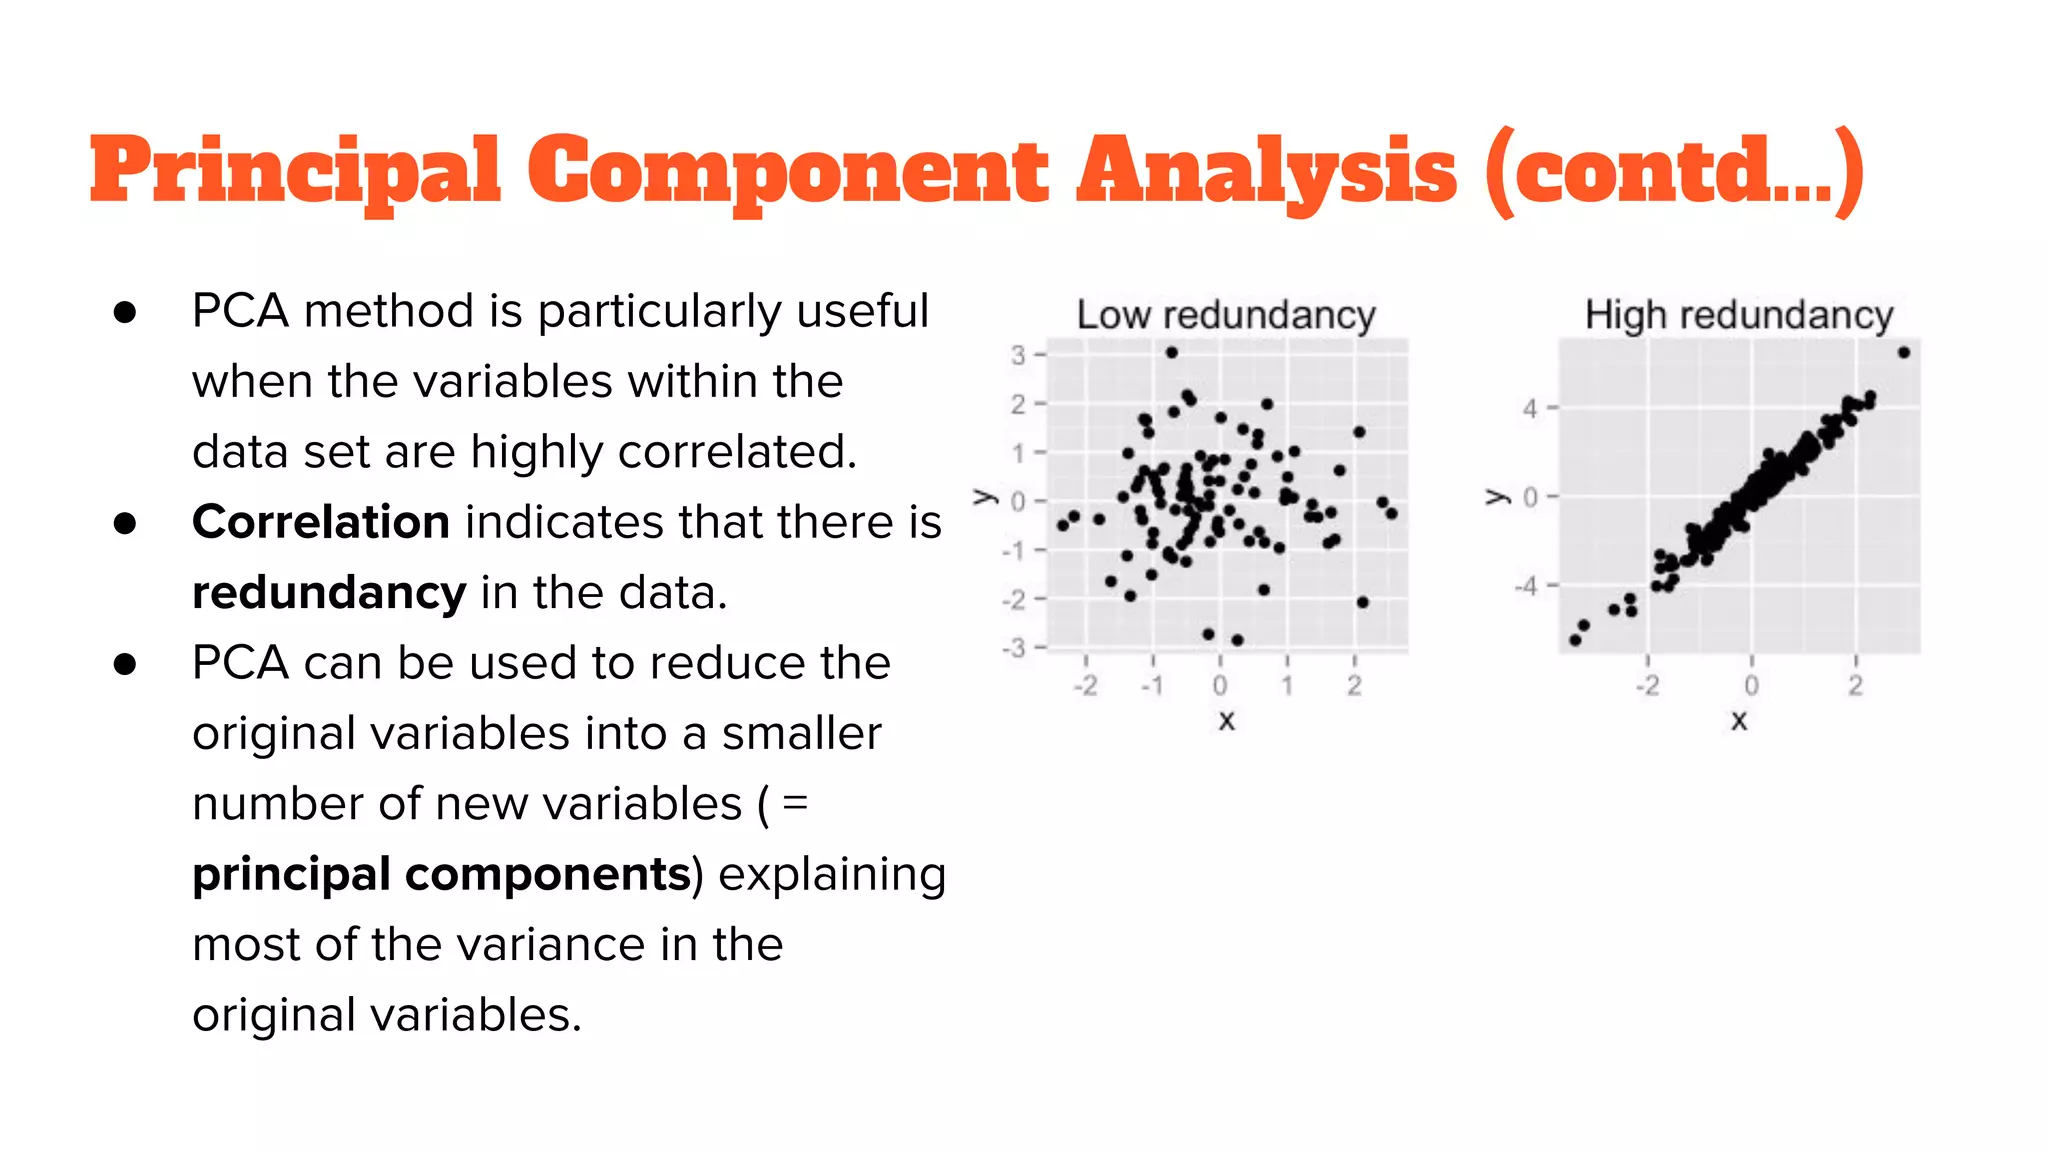
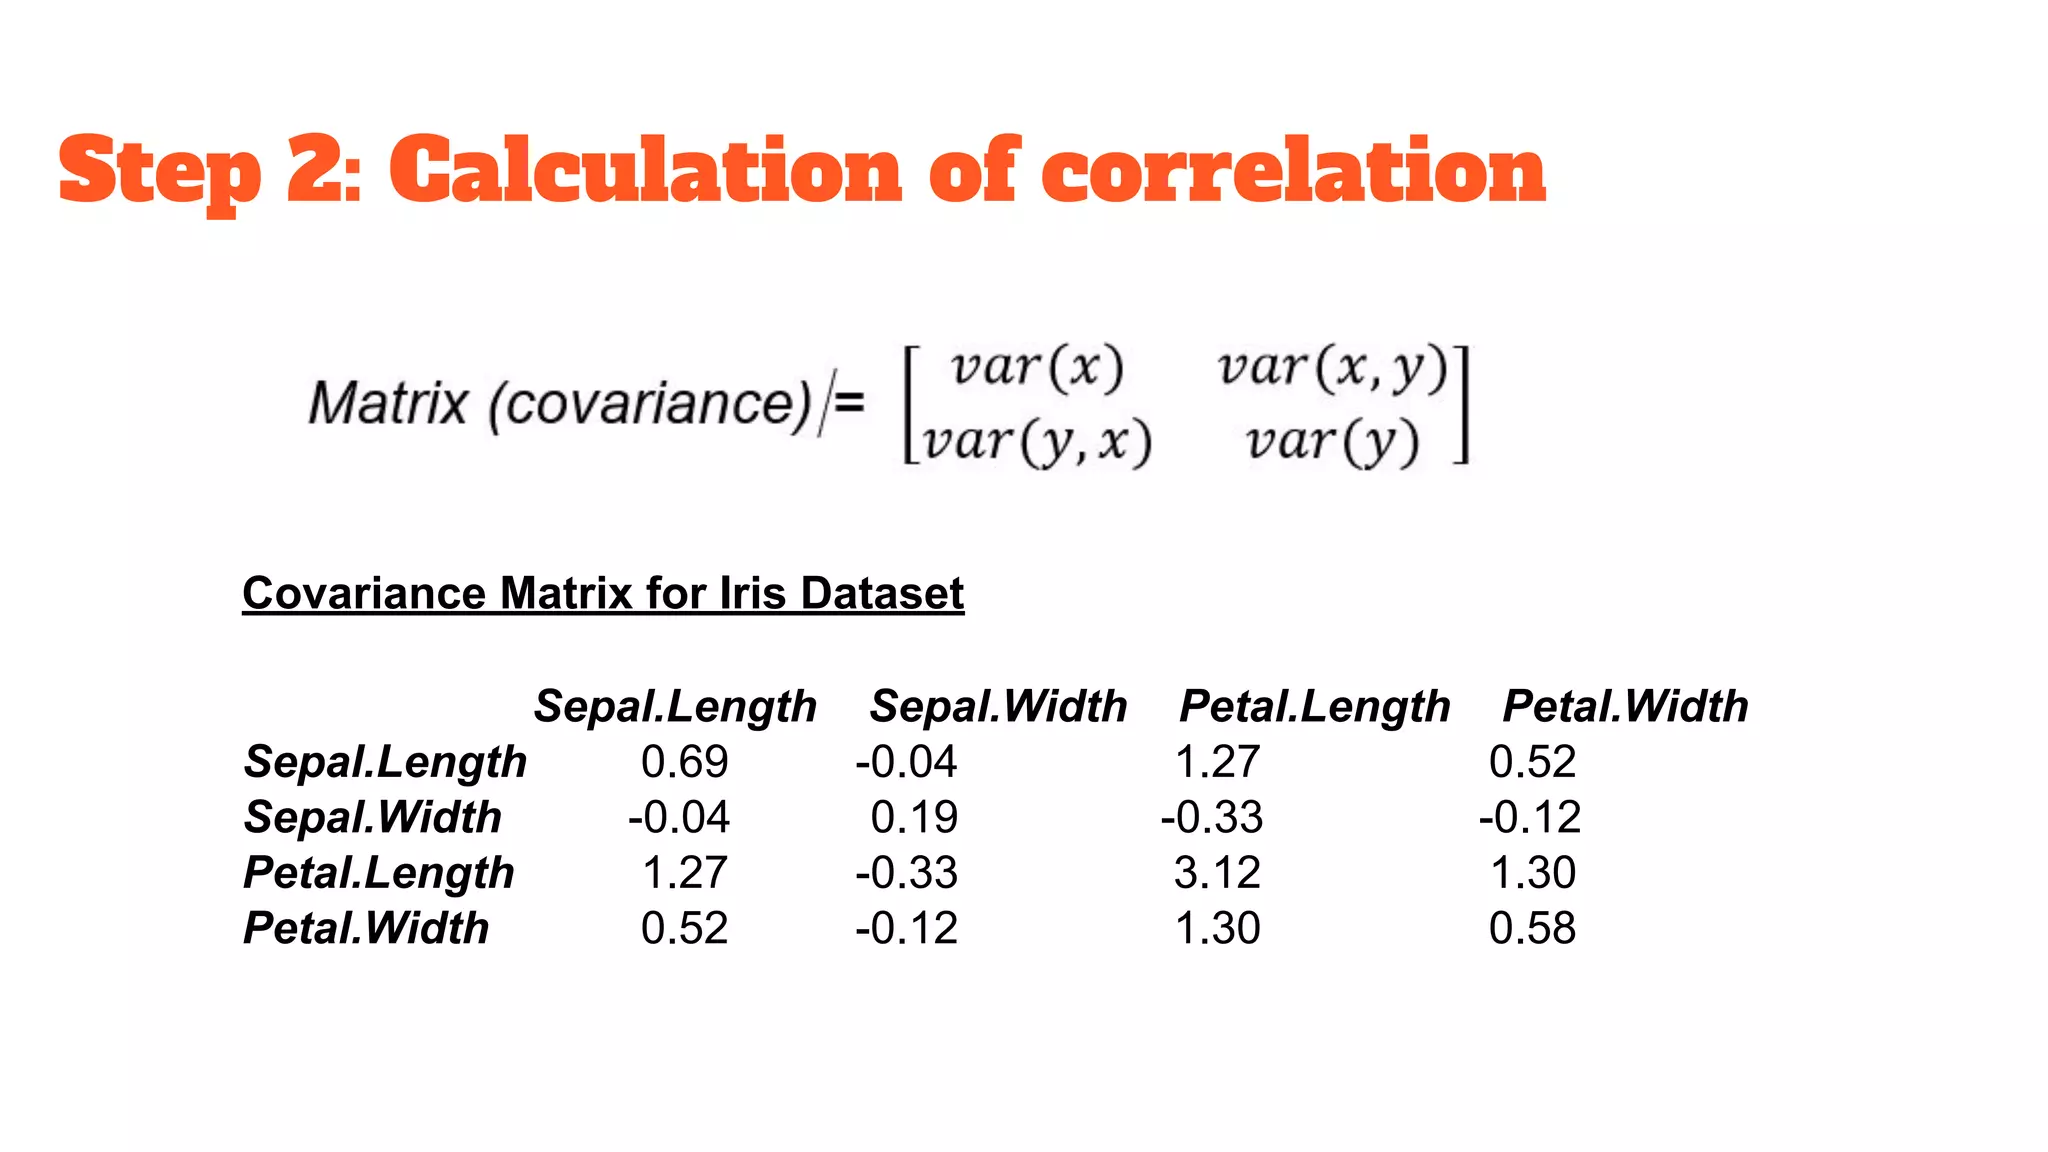
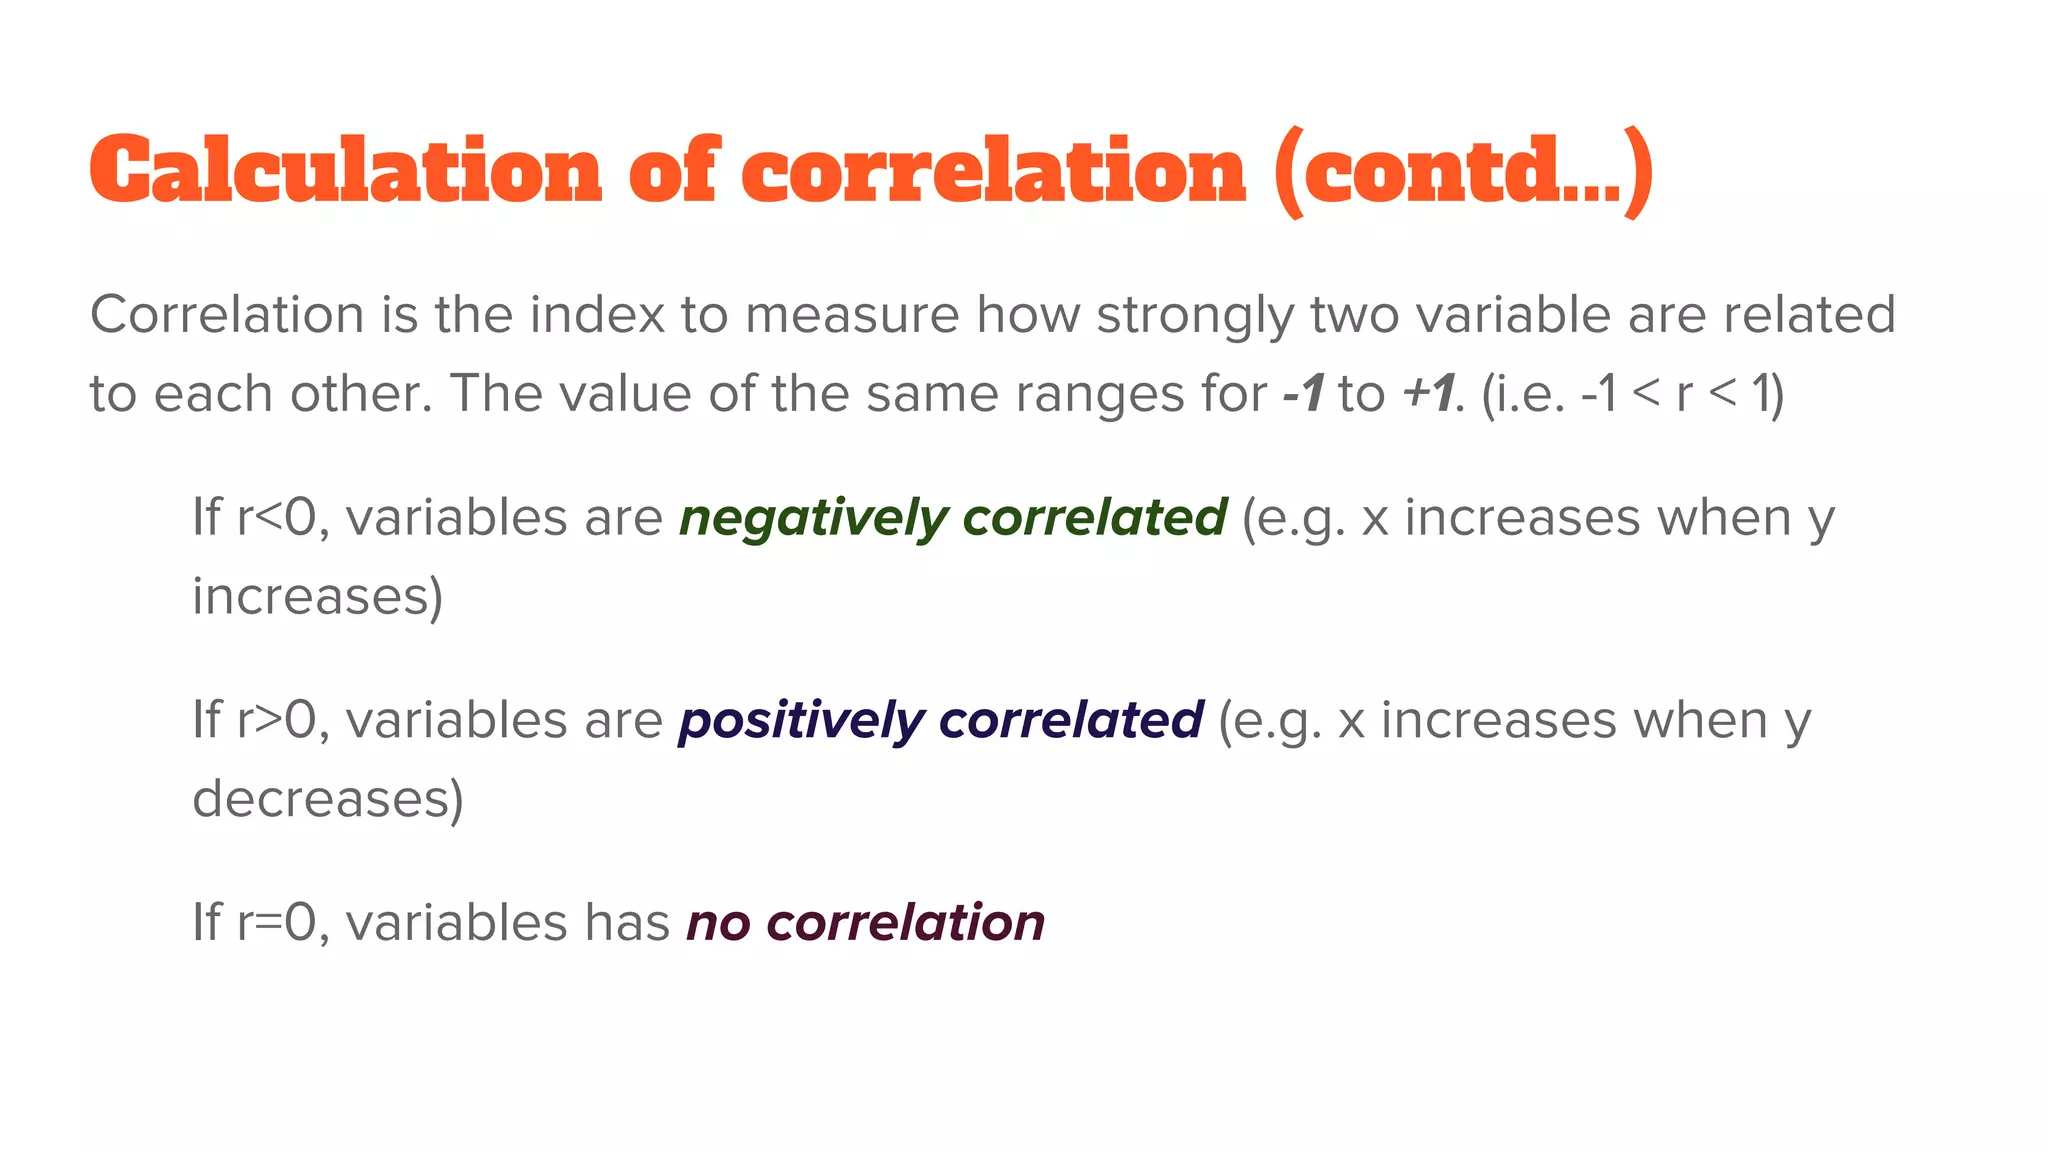
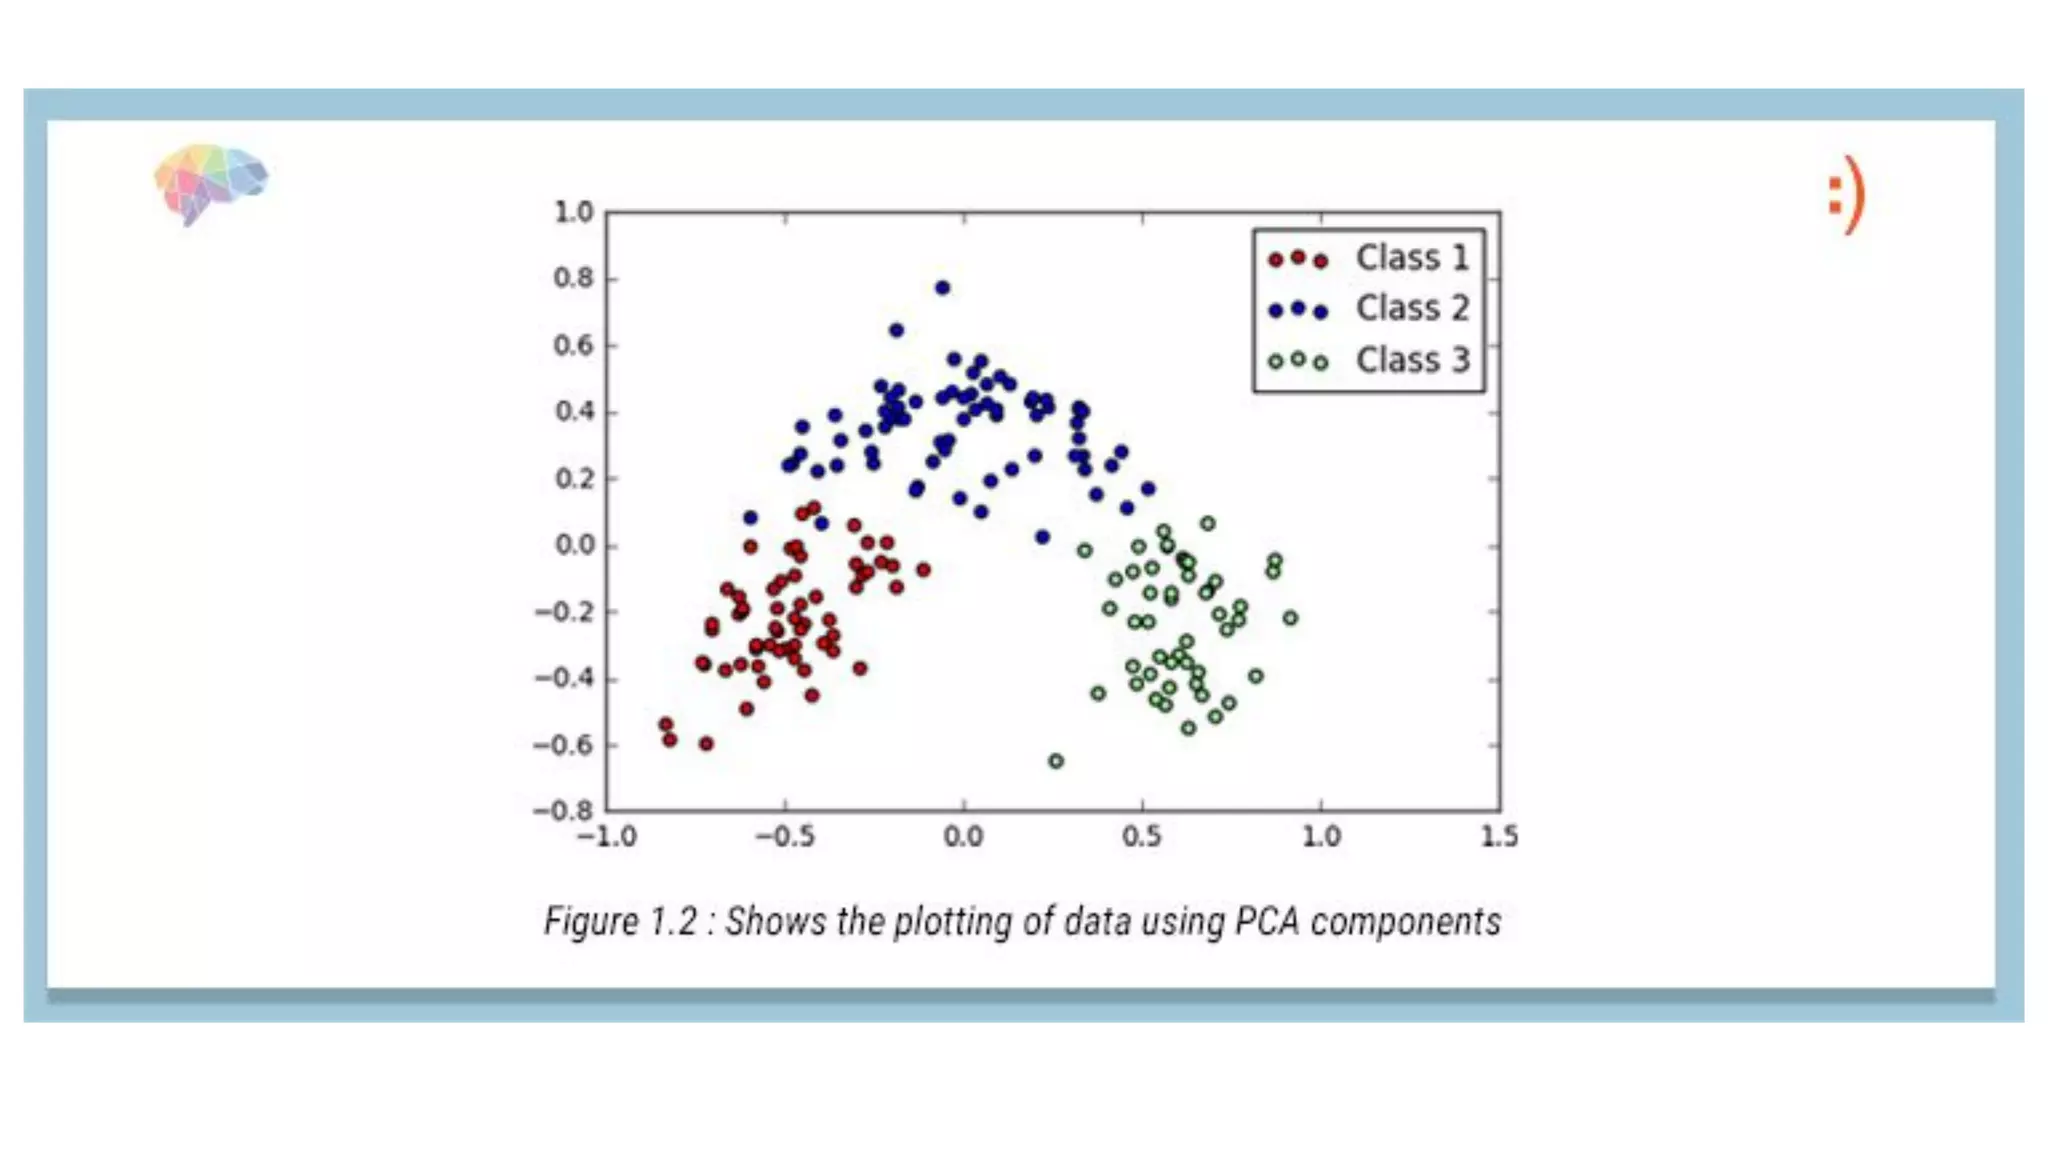
PCA involves transforming correlated variables into uncorrelated principal components, reducing dimensionality and preserving data variance.
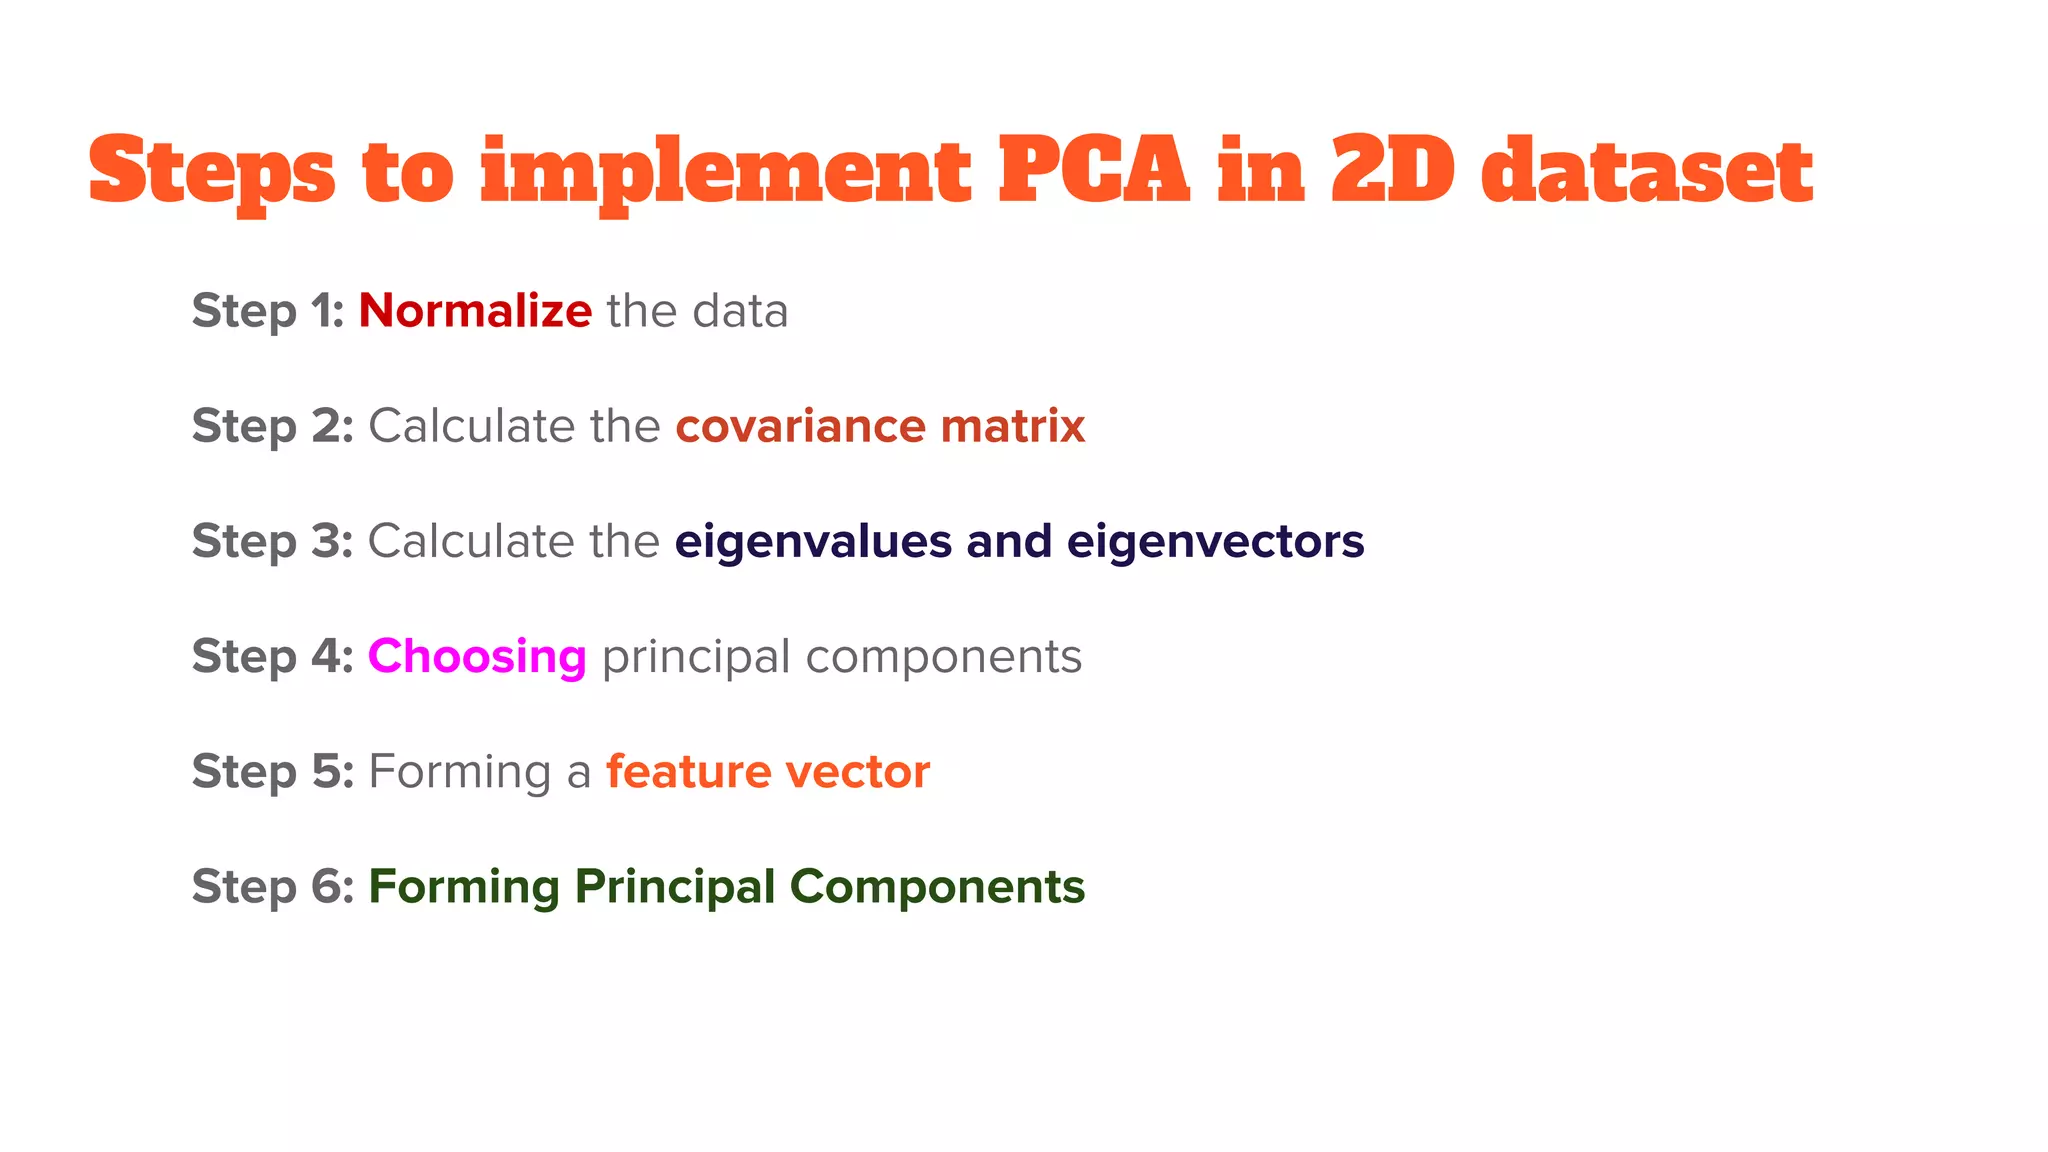
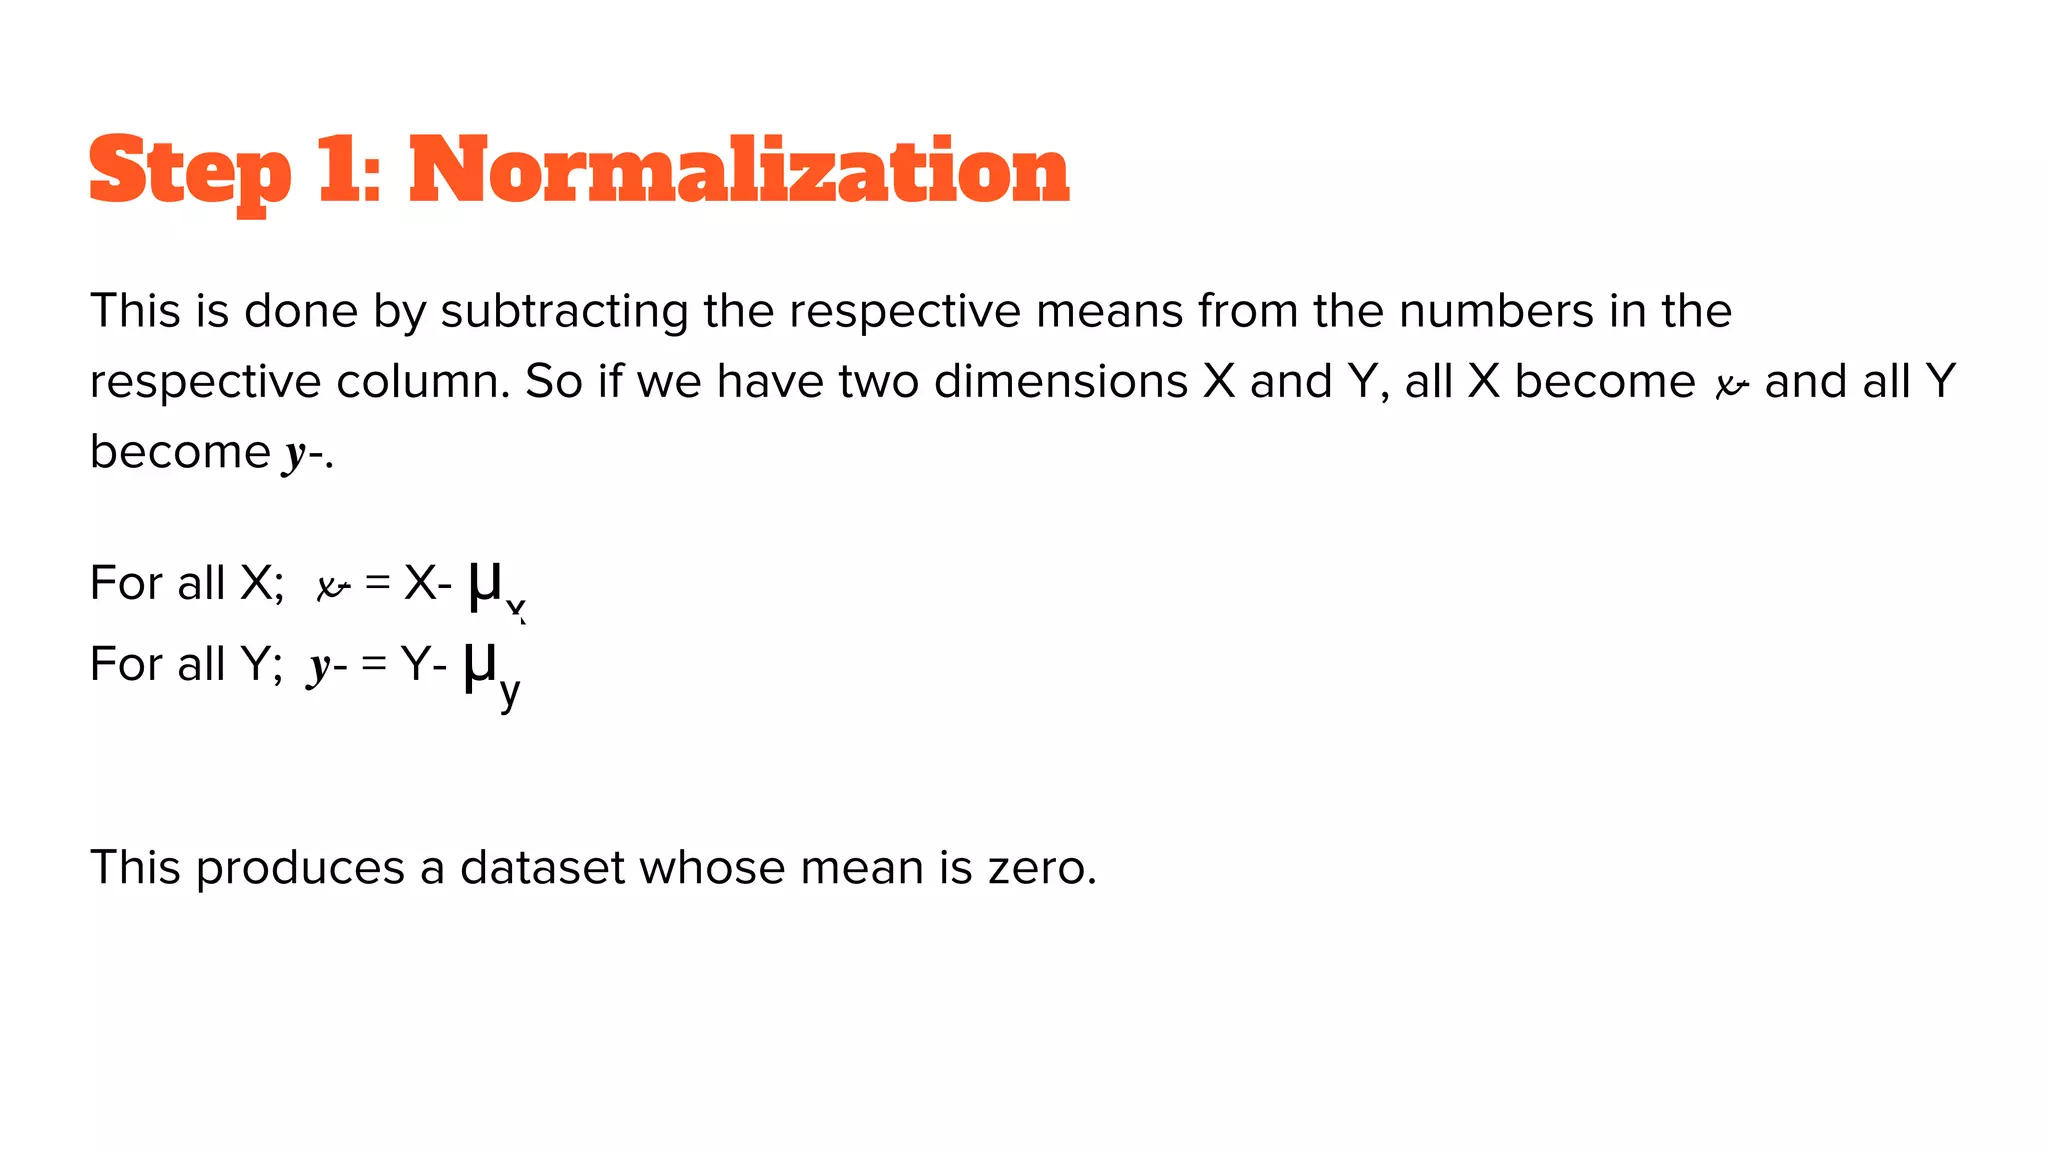
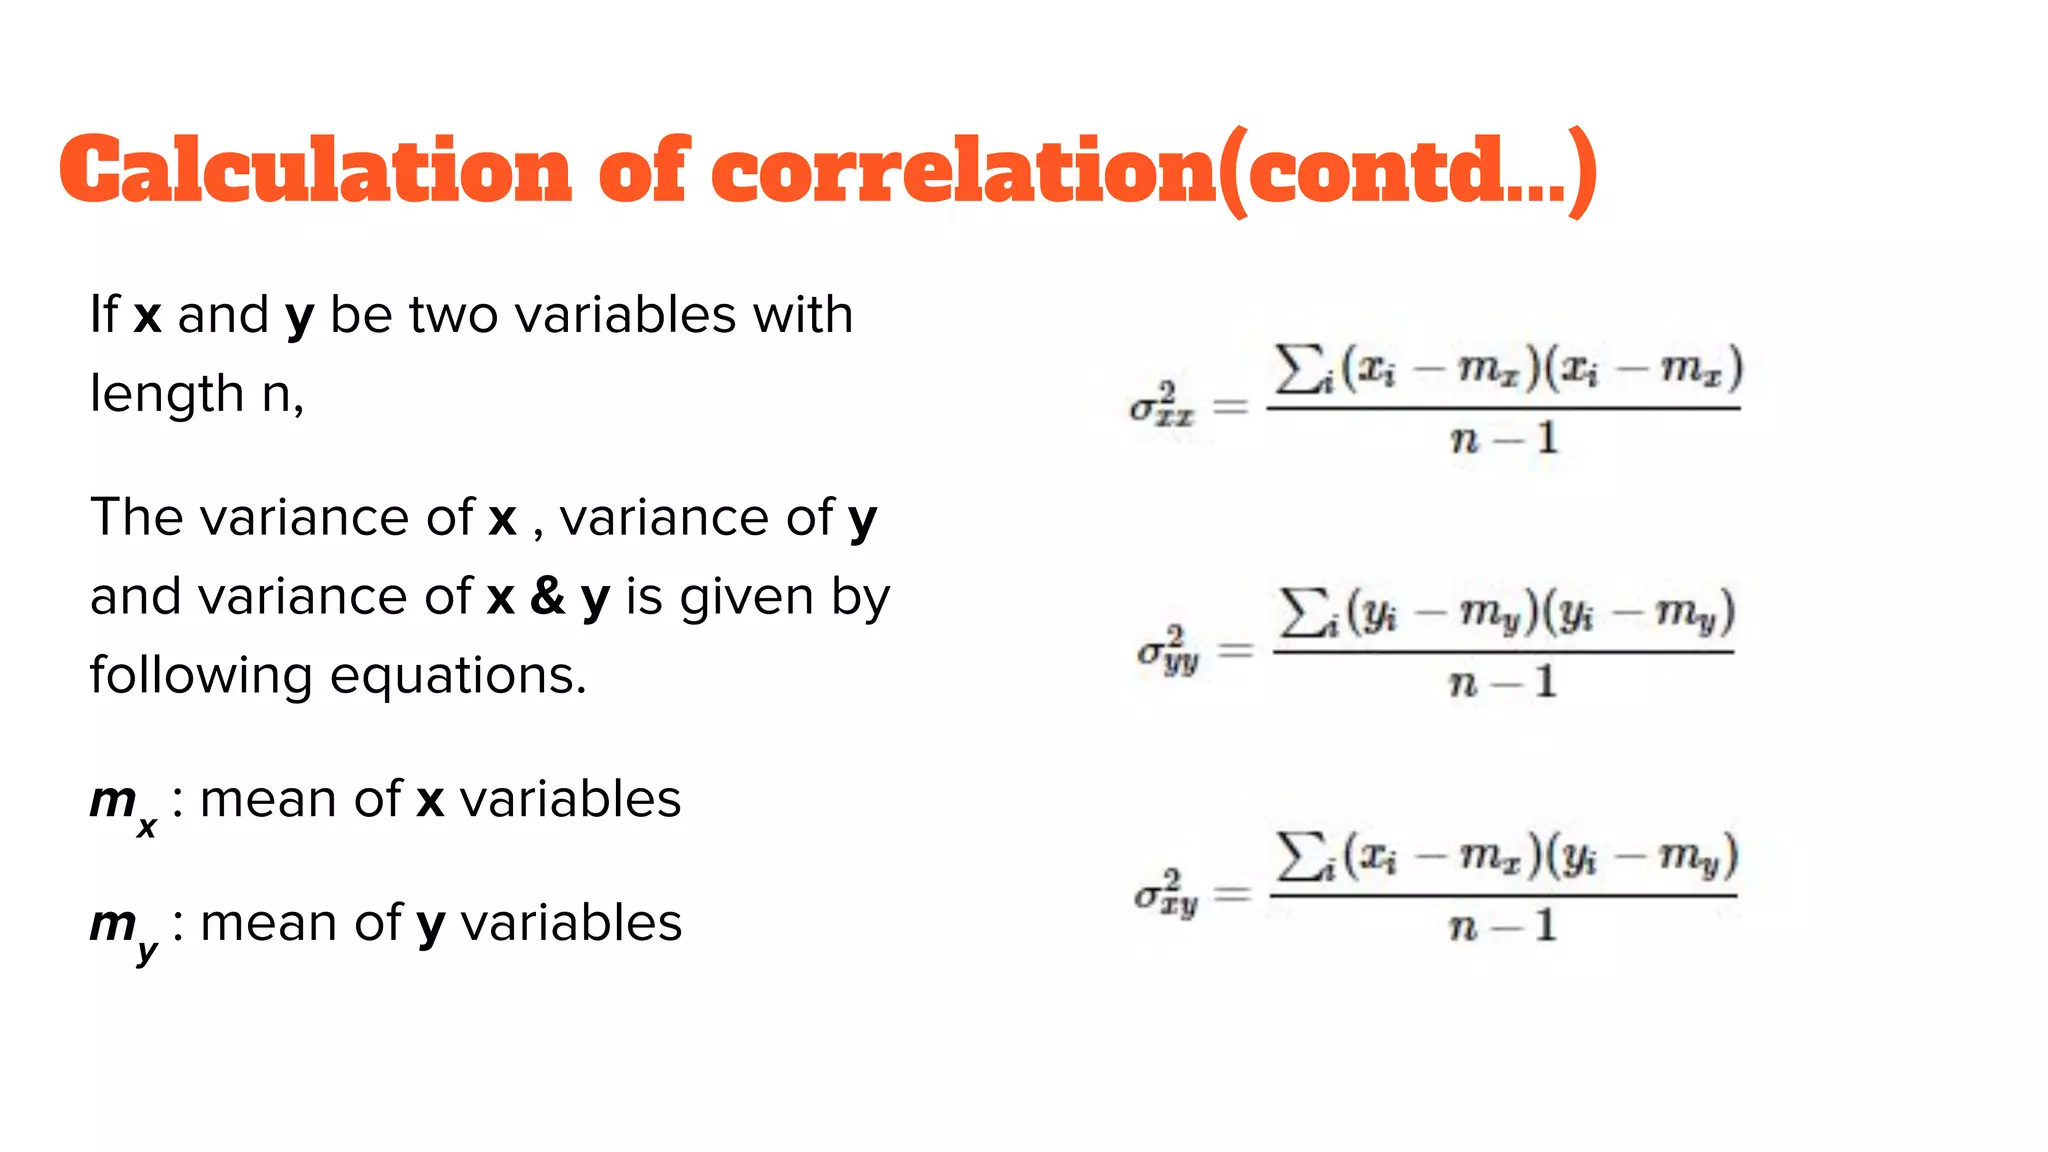
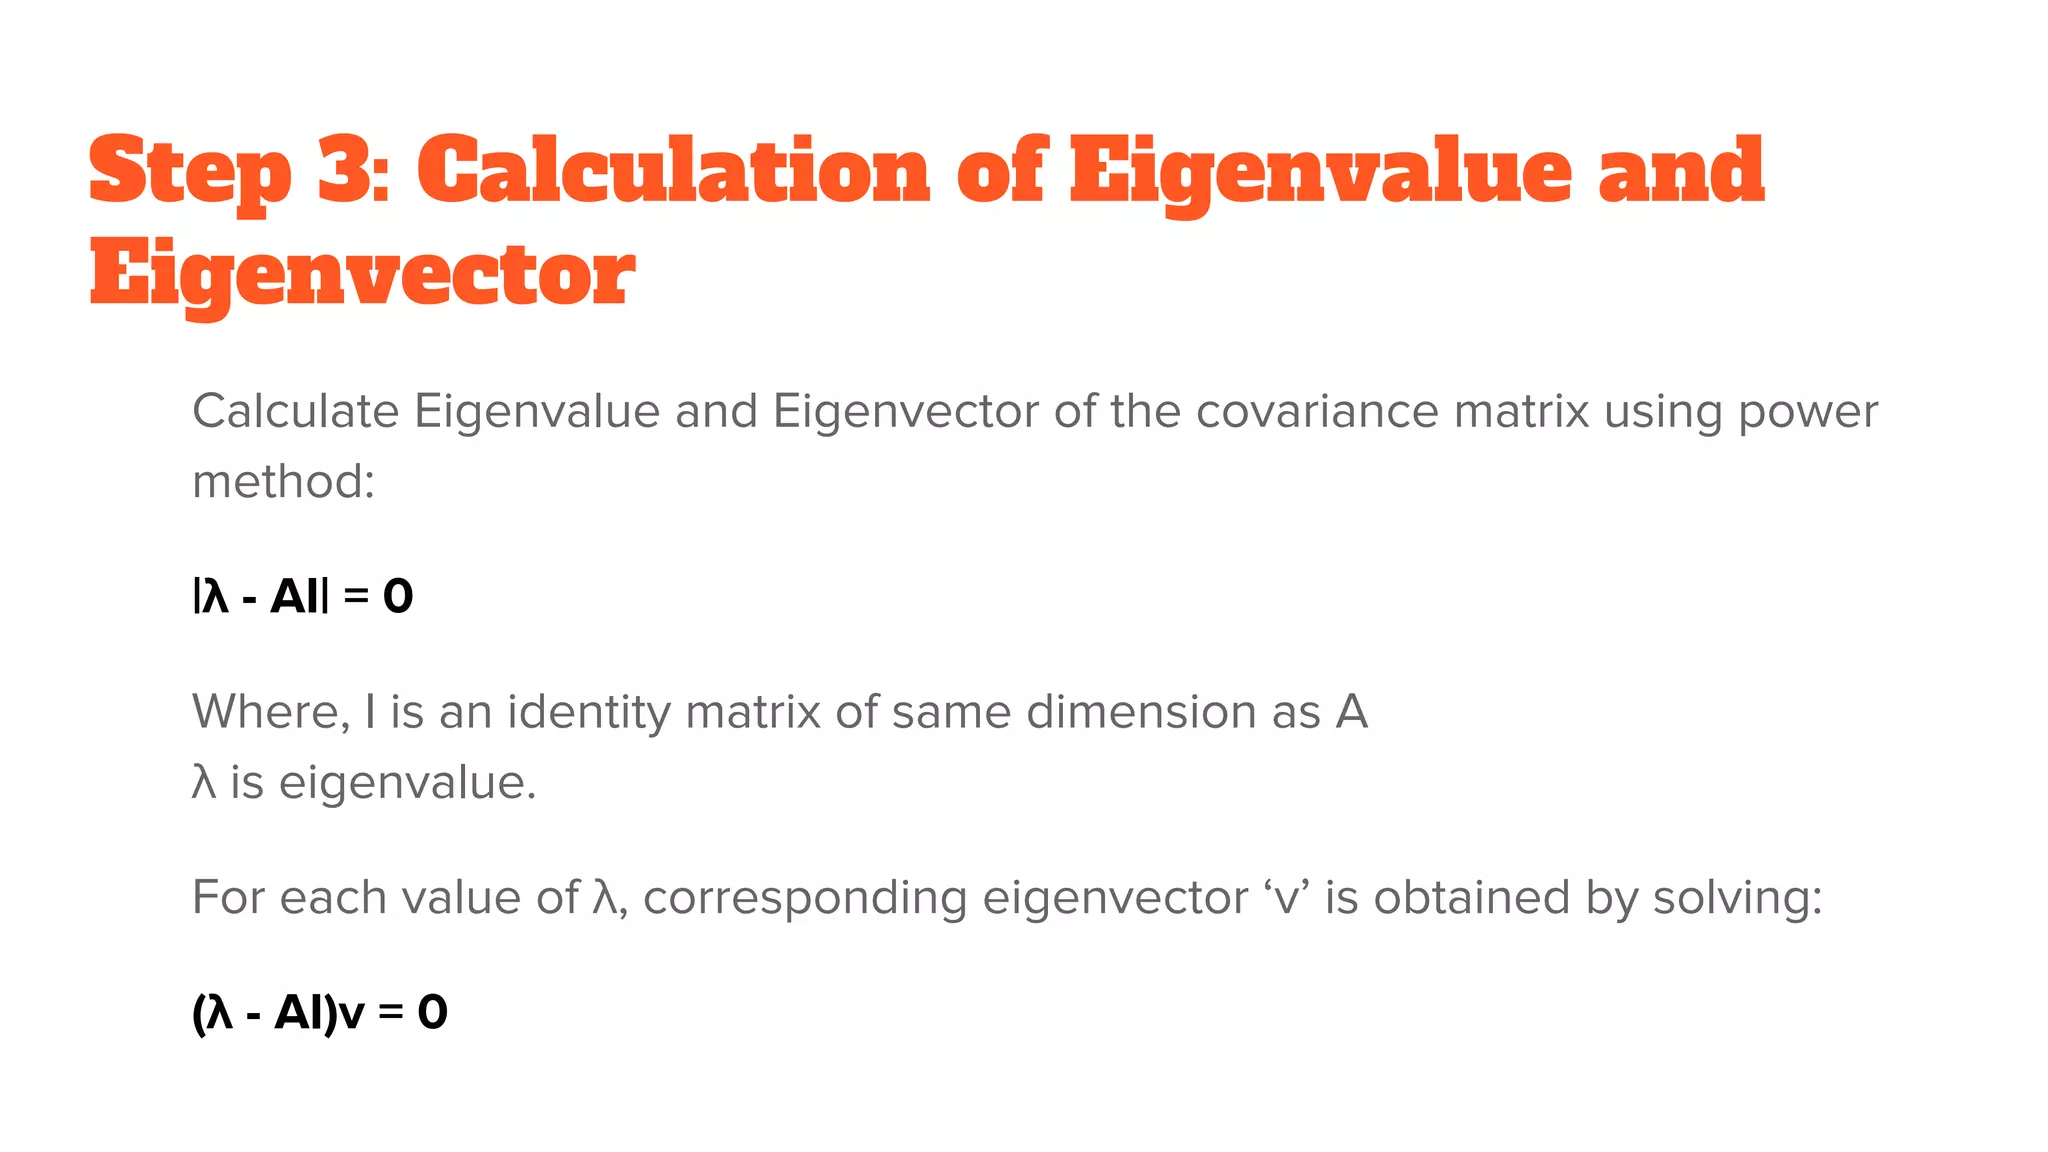
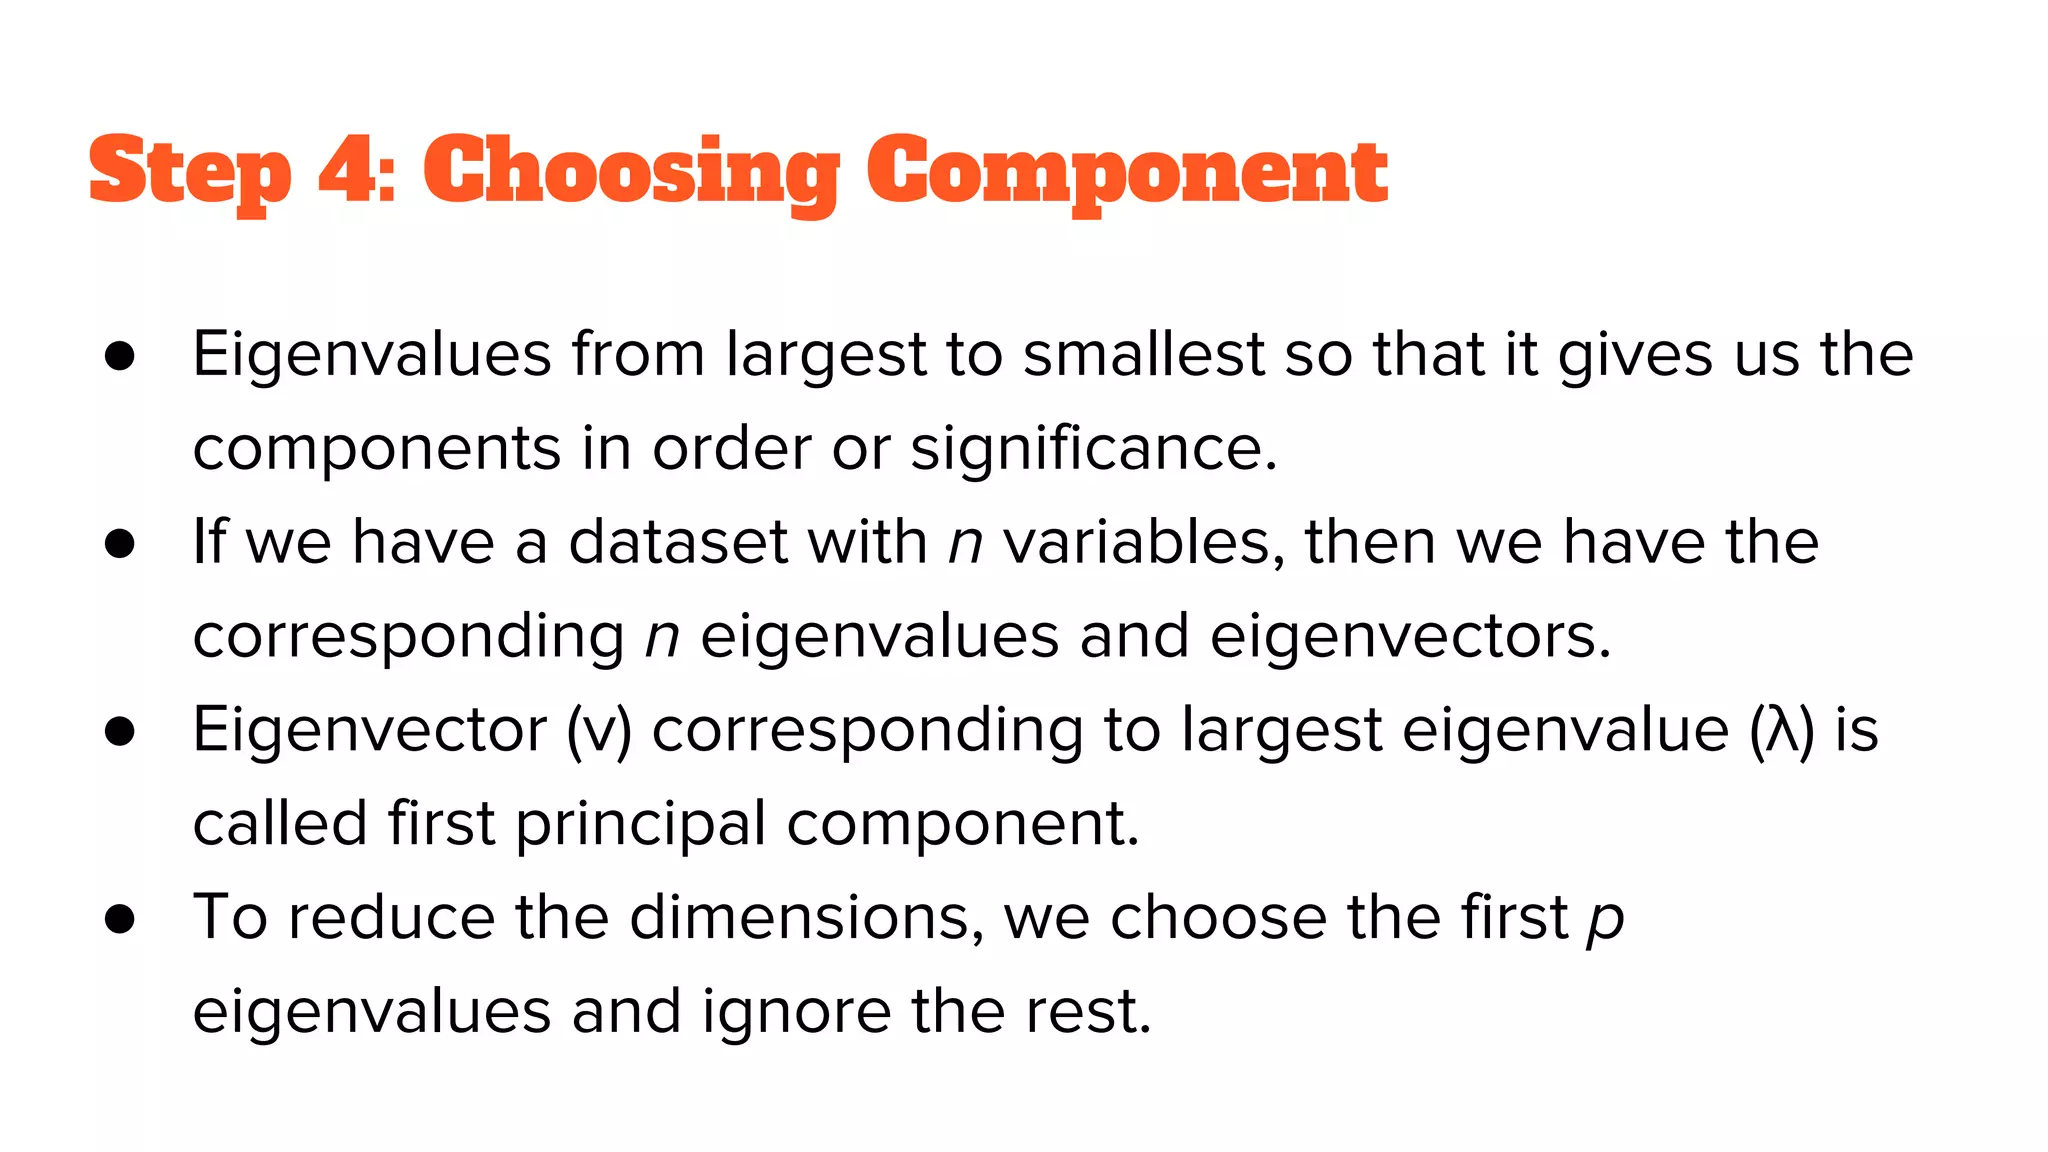
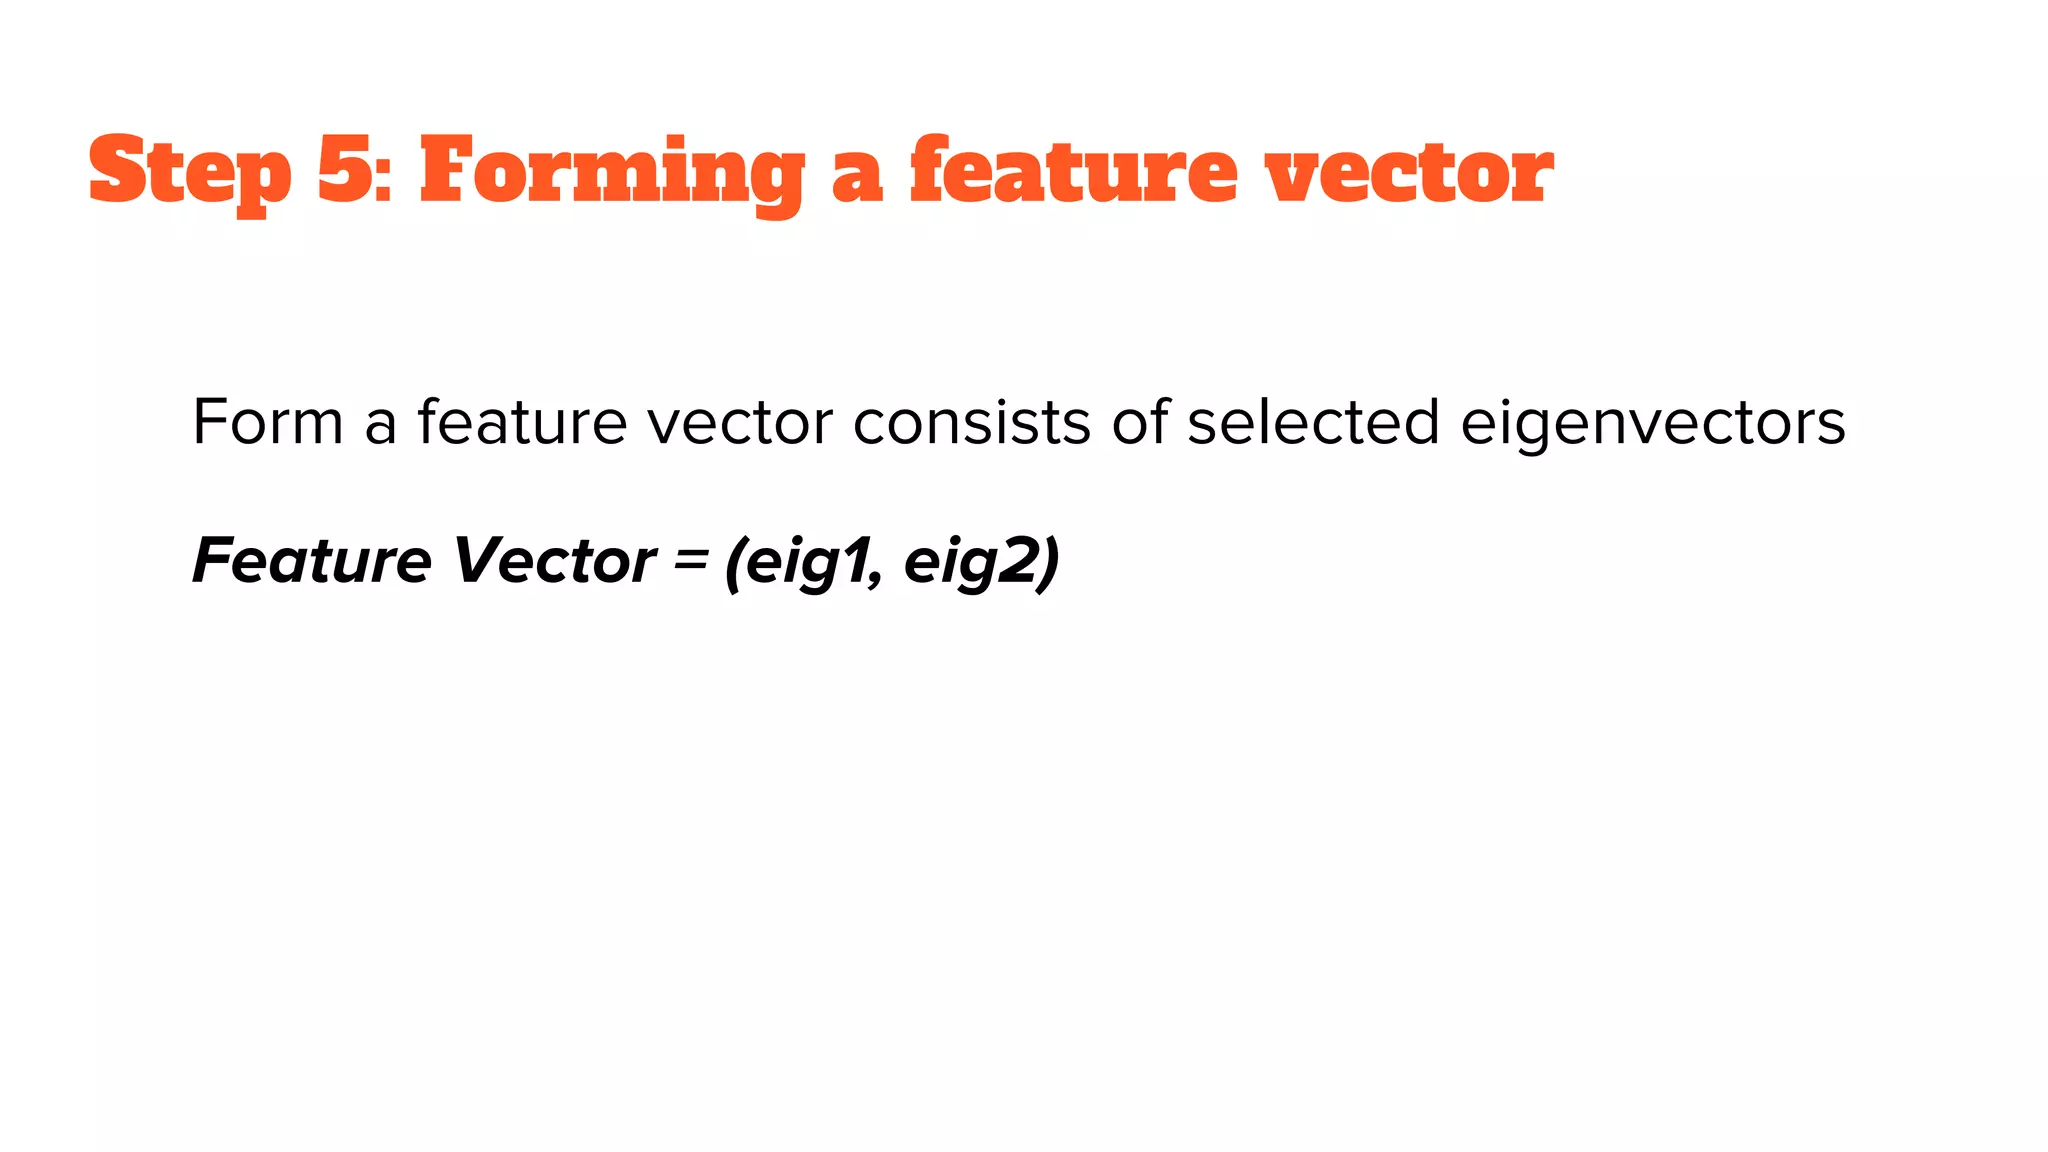
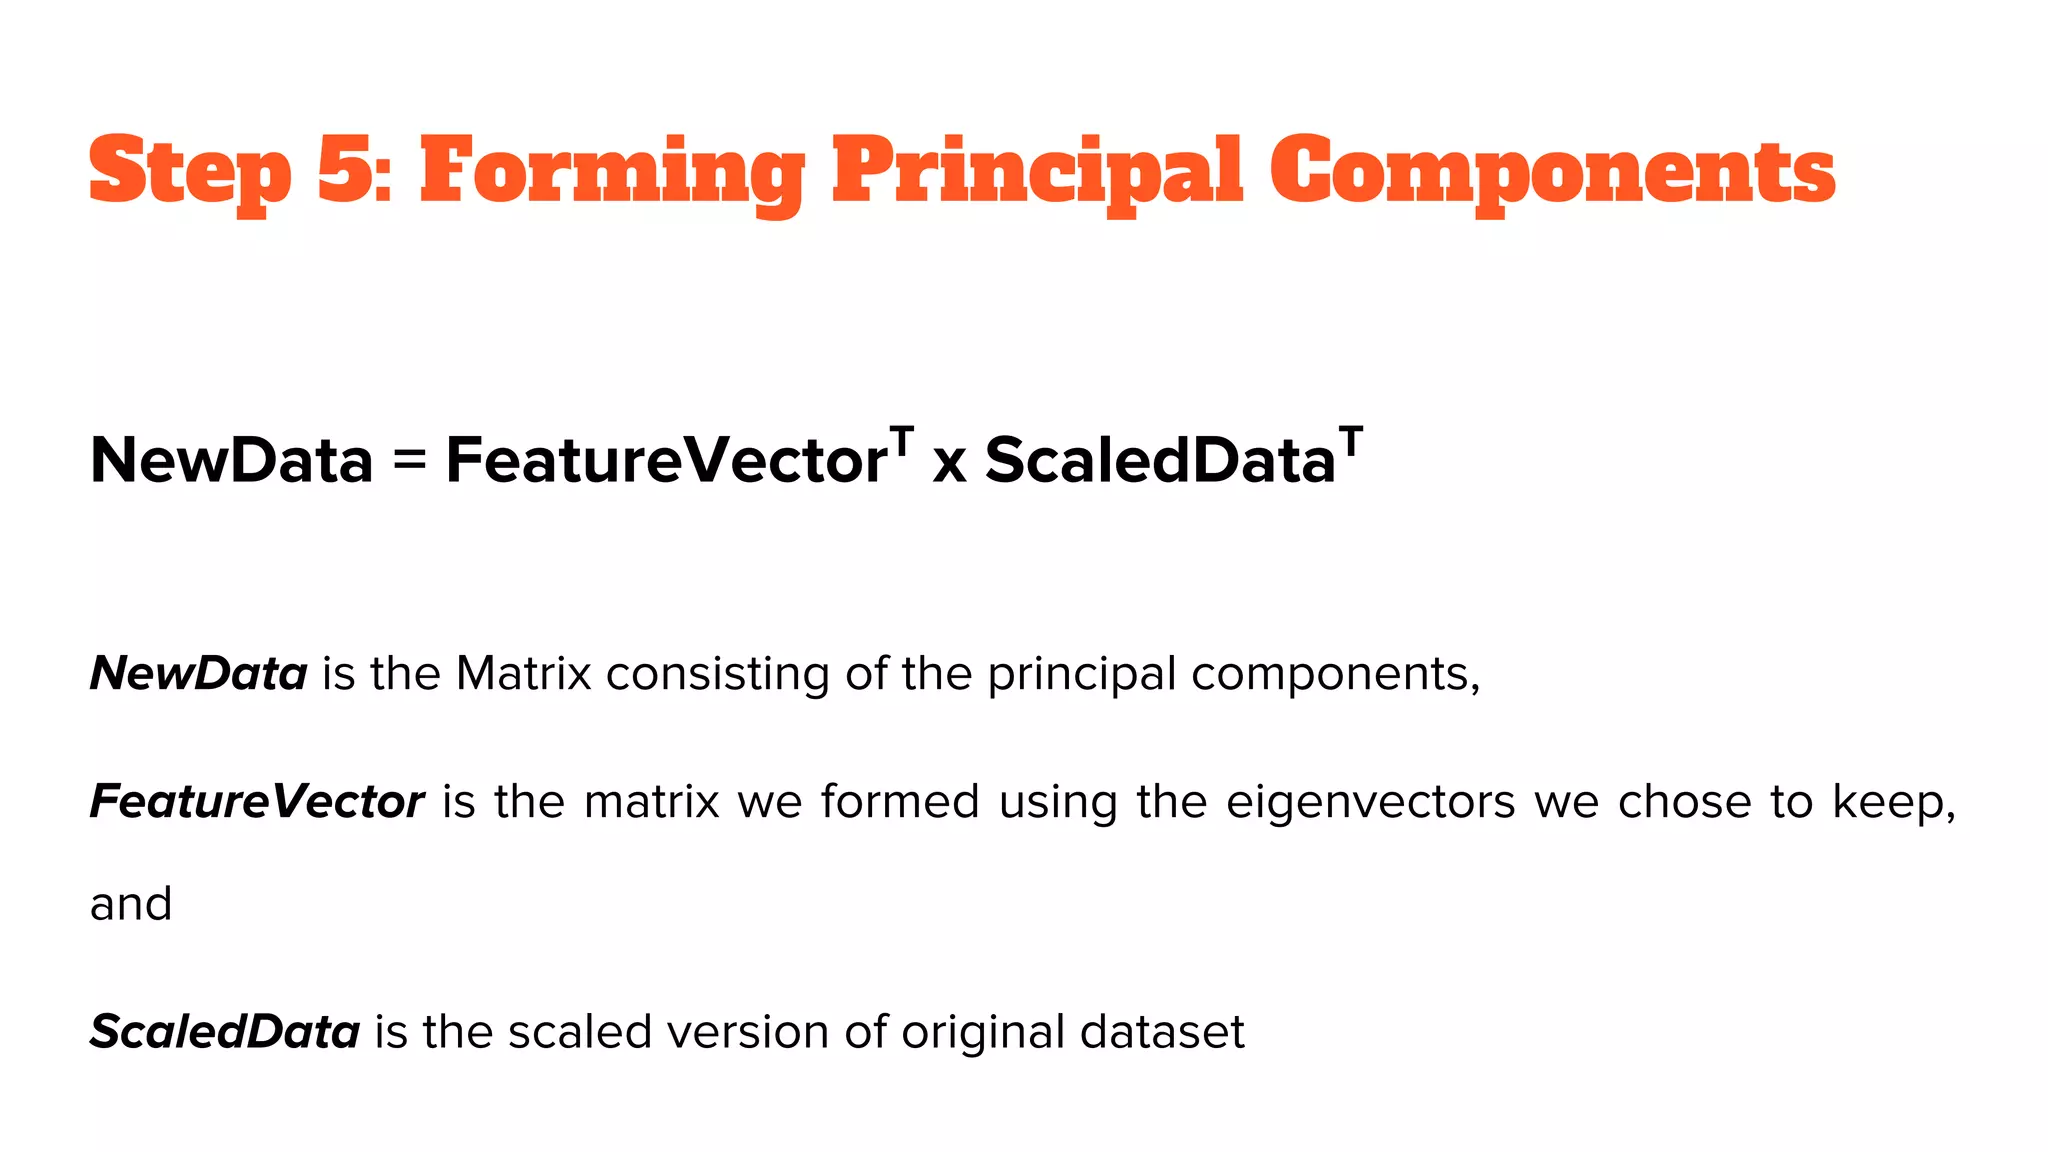
Detailed steps for implementing PCA including normalization, covariance calculation, eigenvalue determination, and forming principal components.
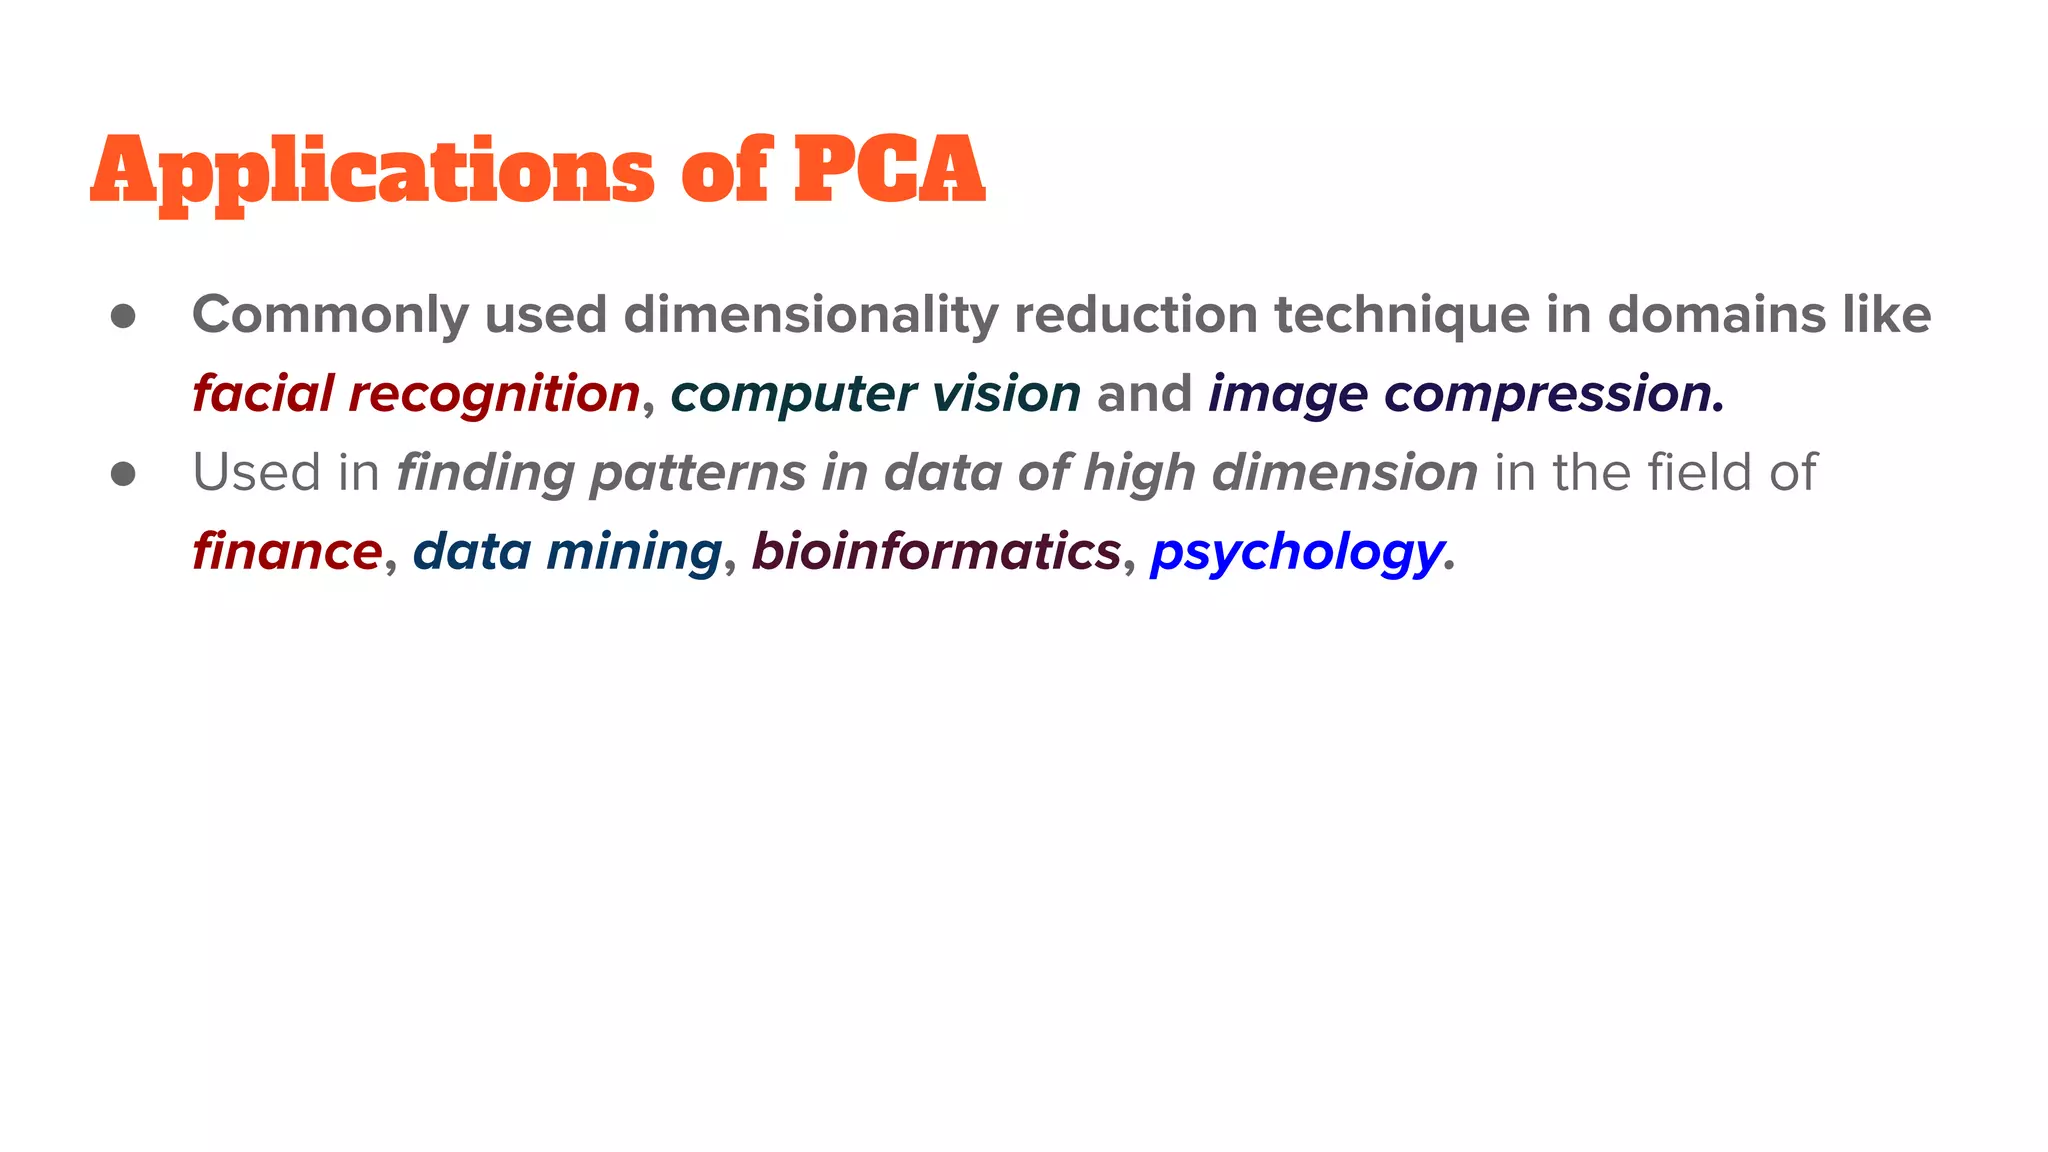
Discusses the uses of PCA in fields like facial recognition, computer vision, and finance for dimensionality reduction.
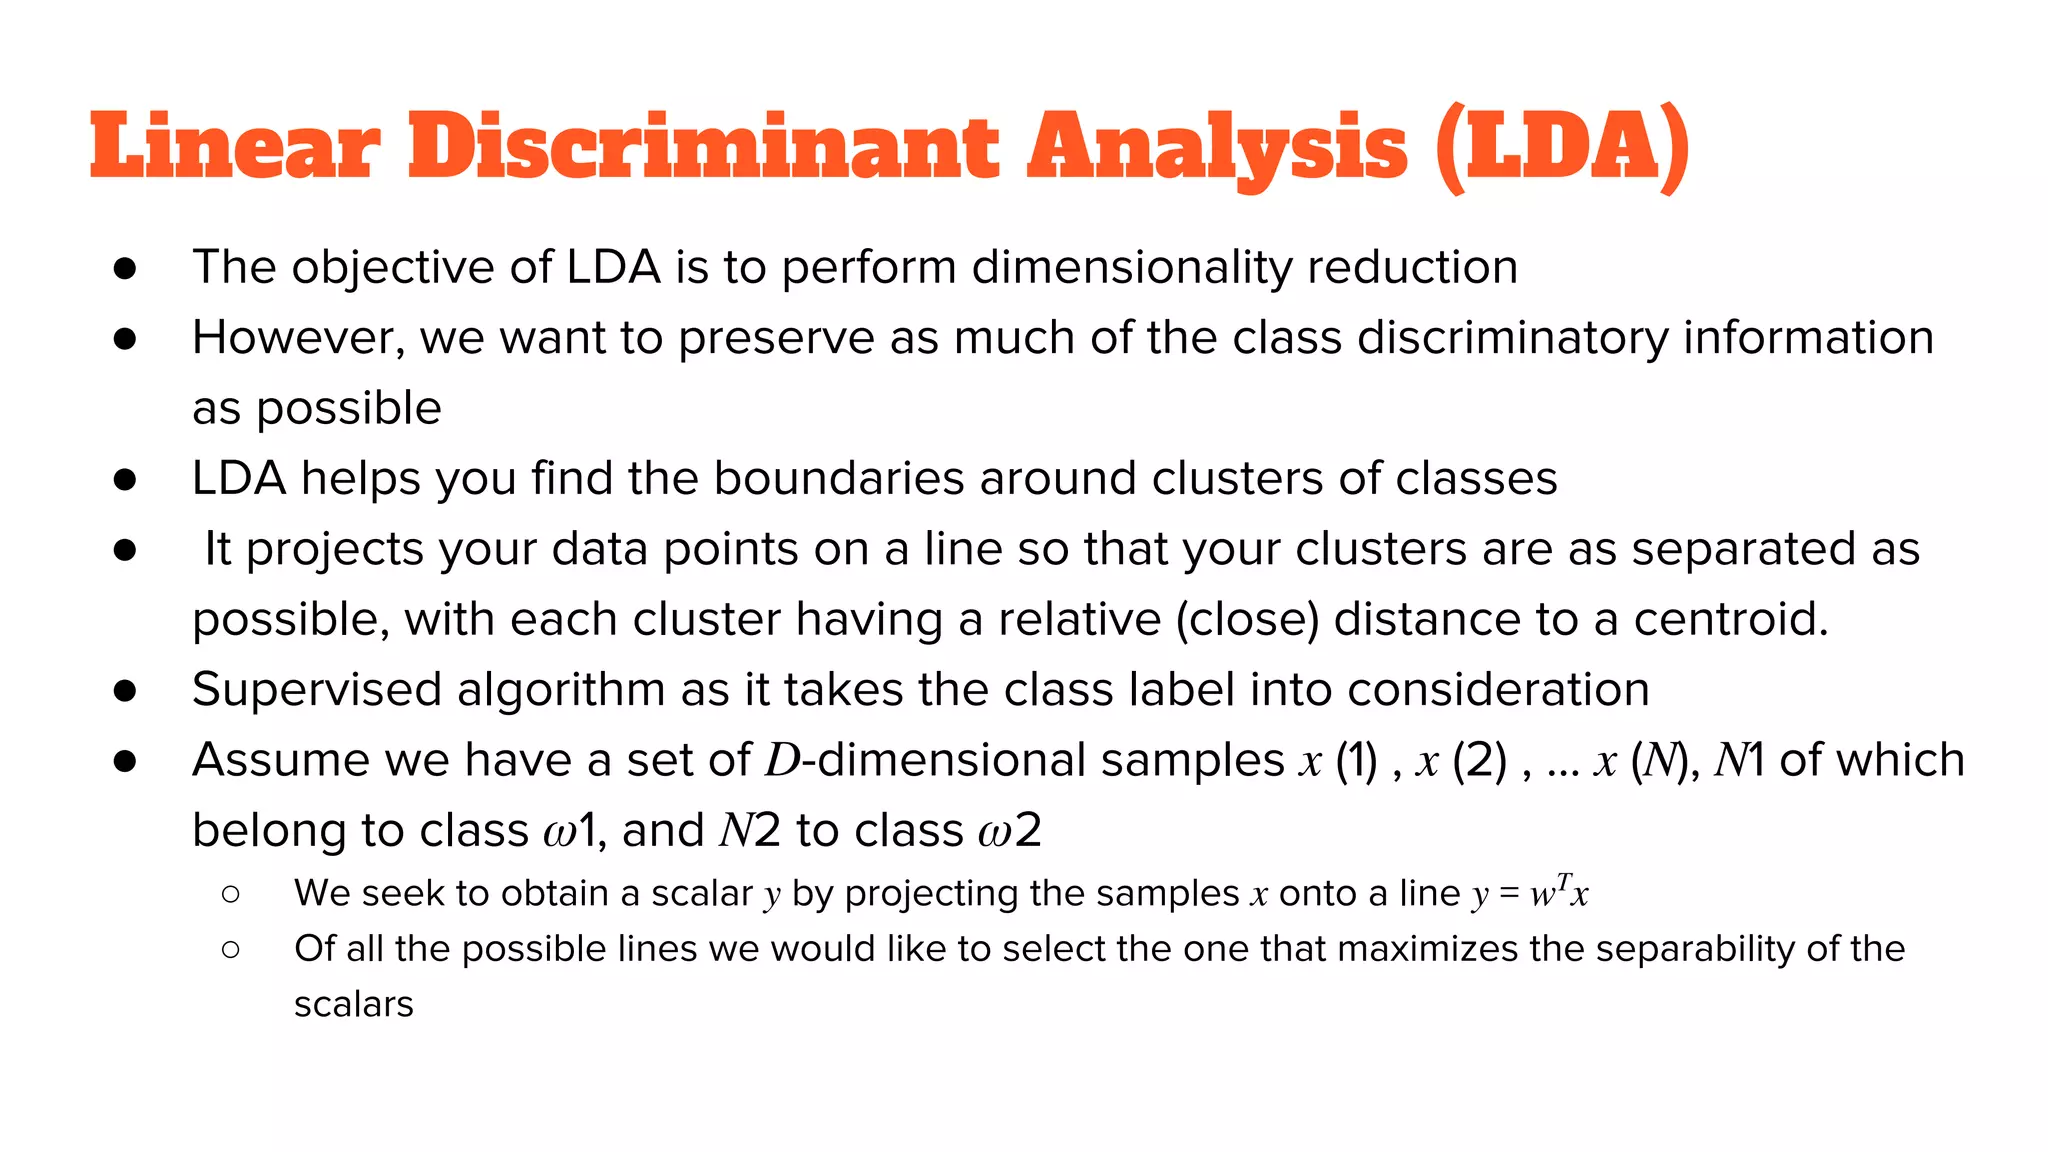
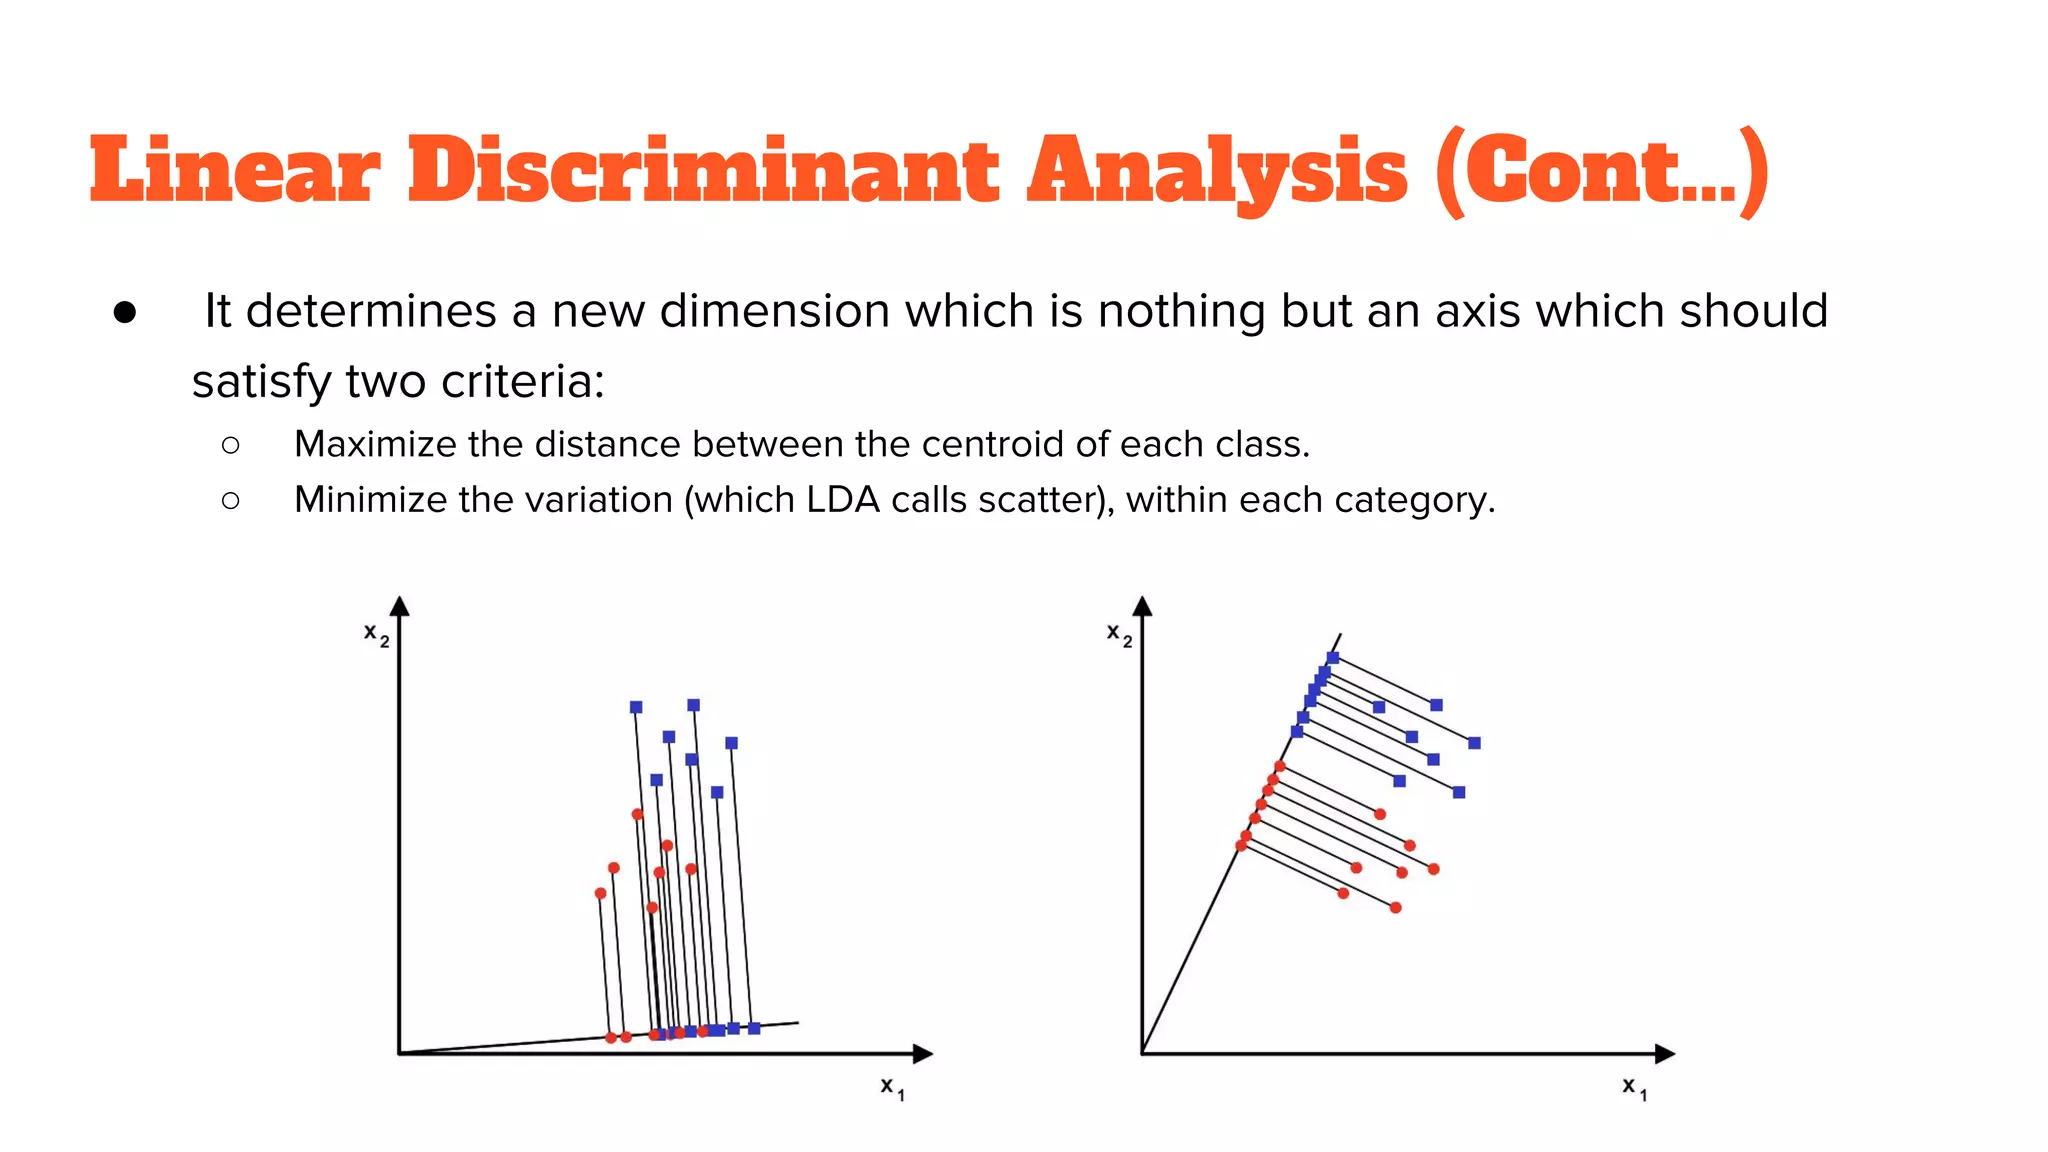
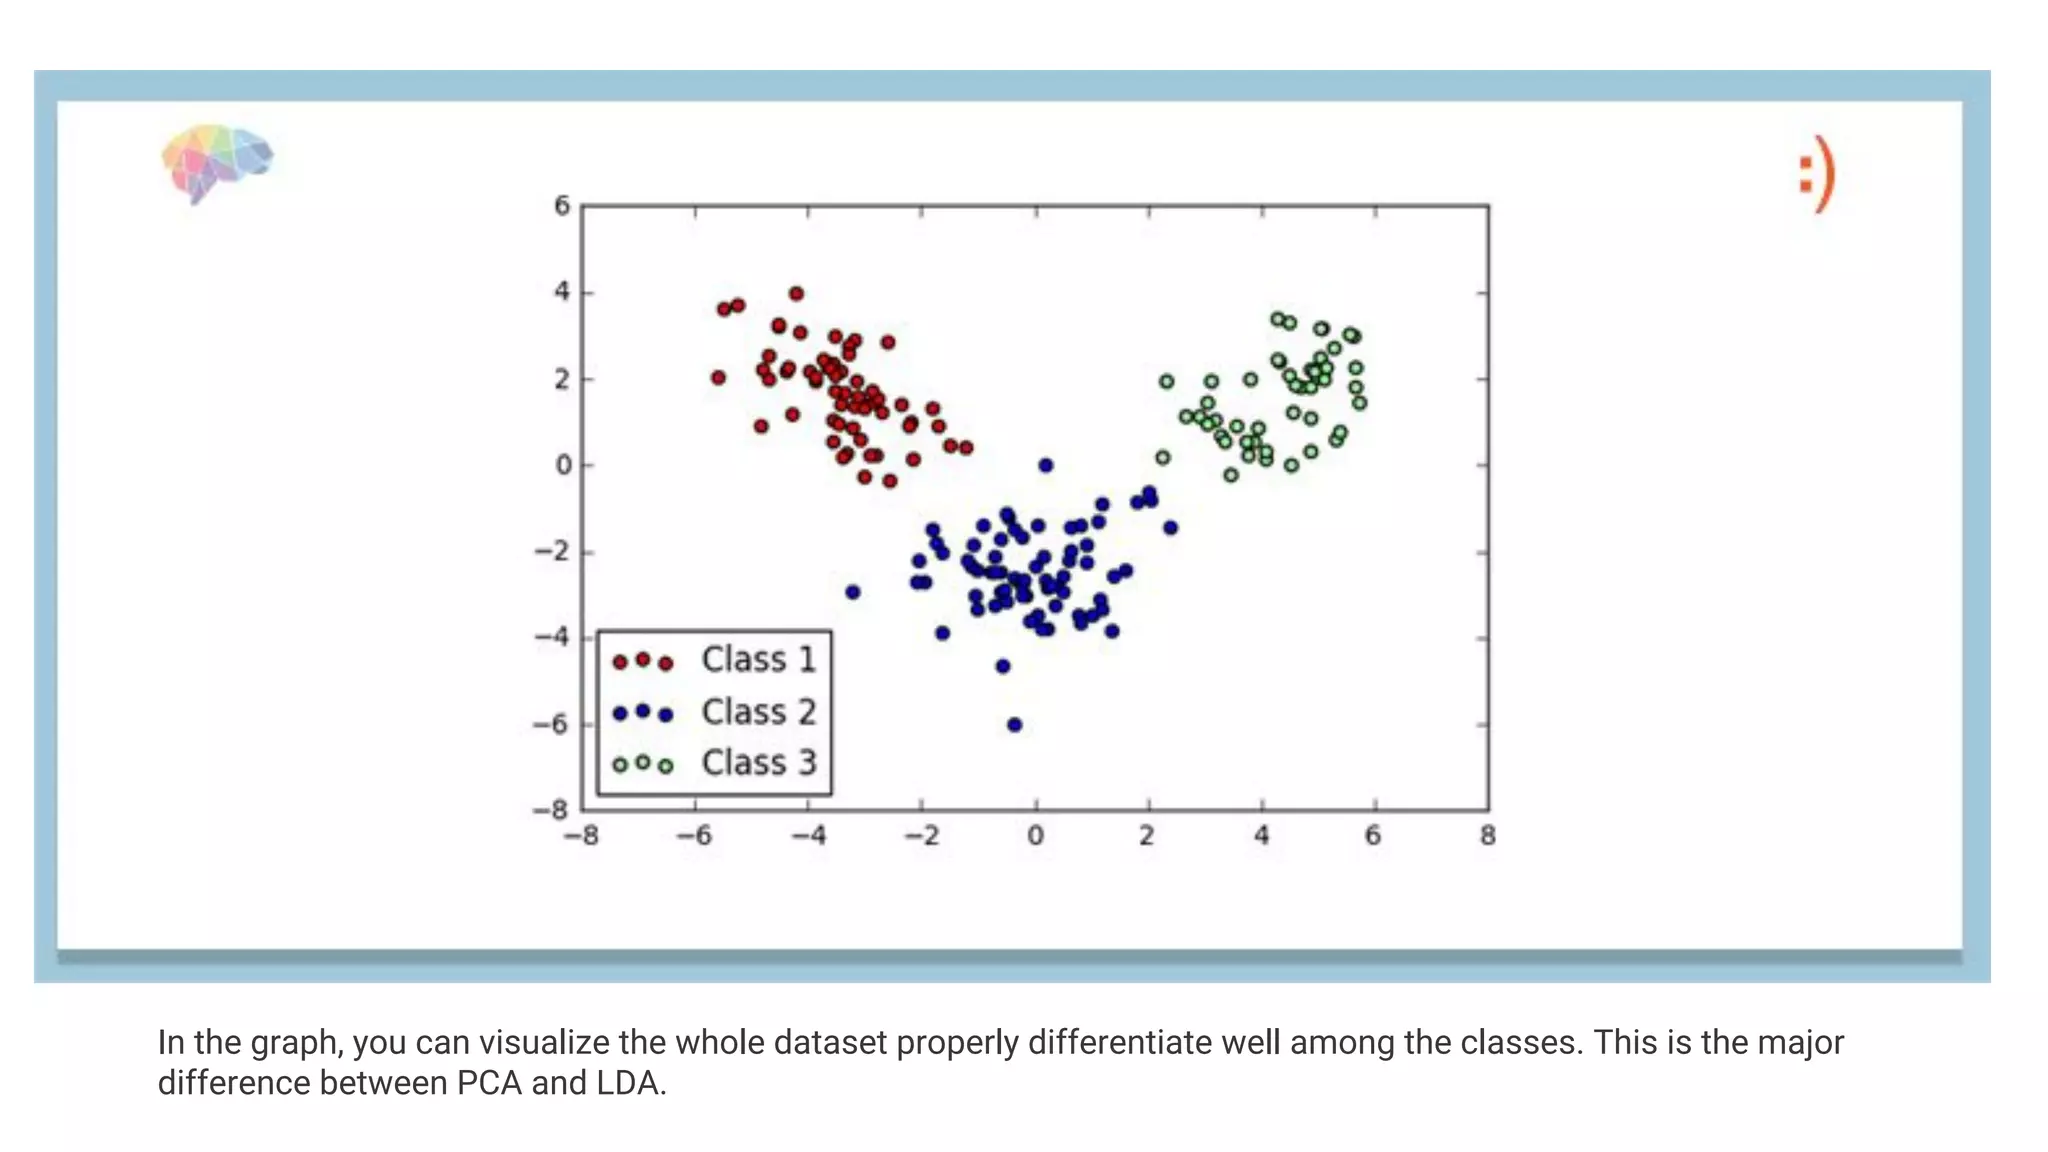
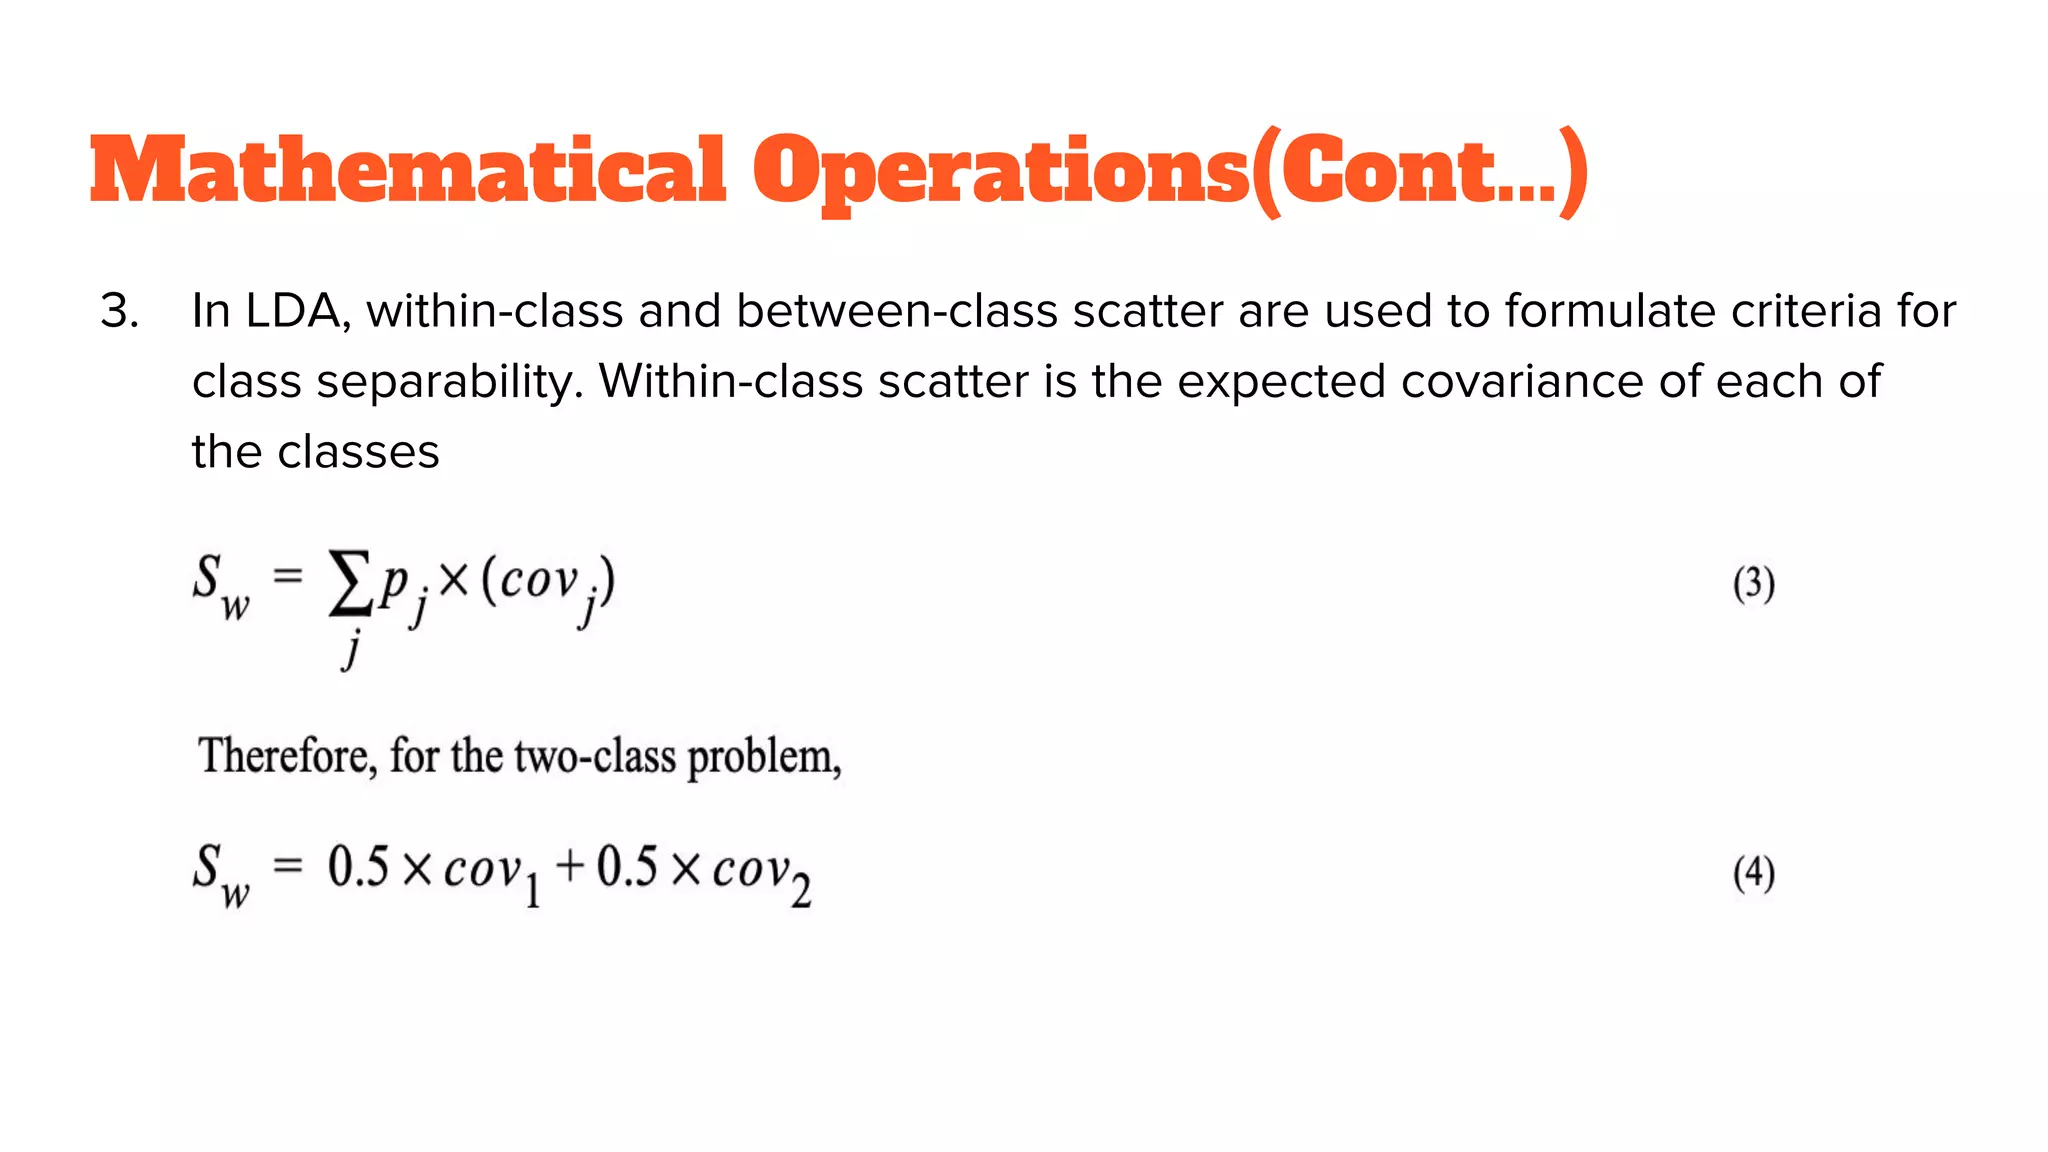
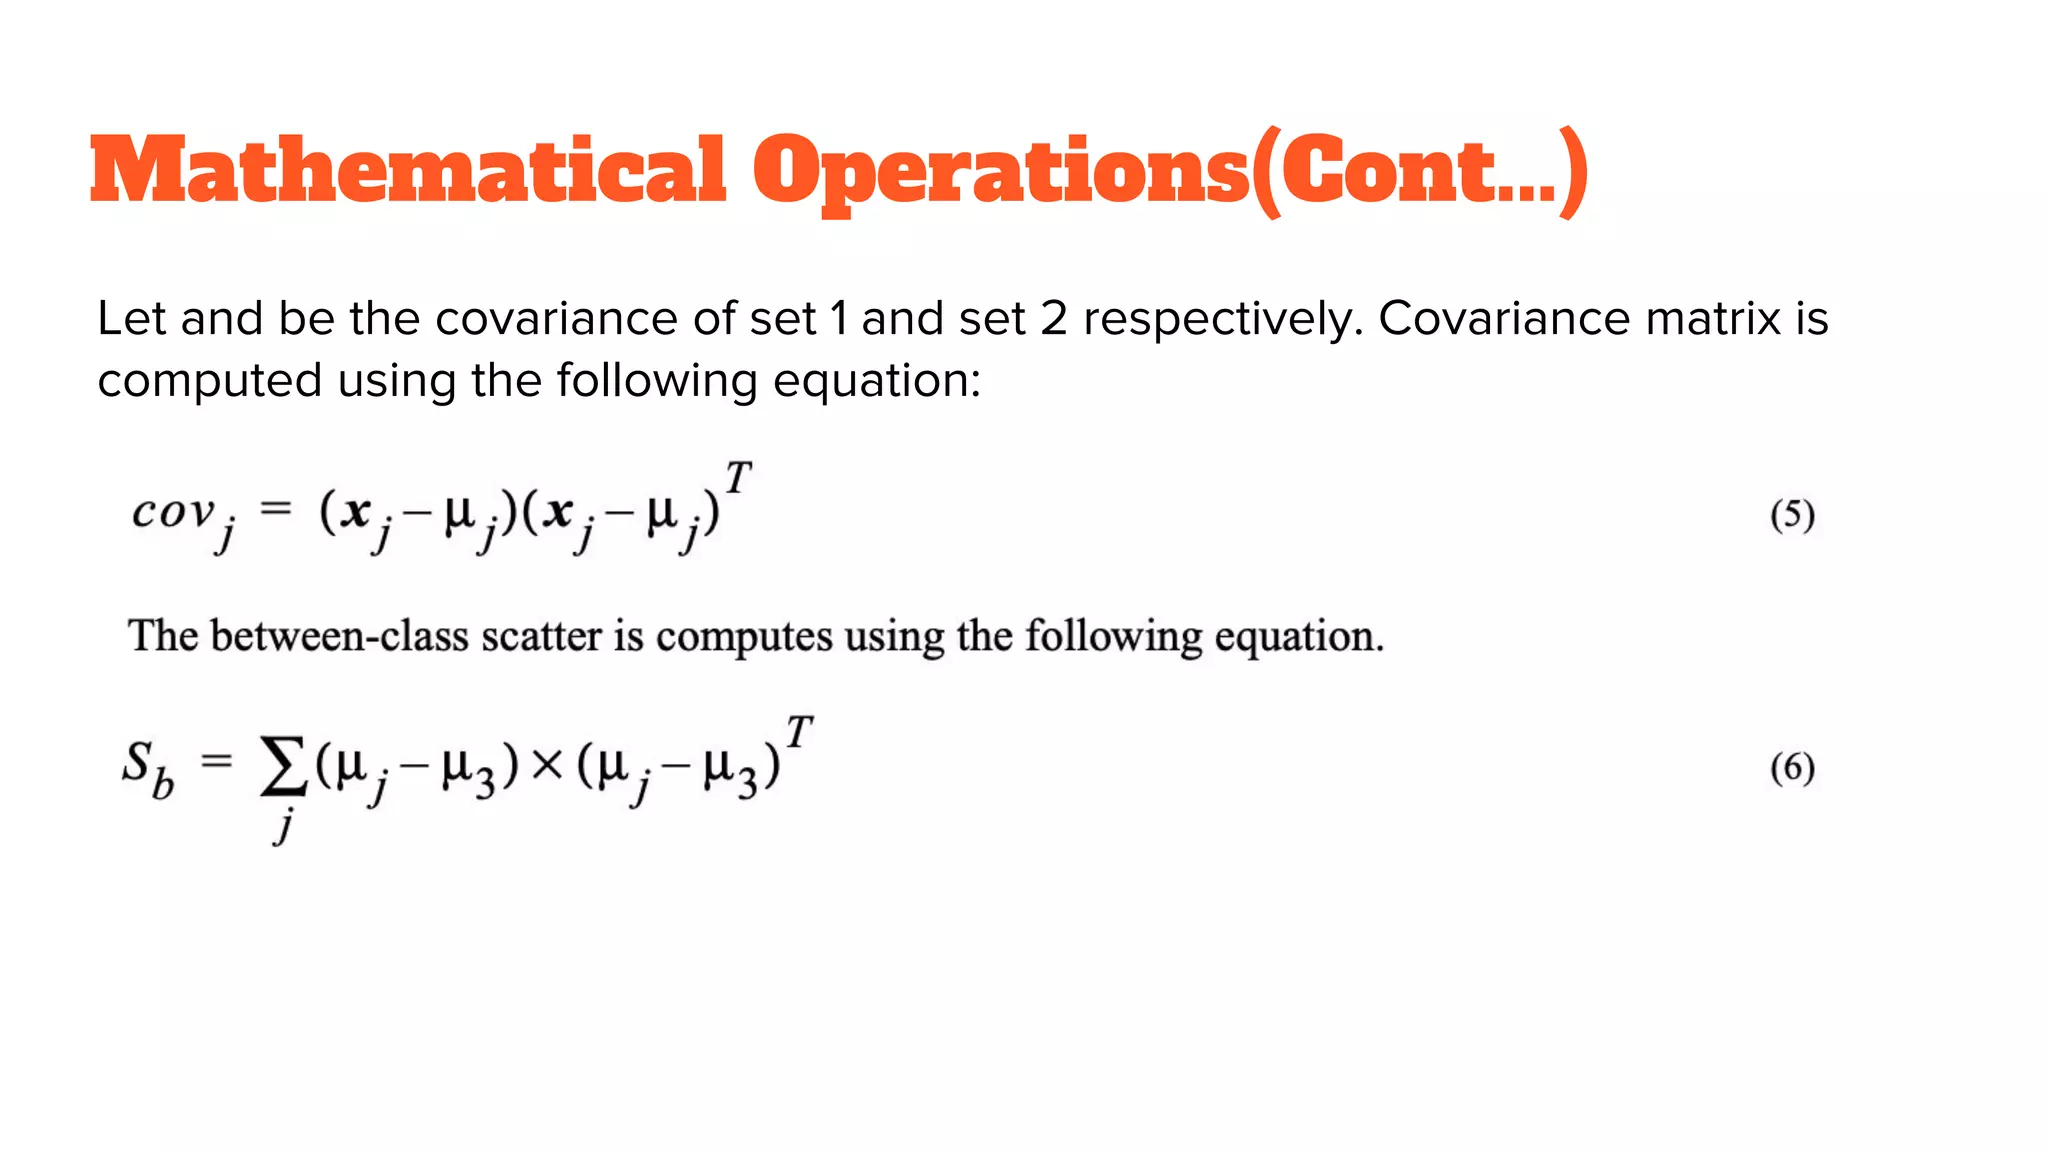
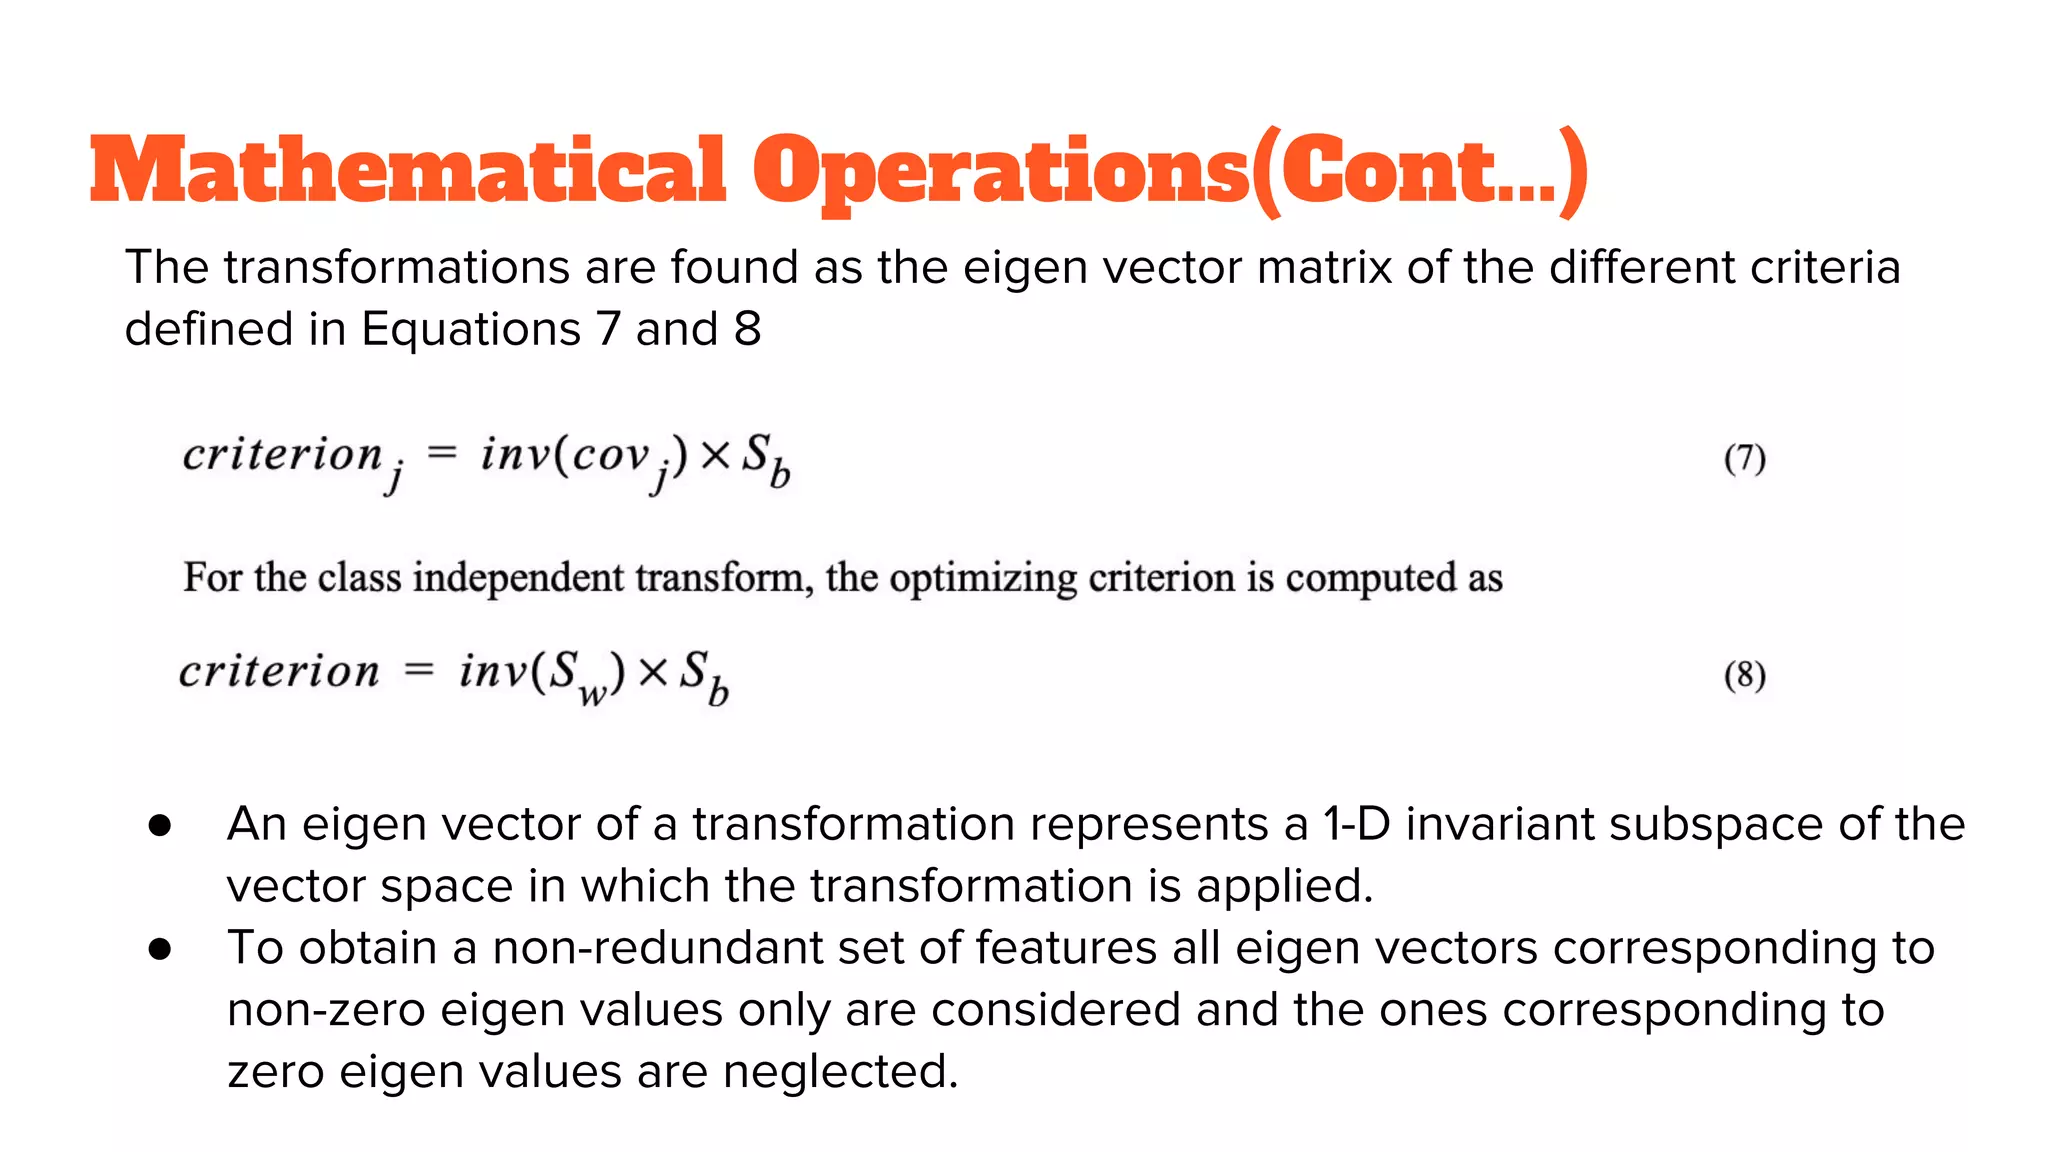
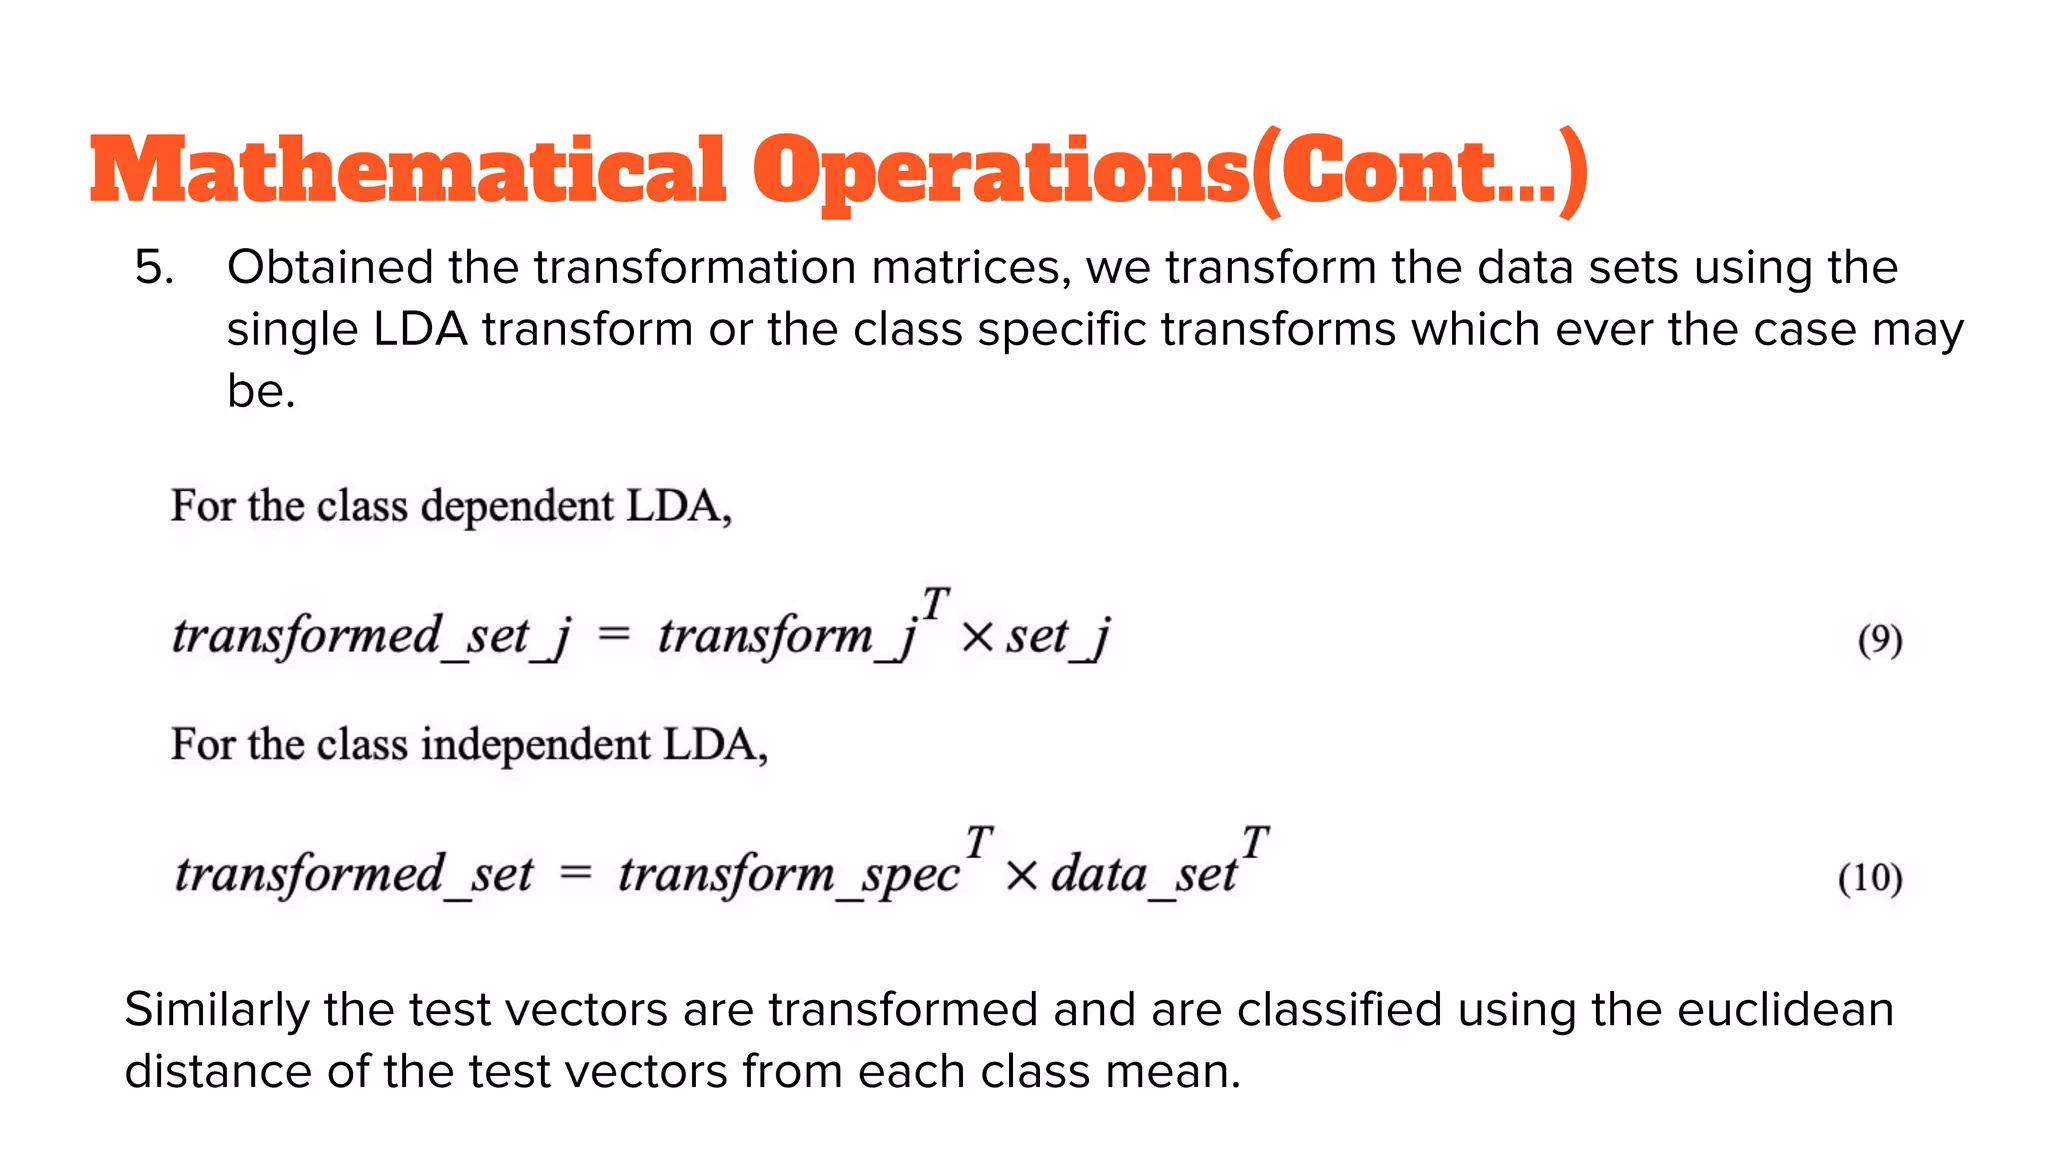
LDA aims for dimensionality reduction while preserving class discriminatory information and maximizing class separability.
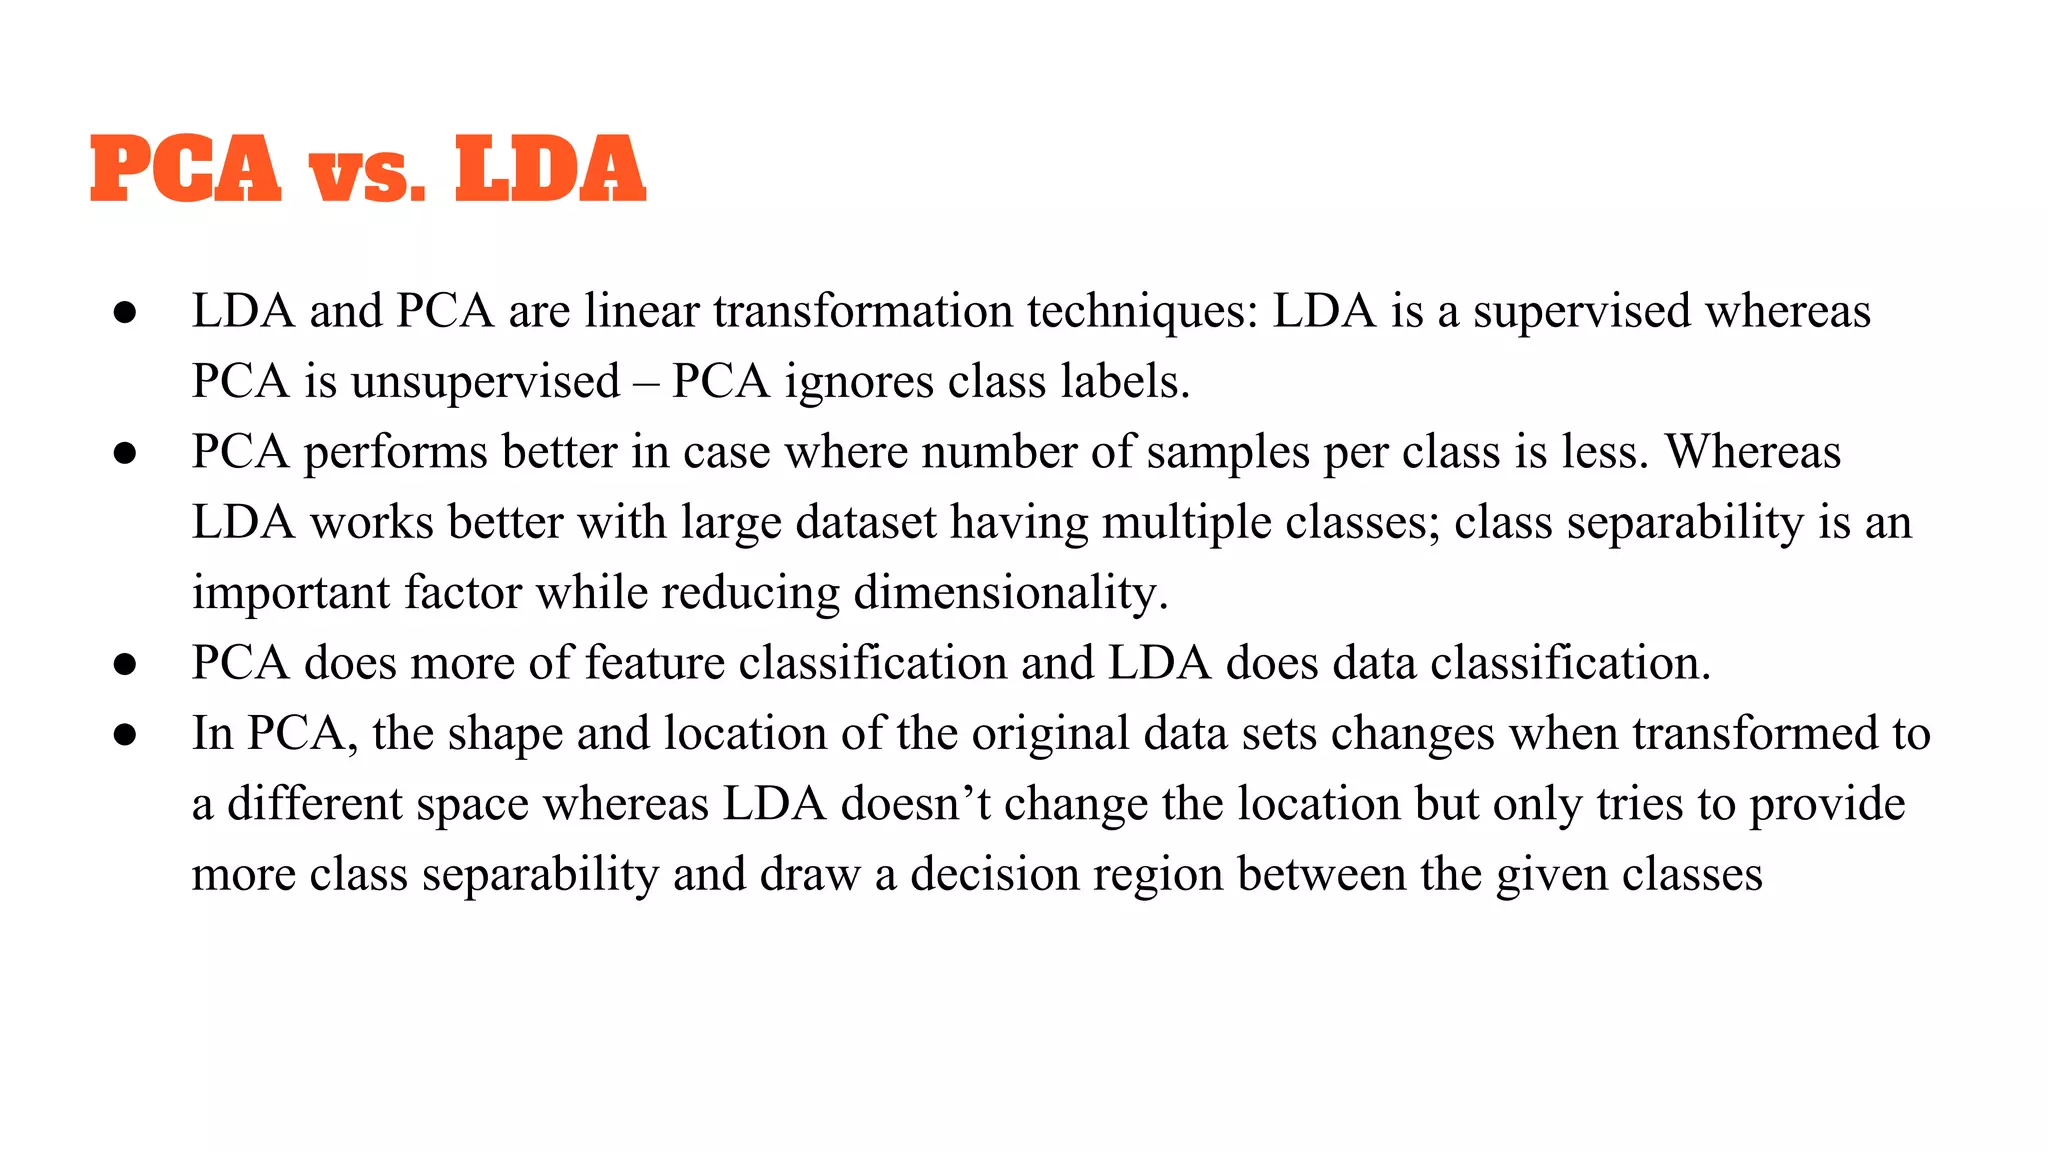
Comparison between PCA and LDA: PCA is unsupervised, while LDA is supervised, focusing on class separability and feature classification.
Provides references for further reading on PCA and LDA, including links and academic articles.


![[DSC Europe 25] Debmalya Biswas - Agentification: the art of transforming man...](https://cdn.slidesharecdn.com/ss_thumbnails/r5azlggvtqiaiiusrqdr-4-251212103249-5a12c89b-thumbnail.jpg?width=640&height=640&fit=bounds)
![[DSC Europe 25] Kaja Kandare - LLM as a judge.pptx](https://cdn.slidesharecdn.com/ss_thumbnails/arxyccaxsdsd1ba99wjw-7-251212104007-2b4e3f64-thumbnail.jpg?width=640&height=640&fit=bounds)

![[DSC Europe 25] Bassam Maharmeh - Artificial Intelligence: Opportunities and ...](https://cdn.slidesharecdn.com/ss_thumbnails/thhfmr2fqpawzj7hsjpg-5-251211083048-2c23204f-thumbnail.jpg?width=640&height=640&fit=bounds)

![[DSC Europe 25] Dusan Pavlov - There Is No Spoon: Inferring Vision from Neura...](https://cdn.slidesharecdn.com/ss_thumbnails/wg0v1umoqjm4nnbd3p0v-there-is-no-spoon-251205085715-6d81d6c5-thumbnail.jpg?width=640&height=640&fit=bounds)

![[DSC Europe 25] Milan Zdravkovic - The road less traveled in District Heating...](https://cdn.slidesharecdn.com/ss_thumbnails/nfaboniqwsz4ucyctnmy-2-milan-zdravkovic-dsc2025-the-road-less-traveled-in-district-heating-operation-251208151905-f56388a5-thumbnail.jpg?width=640&height=640&fit=bounds)
![[DSC Europe 25] Aleksandra Dragicevic - AI-Boosted Research in Healthcare: Fr...](https://cdn.slidesharecdn.com/ss_thumbnails/iqwngszurf2r7pi1lnnj-4-aleksandra-dragicevic-ad-dsc-europe-conference-20-251208151905-37c3238a-thumbnail.jpg?width=640&height=640&fit=bounds)

![[DSC Europe 25] Andy Cotgreave - Nothing is new in analytics.pptx](https://cdn.slidesharecdn.com/ss_thumbnails/mba4vzcurvoh5lfrd5zw-6-251205194645-341bbbbe-thumbnail.jpg?width=640&height=640&fit=bounds)
![[DSC Europe 25] Marija Vlajkovic & Andrea Radonjanin - Integration of AI tool...](https://cdn.slidesharecdn.com/ss_thumbnails/qf1jrglttoc3bm8s3aop-final-integration-of-ai-tools-251208151905-394f3a6a-thumbnail.jpg?width=640&height=640&fit=bounds)


![[DSC Europe 25] Dragan Vucic - Building the Learning Organization - How AI Tr...](https://cdn.slidesharecdn.com/ss_thumbnails/8brigo2sbu6qur6gxrra-7-251205085715-6ae07d24-thumbnail.jpg?width=640&height=640&fit=bounds)

![[DSC Europe 25] Sara Polak - The Ancient Operating System: What Archaeology T...](https://cdn.slidesharecdn.com/ss_thumbnails/3vch2p6tttdnwhsgazoz-3-sara-polak-smart-cities-251208152532-64404202-thumbnail.jpg?width=640&height=640&fit=bounds)