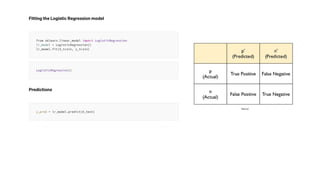
Logistic regression isa statistical method that we use to fit a regression
model when the response variable is binary.
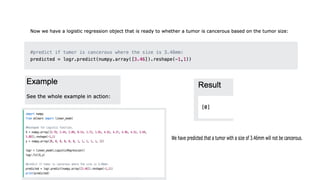
Logistic Regression Real Life Example #1
• Medical researchers want to know how exercise and weight impact the
probability of having a heart attack. To understand the relationship between
the predictor variables and the probability of having a heart attack,
researchers can perform logistic regression.
The response variable in the model will be heart attack and it has two
potential outcomes:
• A heart attack occurs.
• A heart attack does not occur.
3.
The results ofthe model will tell researchers exactly how changes
in exercise and weight affect the probability that a given individual
has a heart attack. The researchers can also use the fitted
logistic regression model to predict the probability that a given
individual has a heart attacked, based on their weight and their
time spent exercising.
4.
Logistic Regression RealLife Example #2
• Researchers want to know how GPA, ACT score, and number of AP classes
taken impact the probability of getting accepted into a particular university.
To understand the relationship between the predictor variables and the
probability of getting accepted, researchers can perform logistic regression.
The response variable in the model will be “acceptance” and it has two
potential outcomes:
• A student gets accepted.
• A student does not get accepted.
• The results of the model will tell researchers exactly how changes in GPA,
ACT score, and number of AP classes taken affect the probability that a
given individual gets accepted into the university. The researchers can also
use the fitted logistic regression model to predict the probability that a given
individual gets accepted, based on their GPA, ACT score, and number of AP
classes taken.
5.
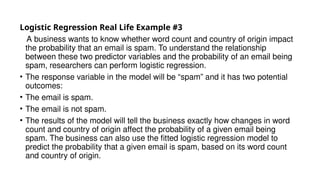
Logistic Regression RealLife Example #3
A business wants to know whether word count and country of origin impact
the probability that an email is spam. To understand the relationship
between these two predictor variables and the probability of an email being
spam, researchers can perform logistic regression.
• The response variable in the model will be “spam” and it has two potential
outcomes:
• The email is spam.
• The email is not spam.
• The results of the model will tell the business exactly how changes in word
count and country of origin affect the probability of a given email being
spam. The business can also use the fitted logistic regression model to
predict the probability that a given email is spam, based on its word count
and country of origin.
6.
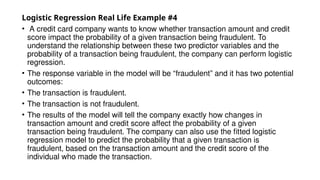
Logistic Regression RealLife Example #4
• A credit card company wants to know whether transaction amount and credit
score impact the probability of a given transaction being fraudulent. To
understand the relationship between these two predictor variables and the
probability of a transaction being fraudulent, the company can perform logistic
regression.
• The response variable in the model will be “fraudulent” and it has two potential
outcomes:
• The transaction is fraudulent.
• The transaction is not fraudulent.
• The results of the model will tell the company exactly how changes in
transaction amount and credit score affect the probability of a given
transaction being fraudulent. The company can also use the fitted logistic
regression model to predict the probability that a given transaction is
fraudulent, based on the transaction amount and the credit score of the
individual who made the transaction.
8.
Logistic Regression Equationand Assumptions
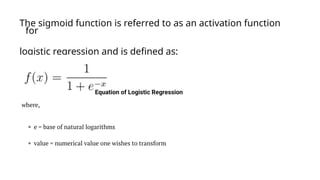
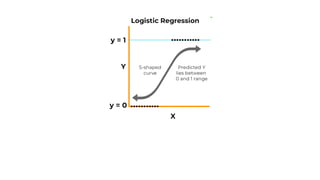
• Logistic regression uses a logistic function called a sigmoid
function to map predictions and their probabilities.
The sigmoid function refers to an S-shaped curve that
converts
any real value to a range between 0 and 1.
9.
The sigmoid functionis referred to as an activation function
for
logistic regression and is defined as:
10.
where,
• e =base of natural logarithms
value = numerical value one wishes to transform
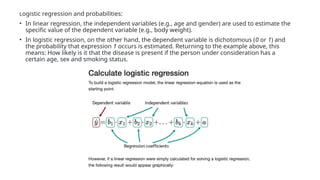
• The following equation represents logistic regression:
12.
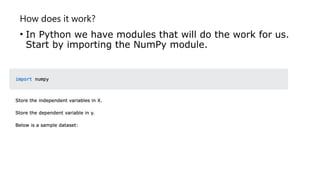
How does itwork?
• In Python we have modules that will do the work for us.
Start by importing the NumPy module.
16.
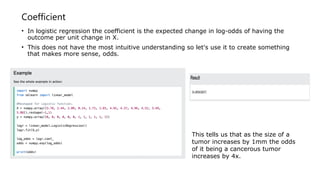
Coefficient
• In logisticregression the coefficient is the expected change in log-odds of having the
outcome per unit change in X.
• This does not have the most intuitive understanding so let's use it to create something
that makes more sense, odds.
This tells us that as the size of a
tumor increases by 1mm the odds
of it being a cancerous tumor
increases by 4x.
21.
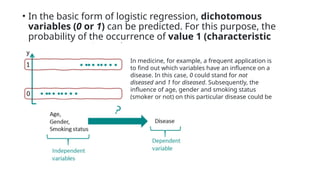
• In thebasic form of logistic regression, dichotomous
variables (0 or 1) can be predicted. For this purpose, the
probability of the occurrence of value 1 (characteristic
present) is estimated.
In medicine, for example, a frequent application is
to find out which variables have an influence on a
disease. In this case, 0 could stand for not
diseased and 1 for diseased. Subsequently, the
influence of age, gender and smoking status
(smoker or not) on this particular disease could be
examined.
22.
Logistic regression andprobabilities:
• In linear regression, the independent variables (e.g., age and gender) are used to estimate the
specific value of the dependent variable (e.g., body weight).
• In logistic regression, on the other hand, the dependent variable is dichotomous (0 or 1) and
the probability that expression 1 occurs is estimated. Returning to the example above, this
means: How likely is it that the disease is present if the person under consideration has a
certain age, sex and smoking status.
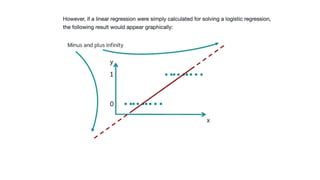
24.
This now ensuresthat no matter in which range the x
values are located, only values between 0 and 1 will
come out. The new graph now looks like this:


![logistic model final_pptx__corected_one[1].pptx](https://cdn.slidesharecdn.com/ss_thumbnails/finalpptxcorectedone1-251124022241-c29356b7-thumbnail.jpg?width=640&height=640&fit=bounds)


