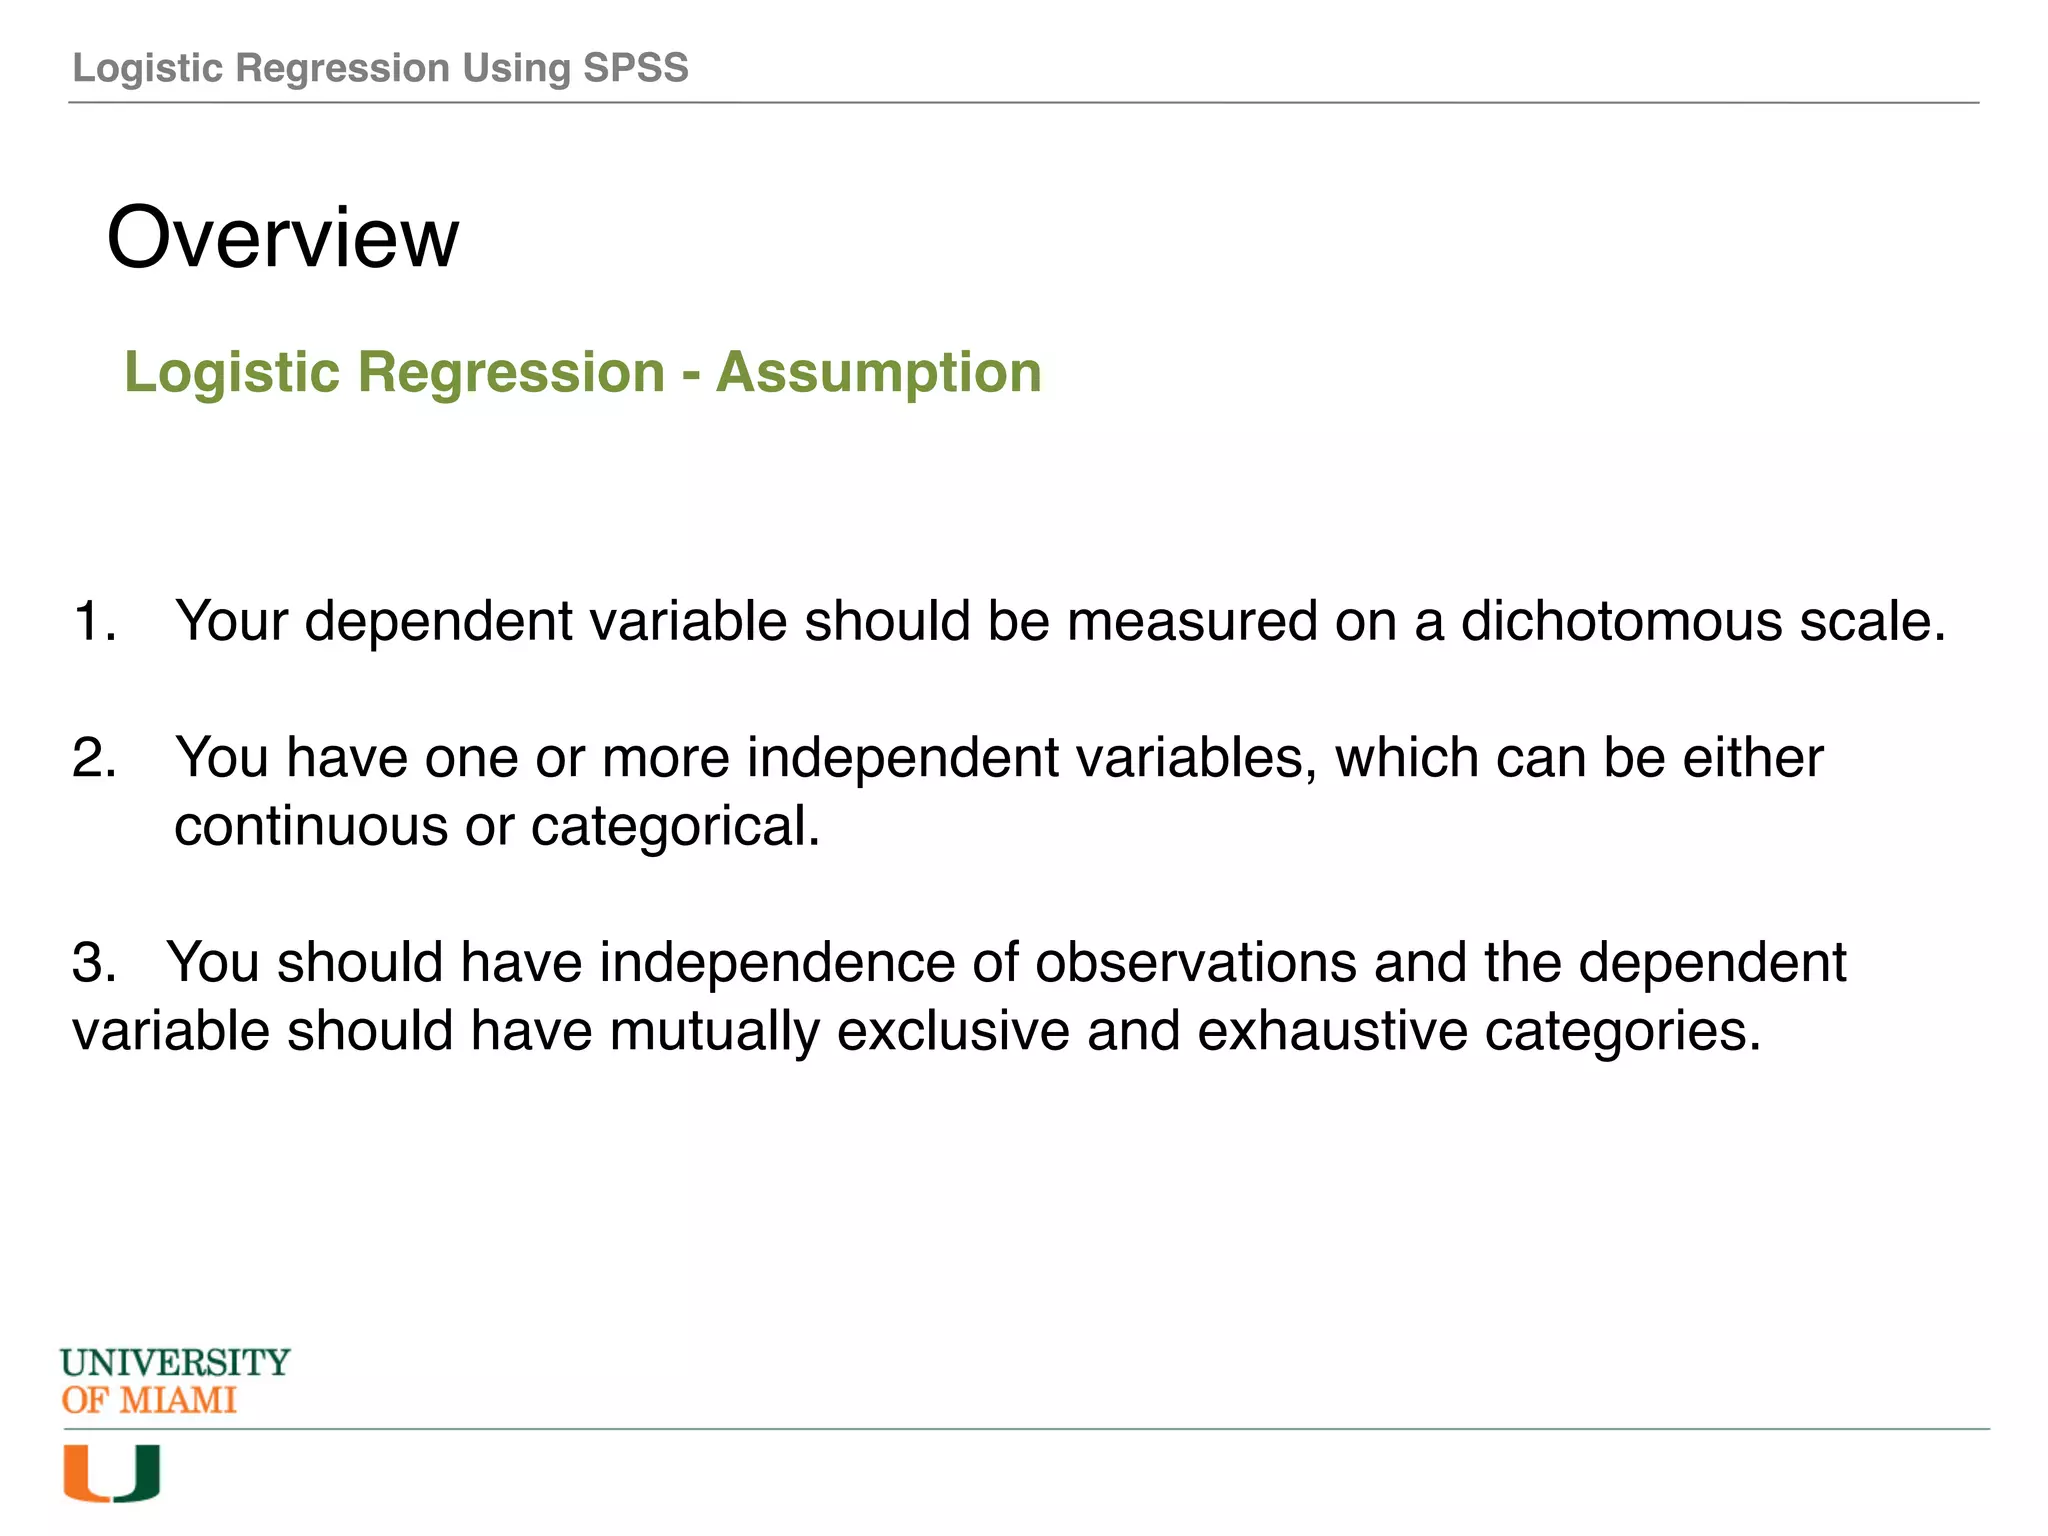
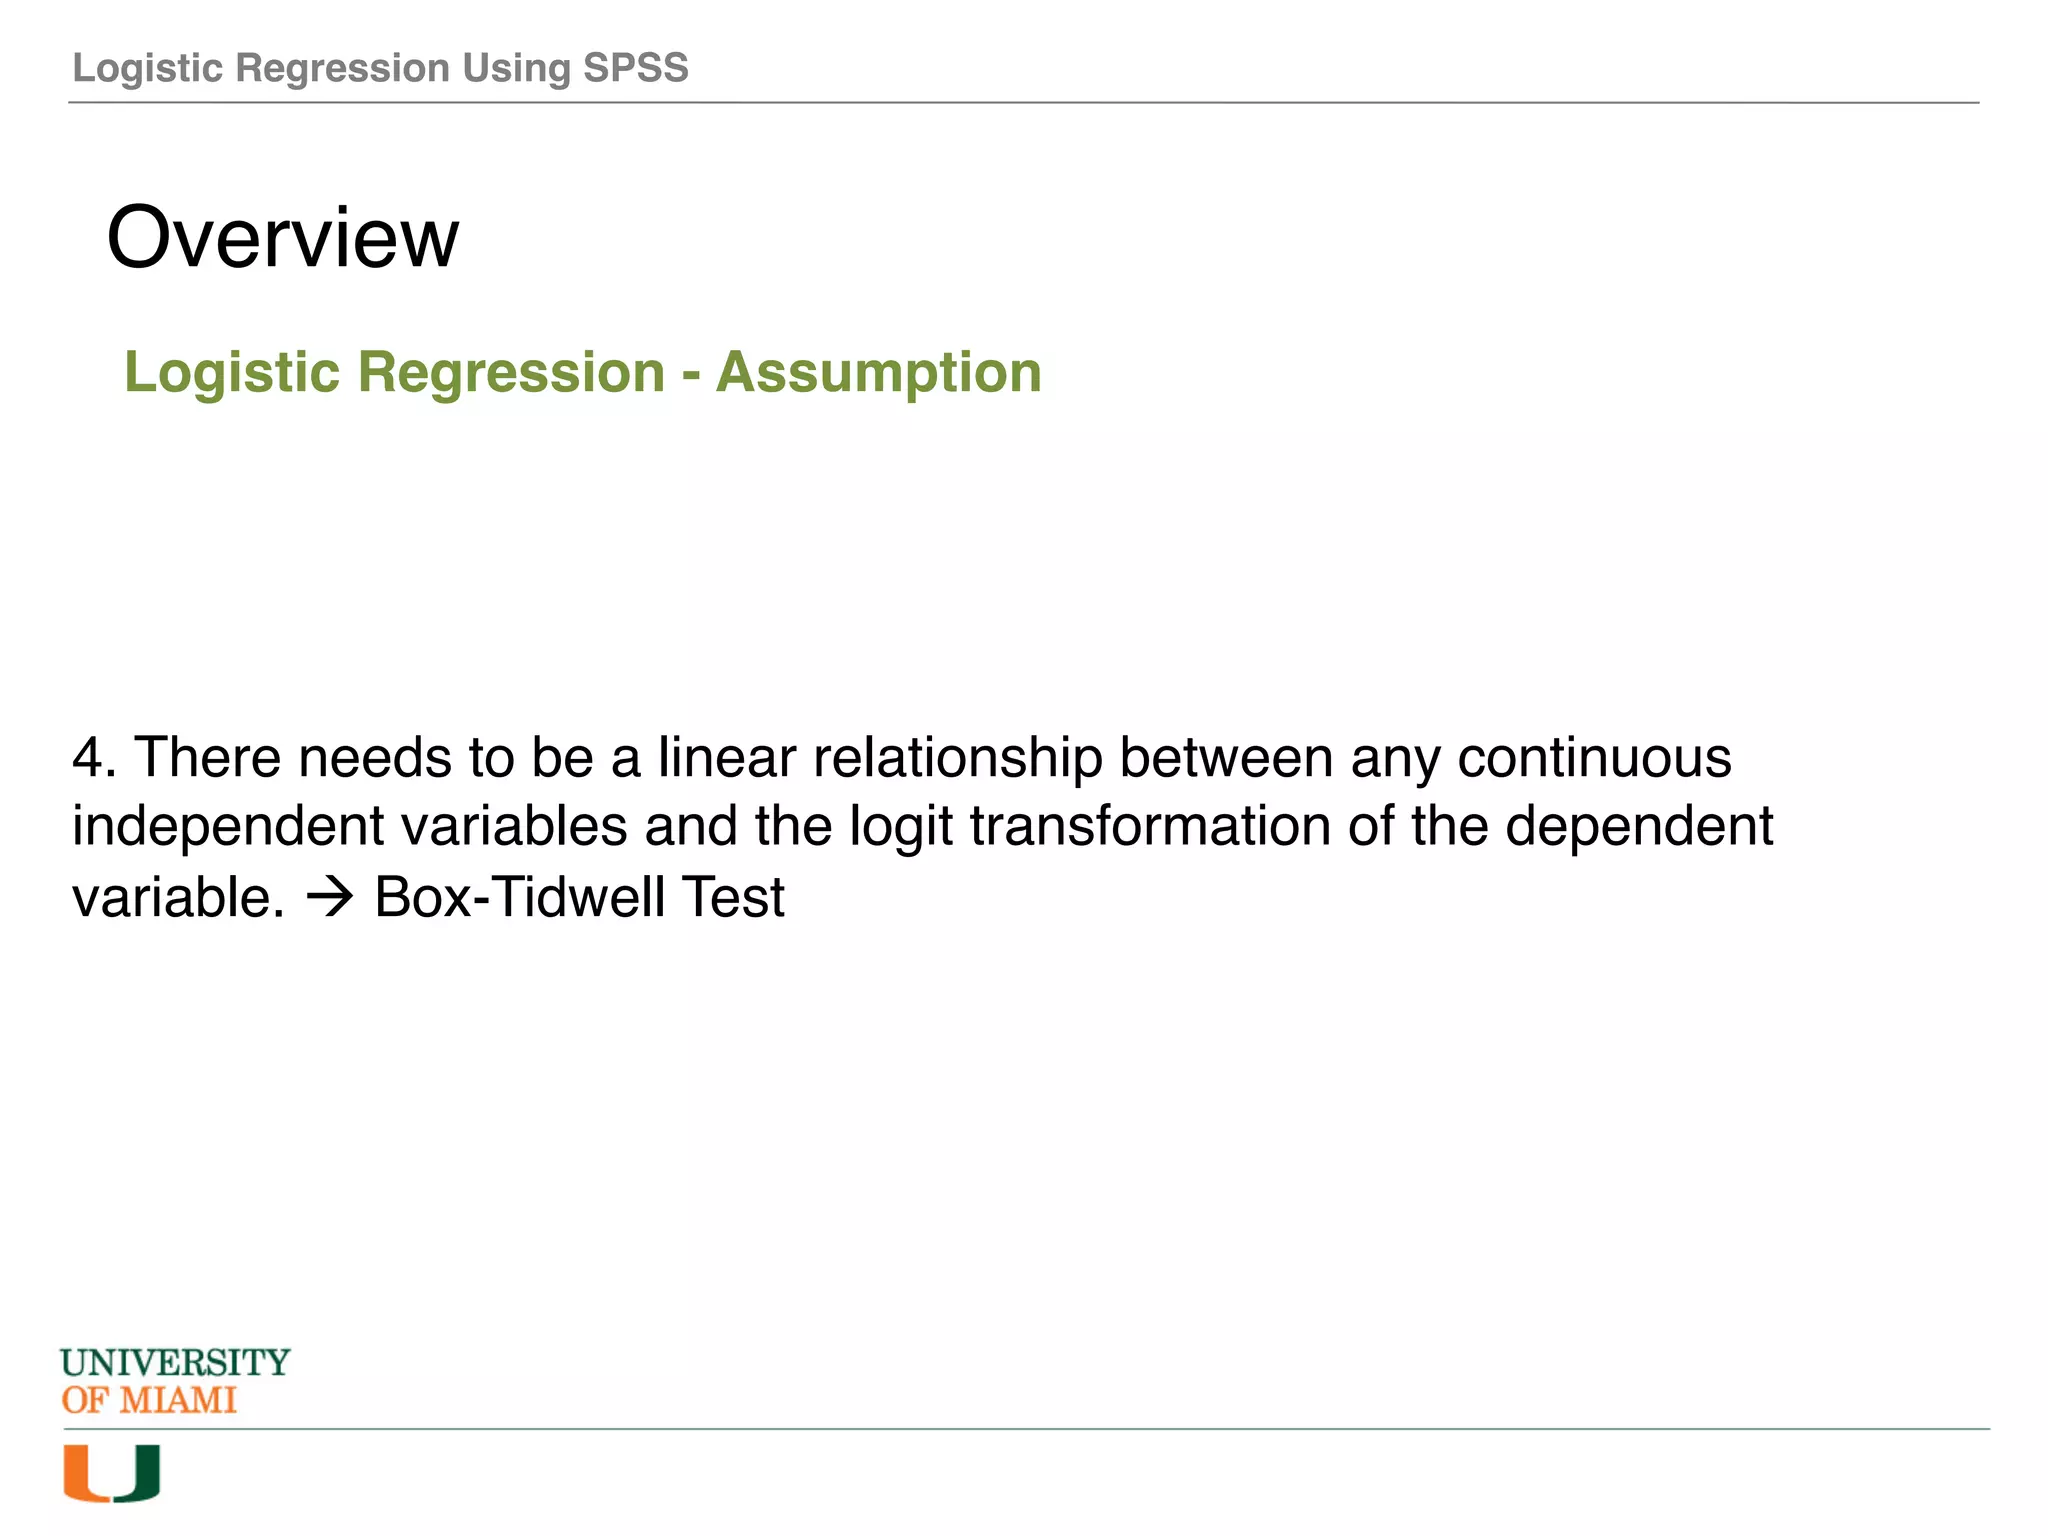
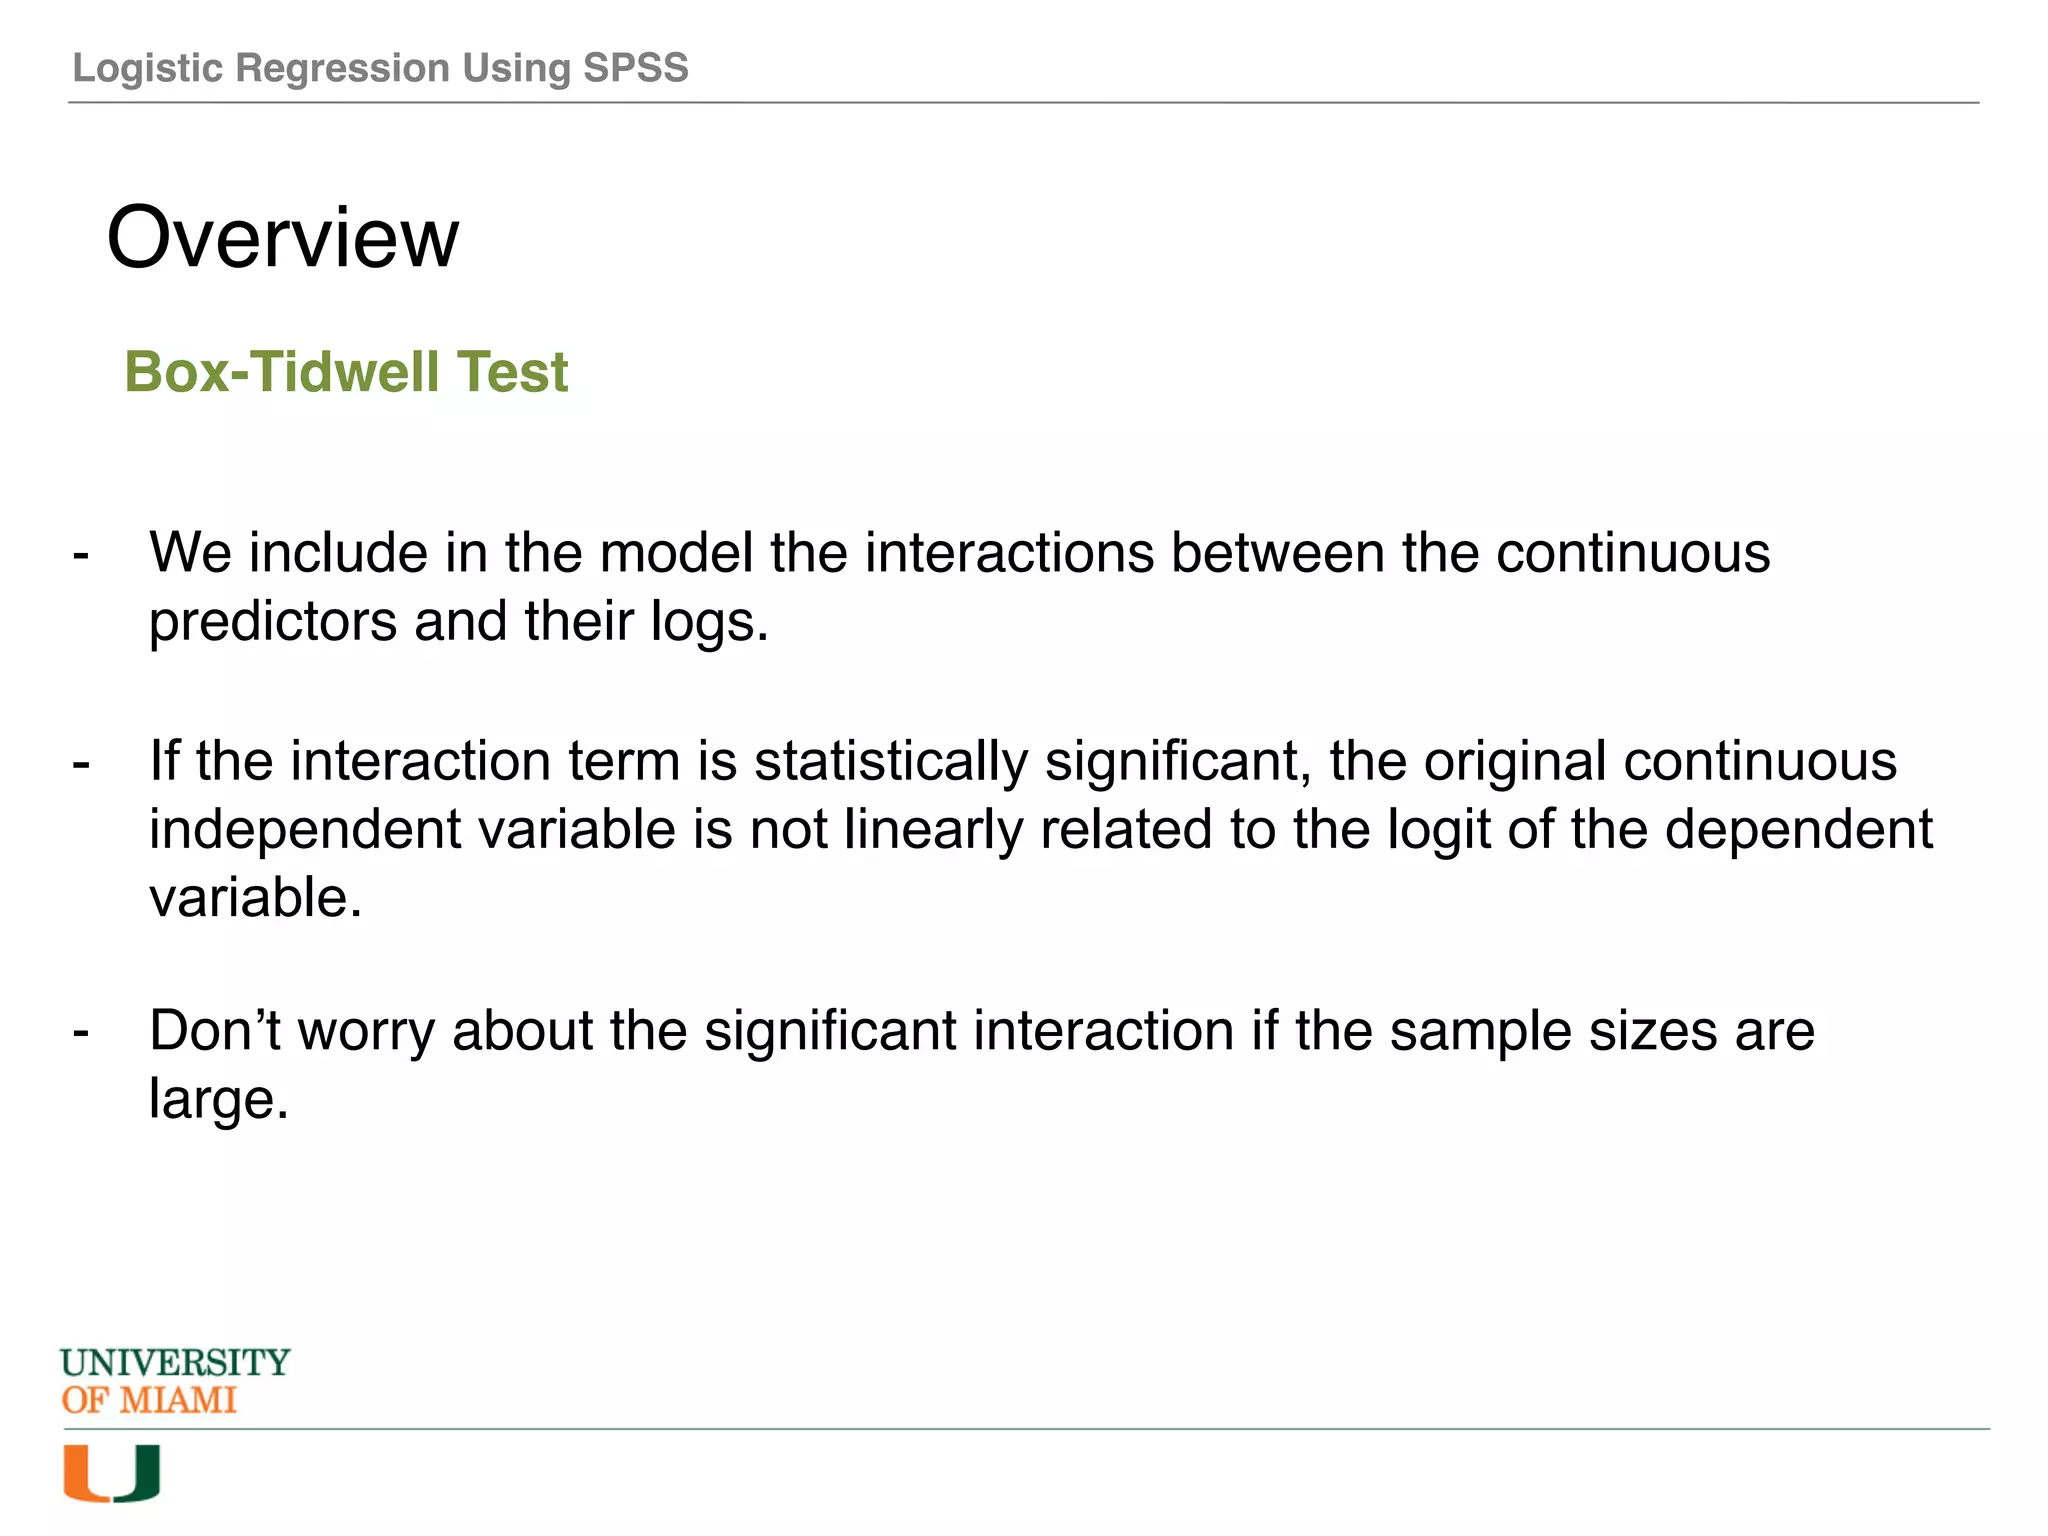
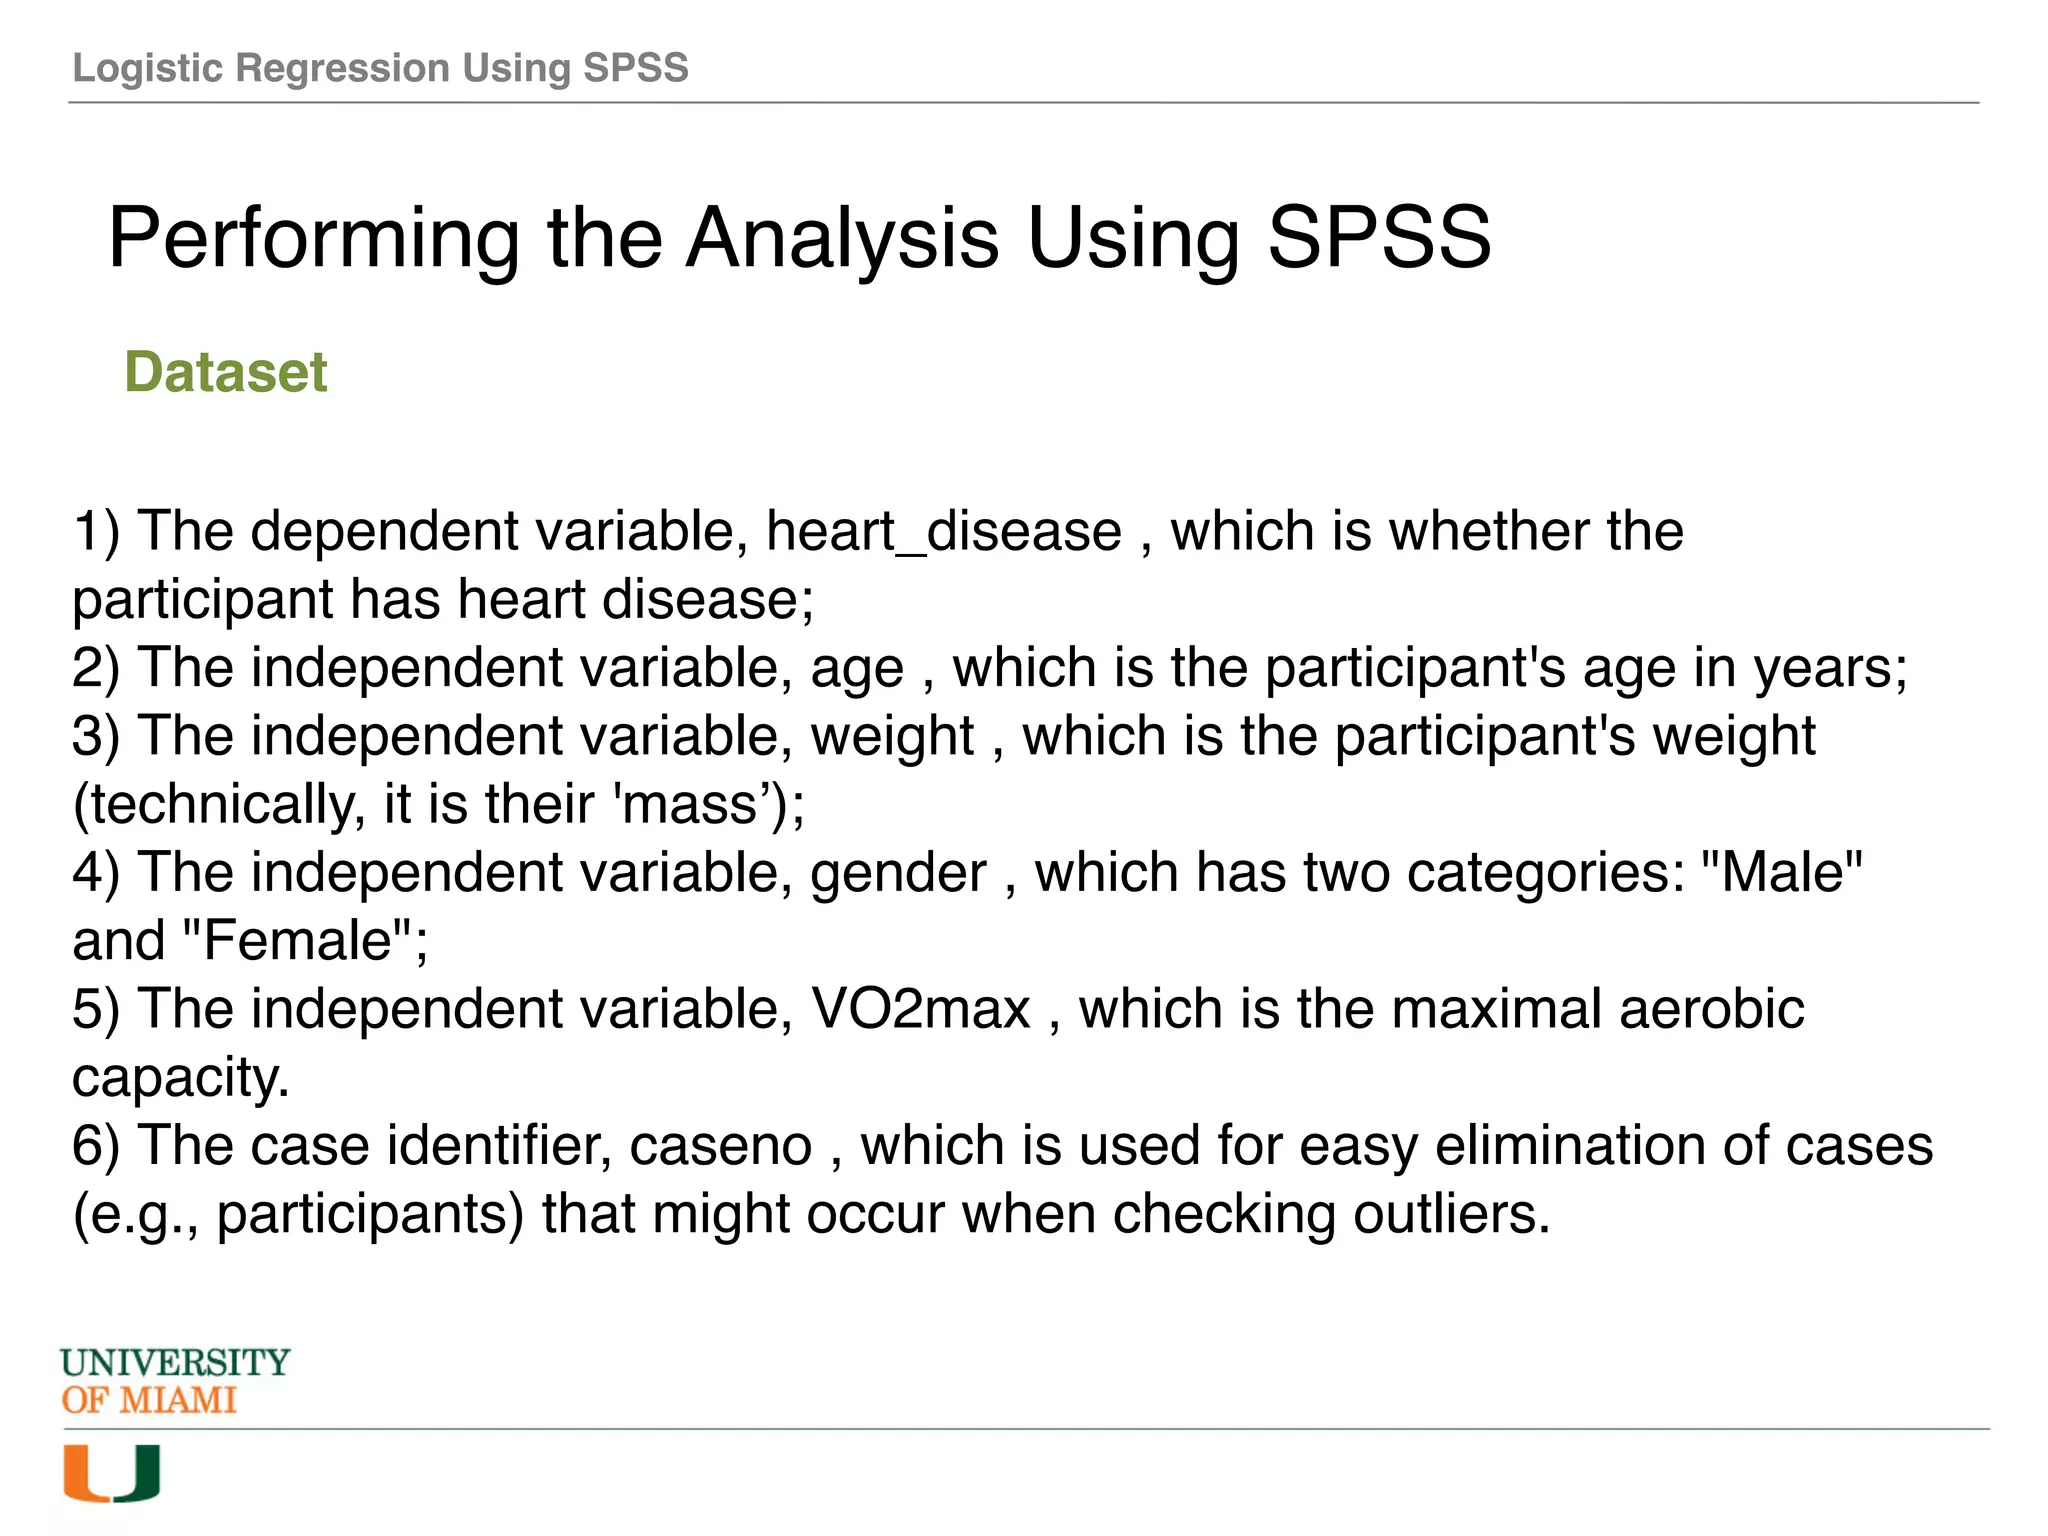
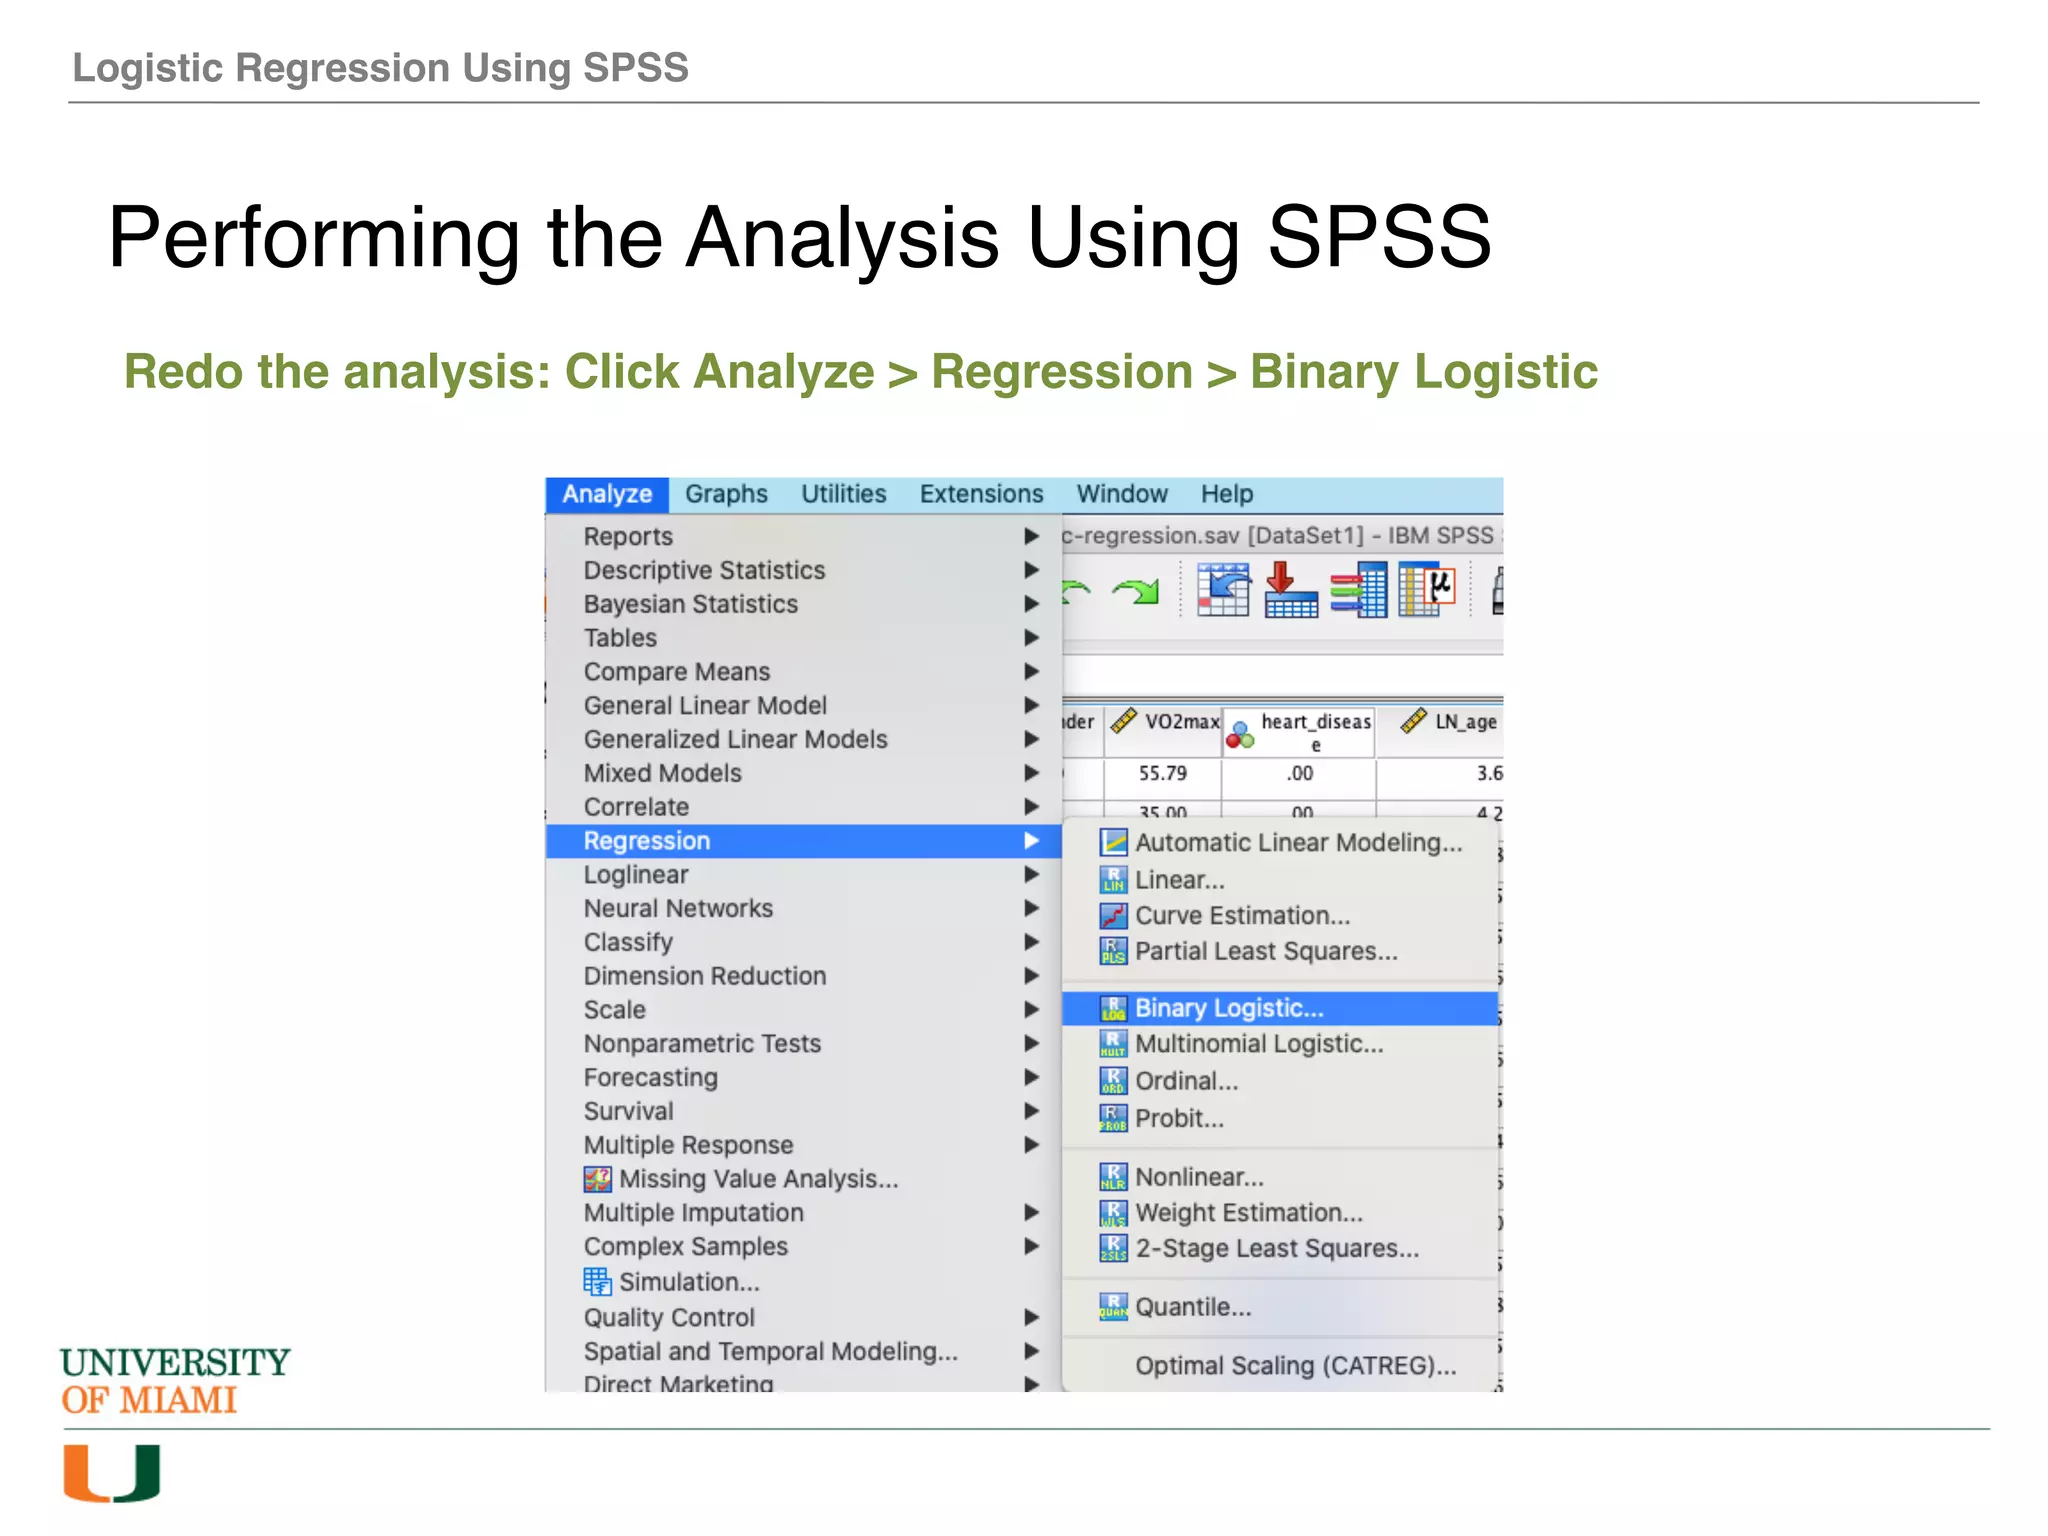
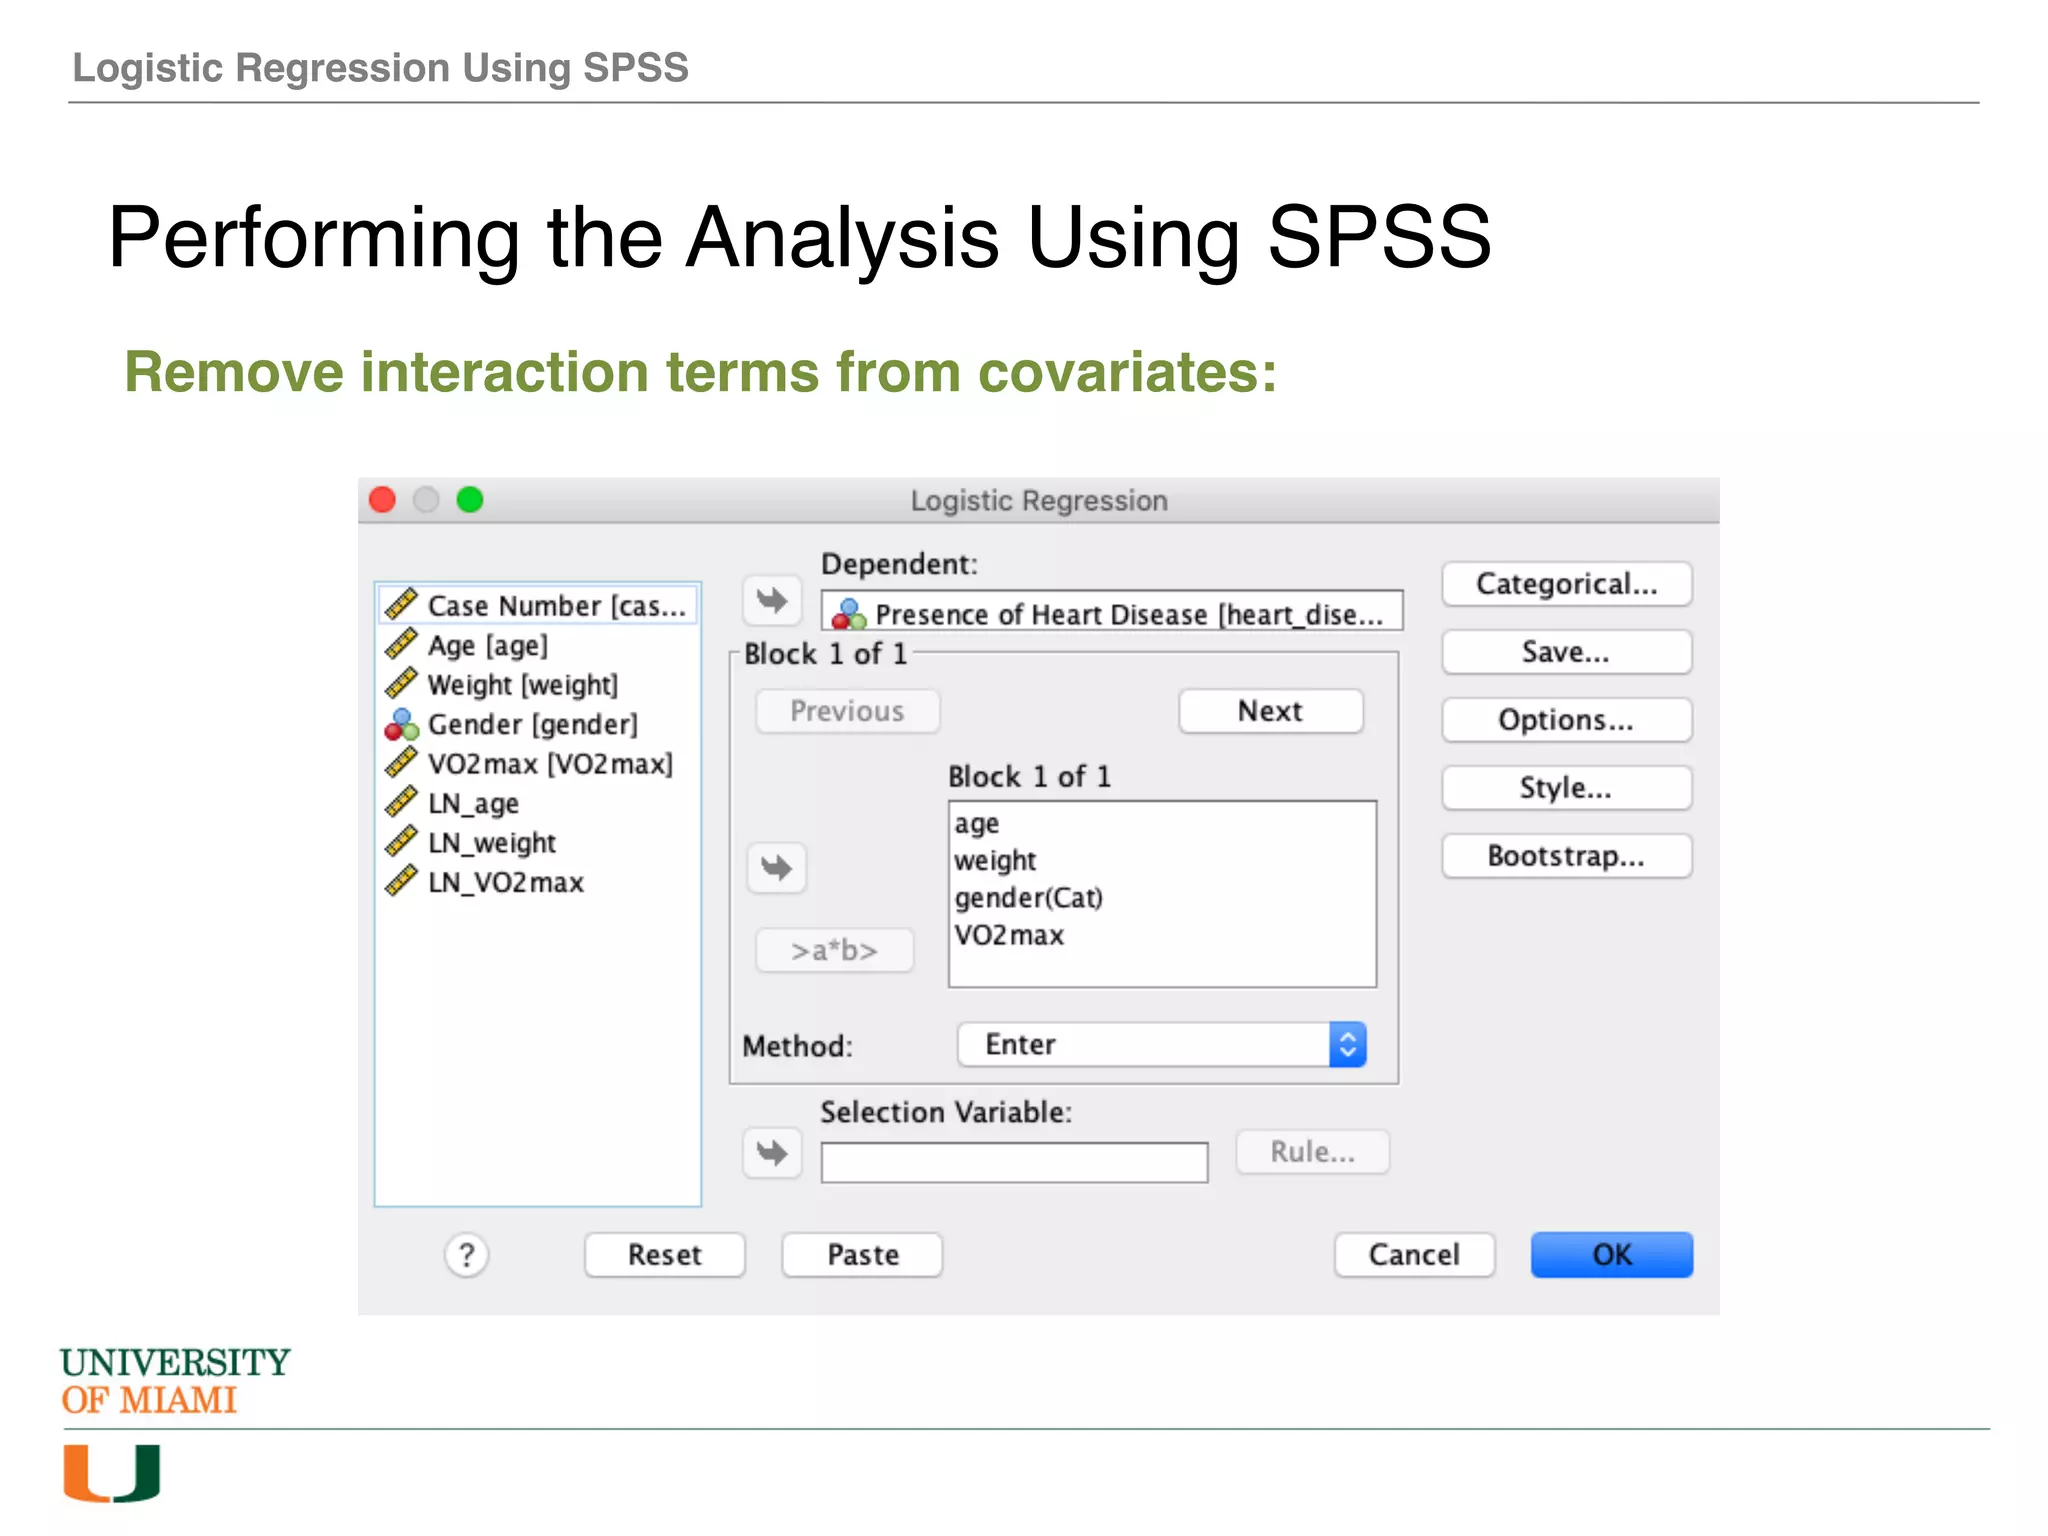
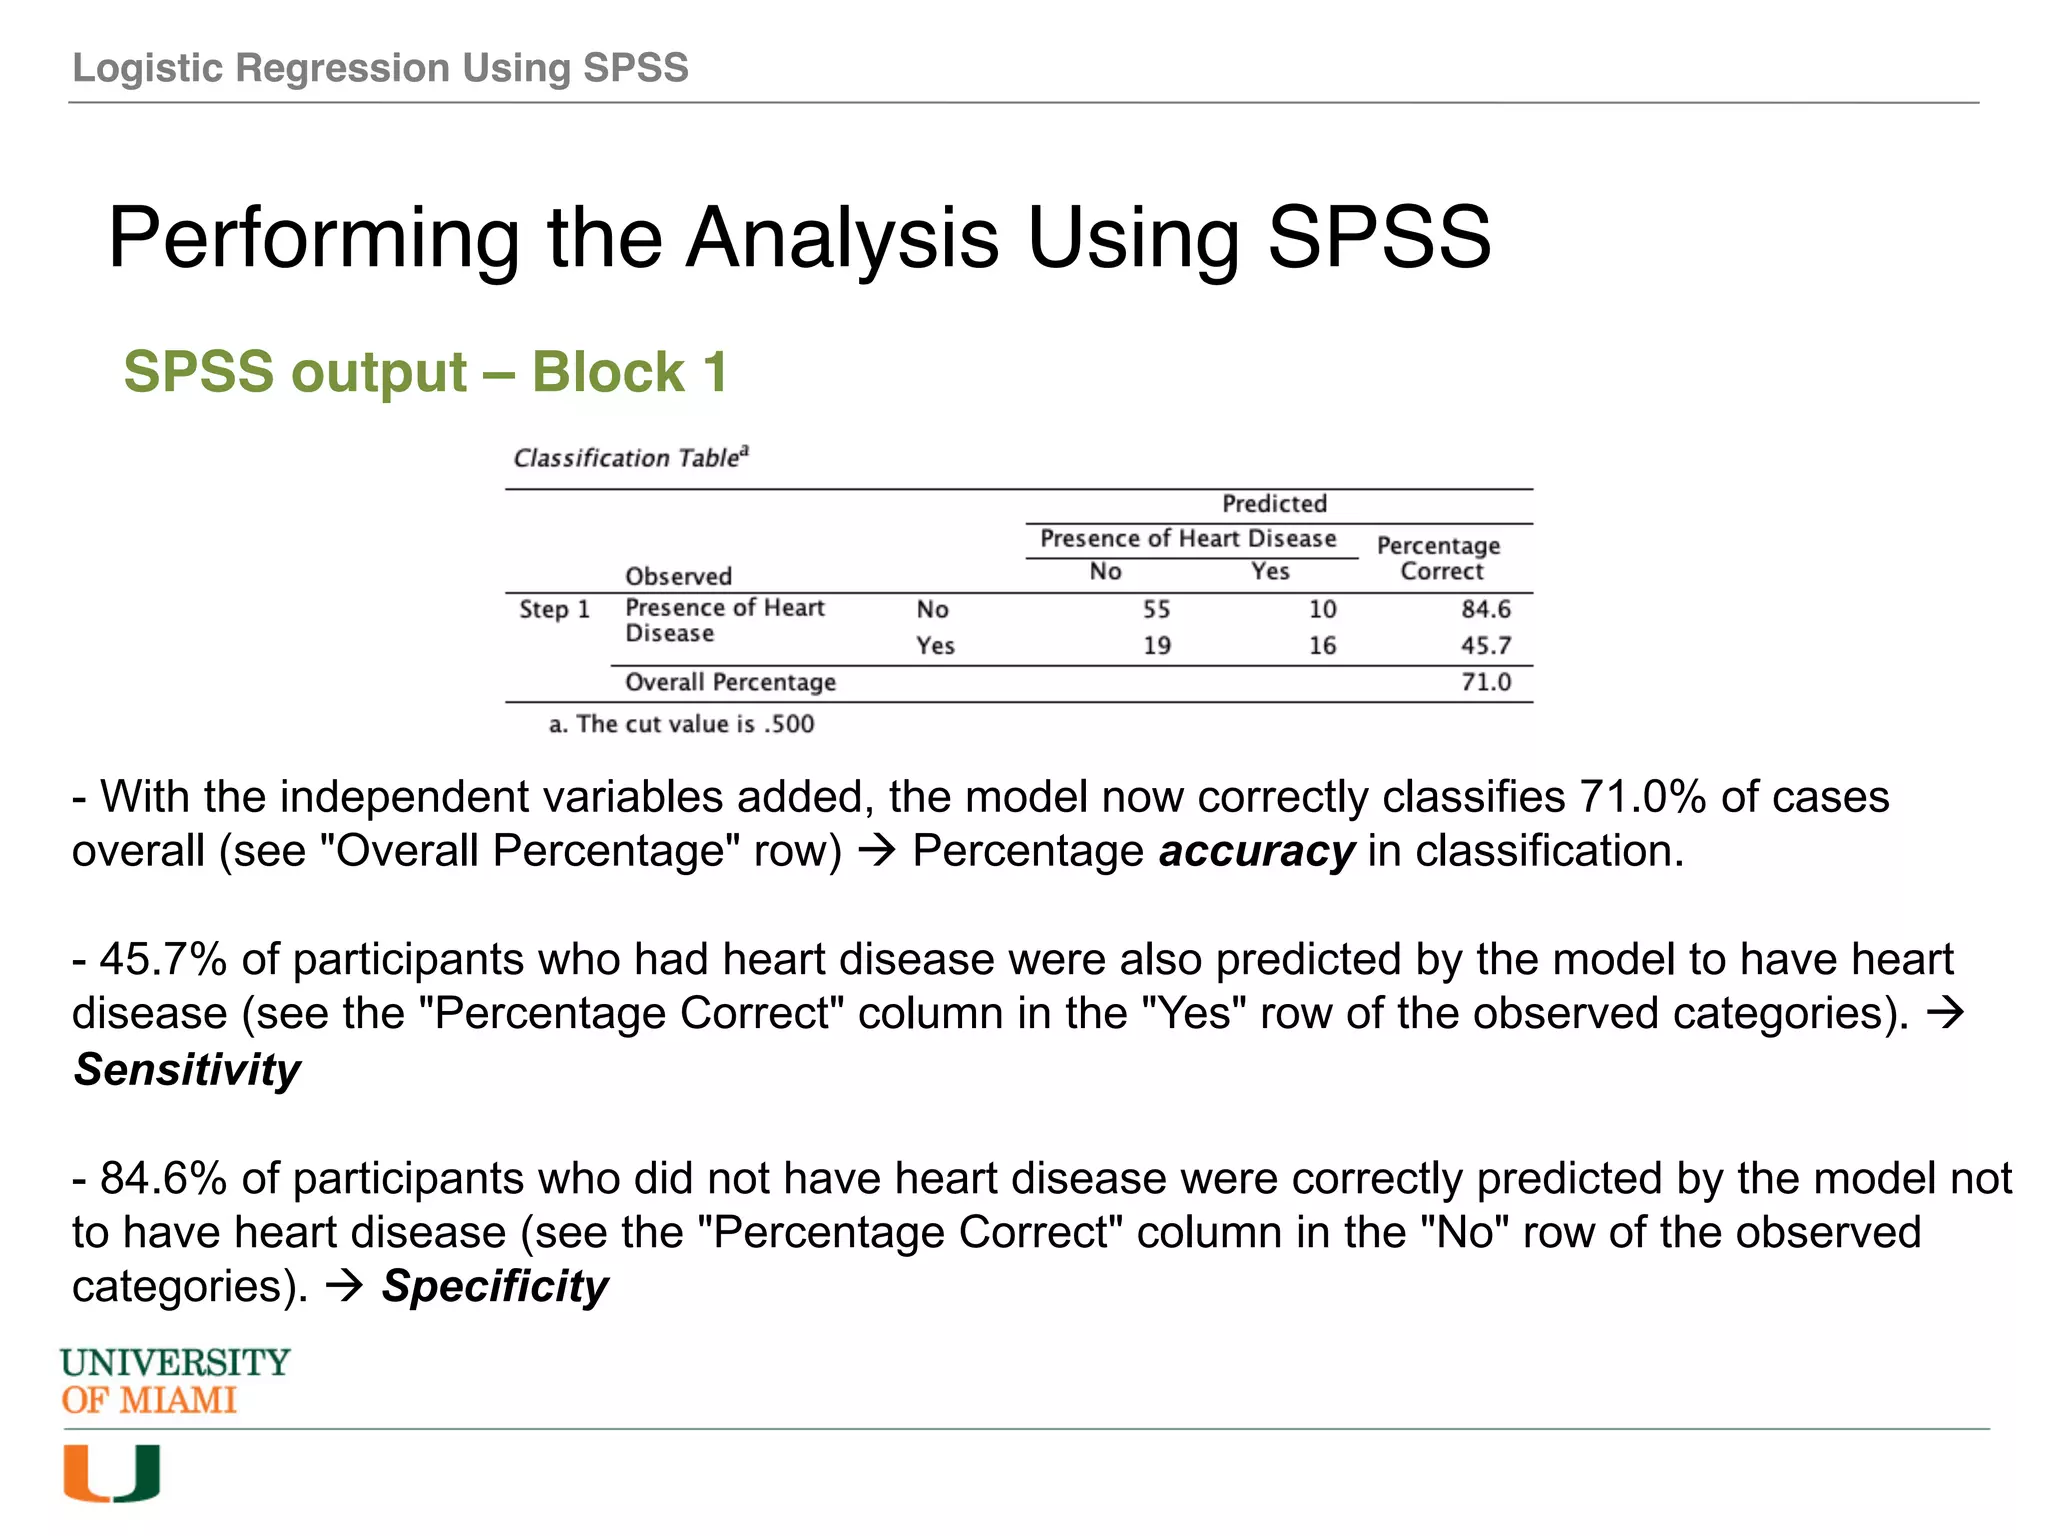
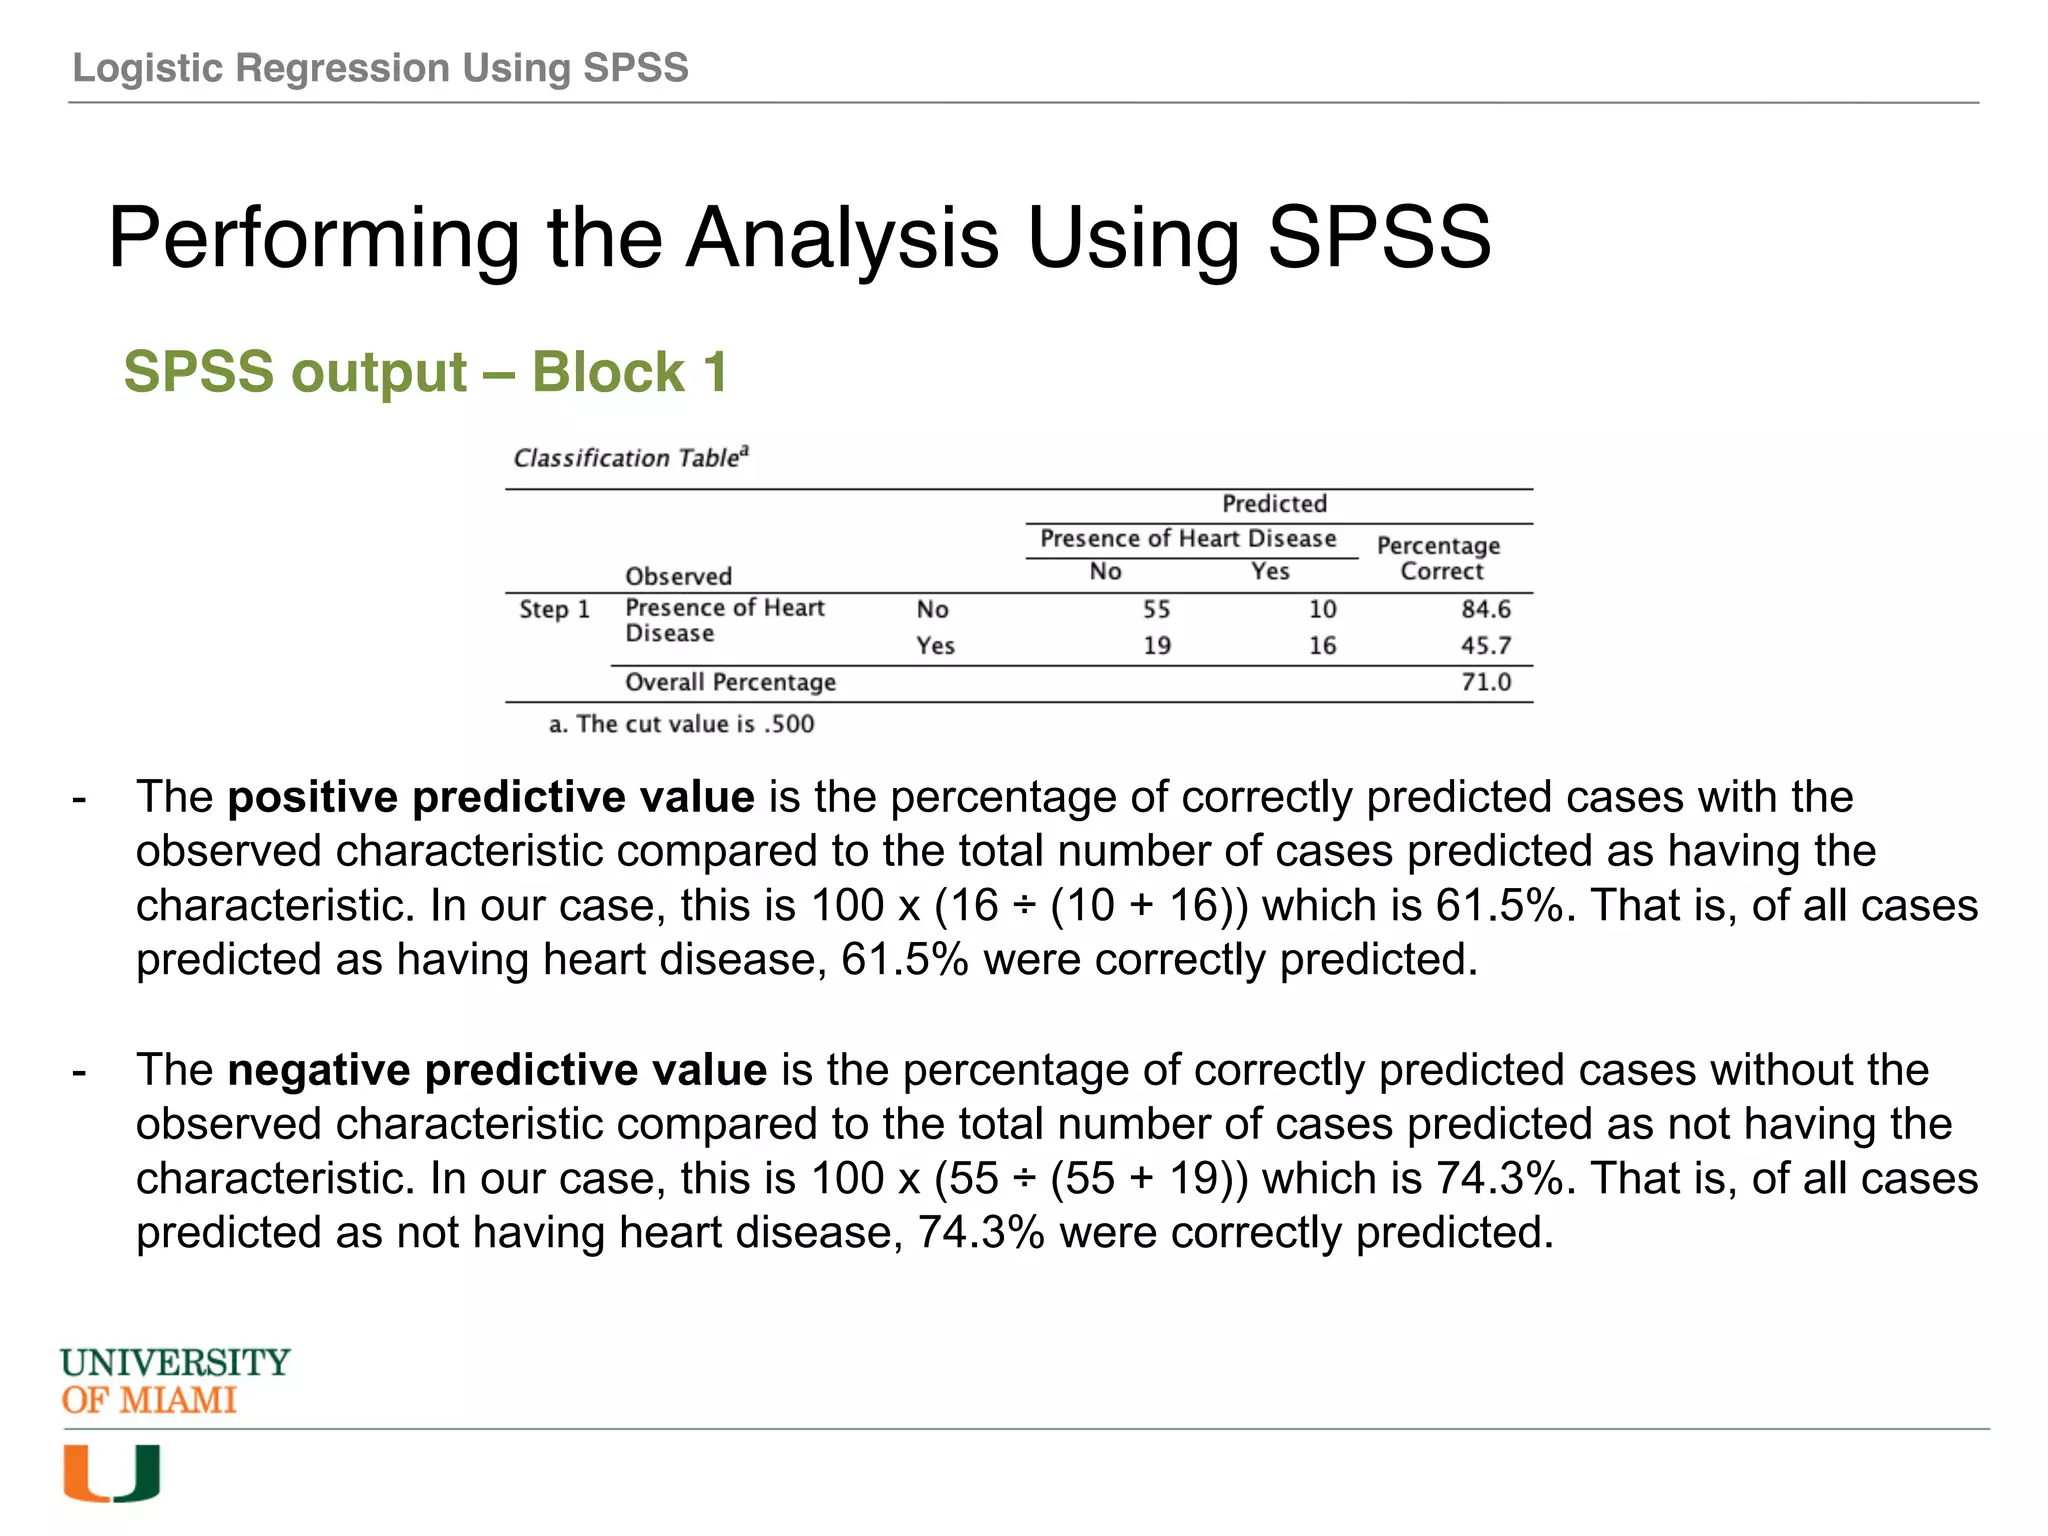
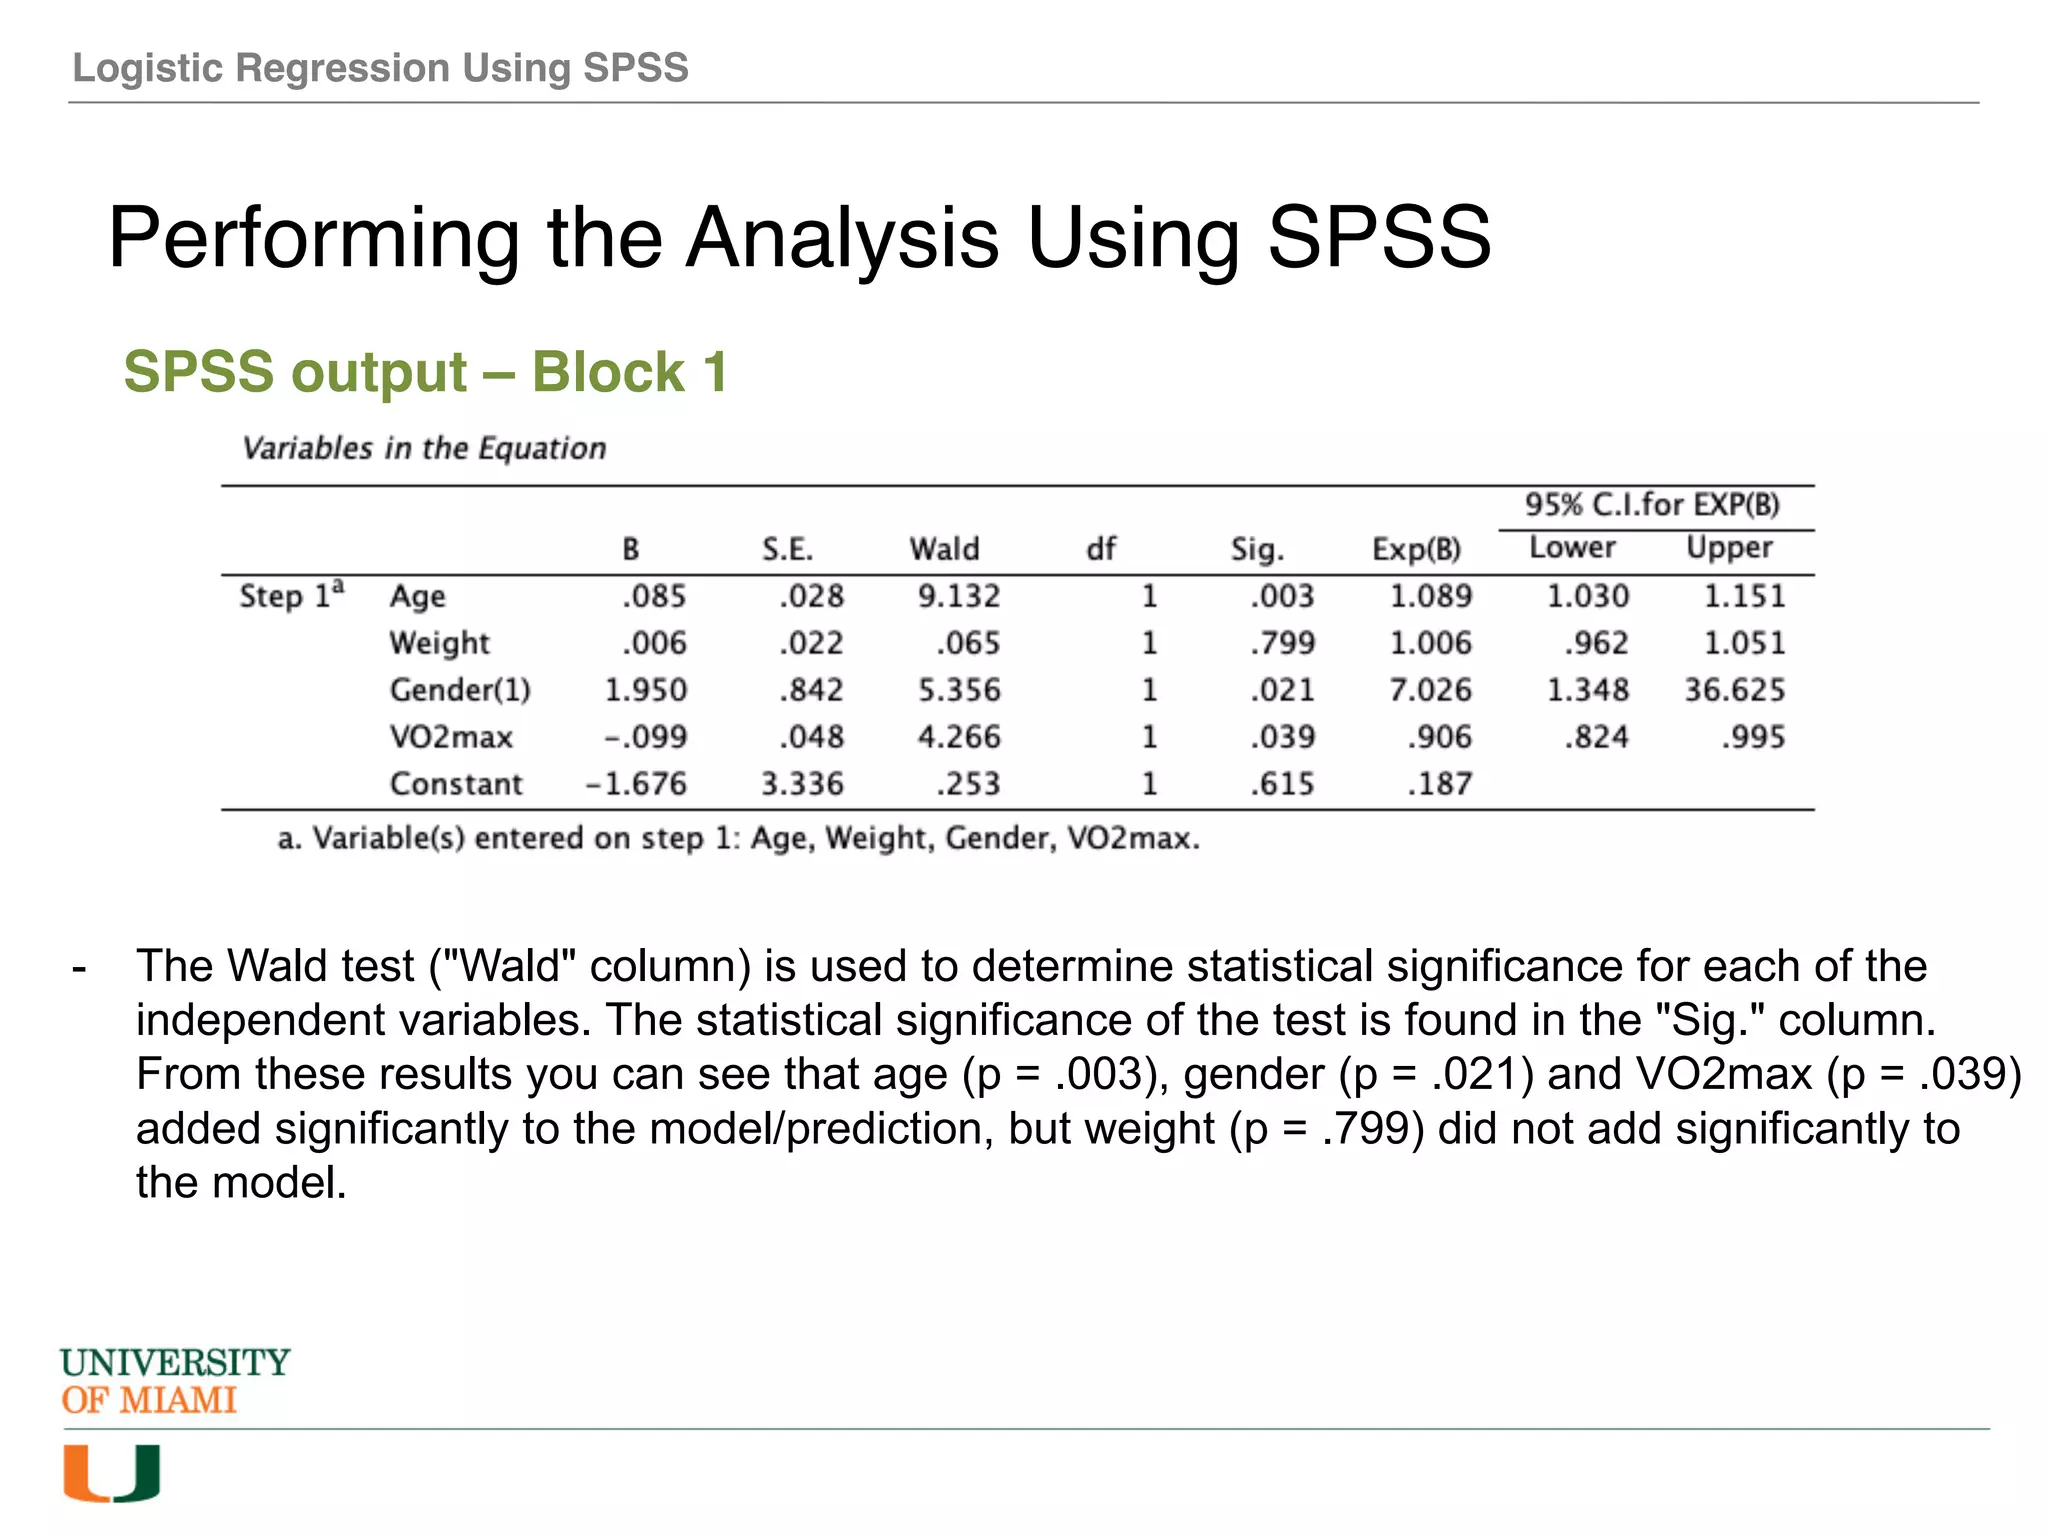
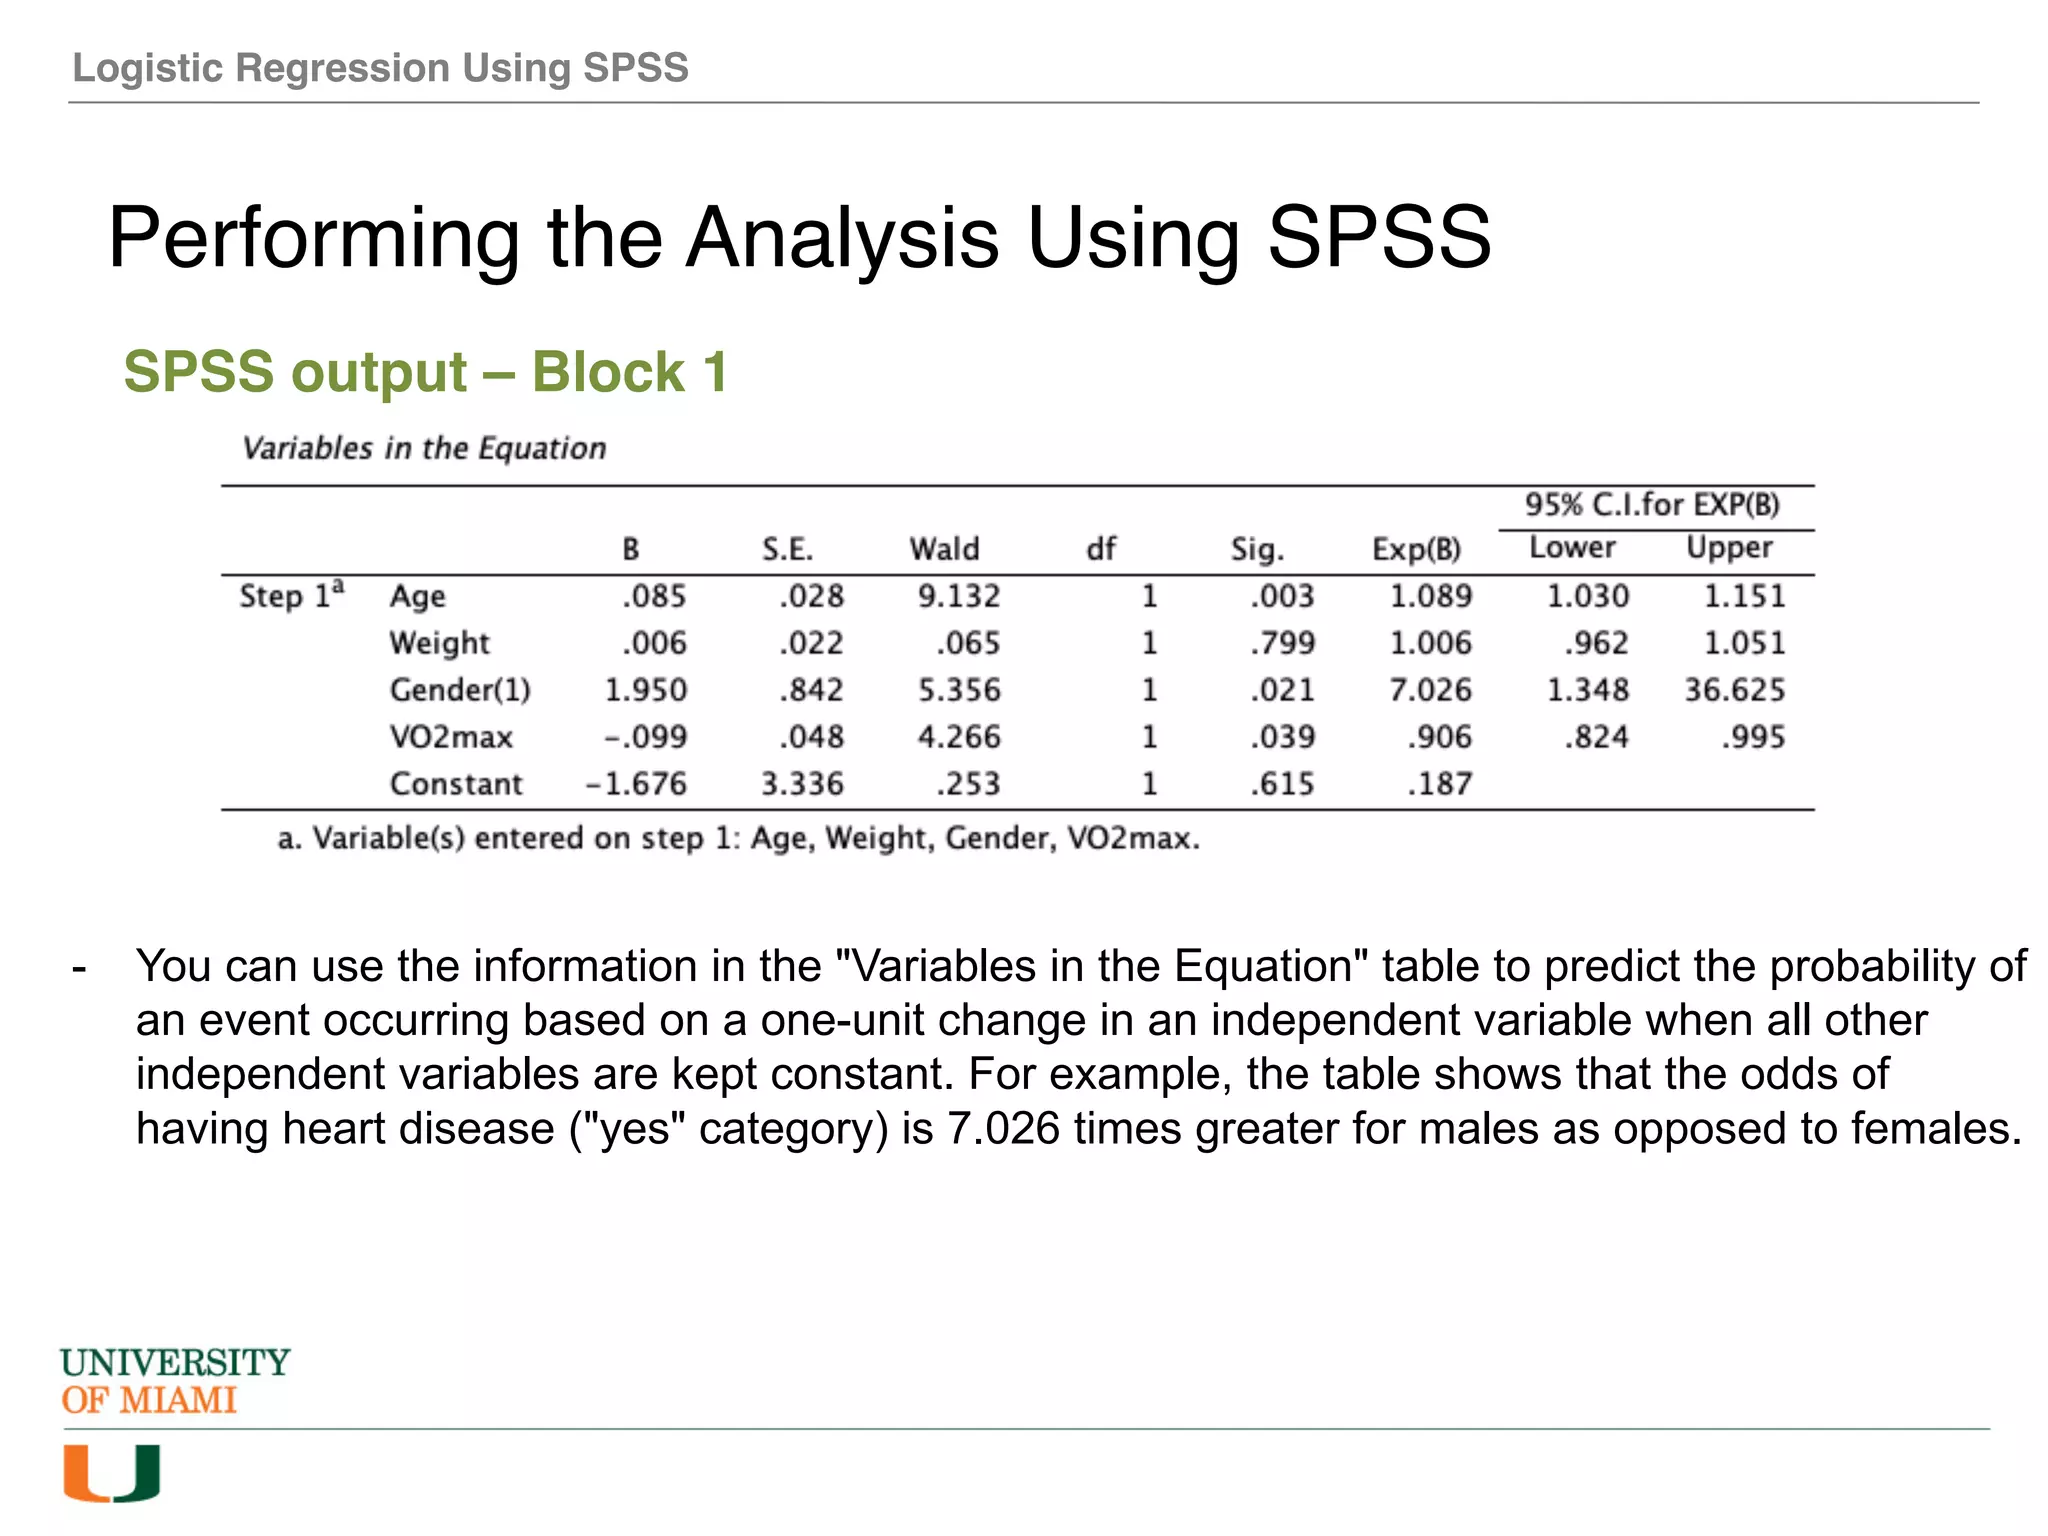
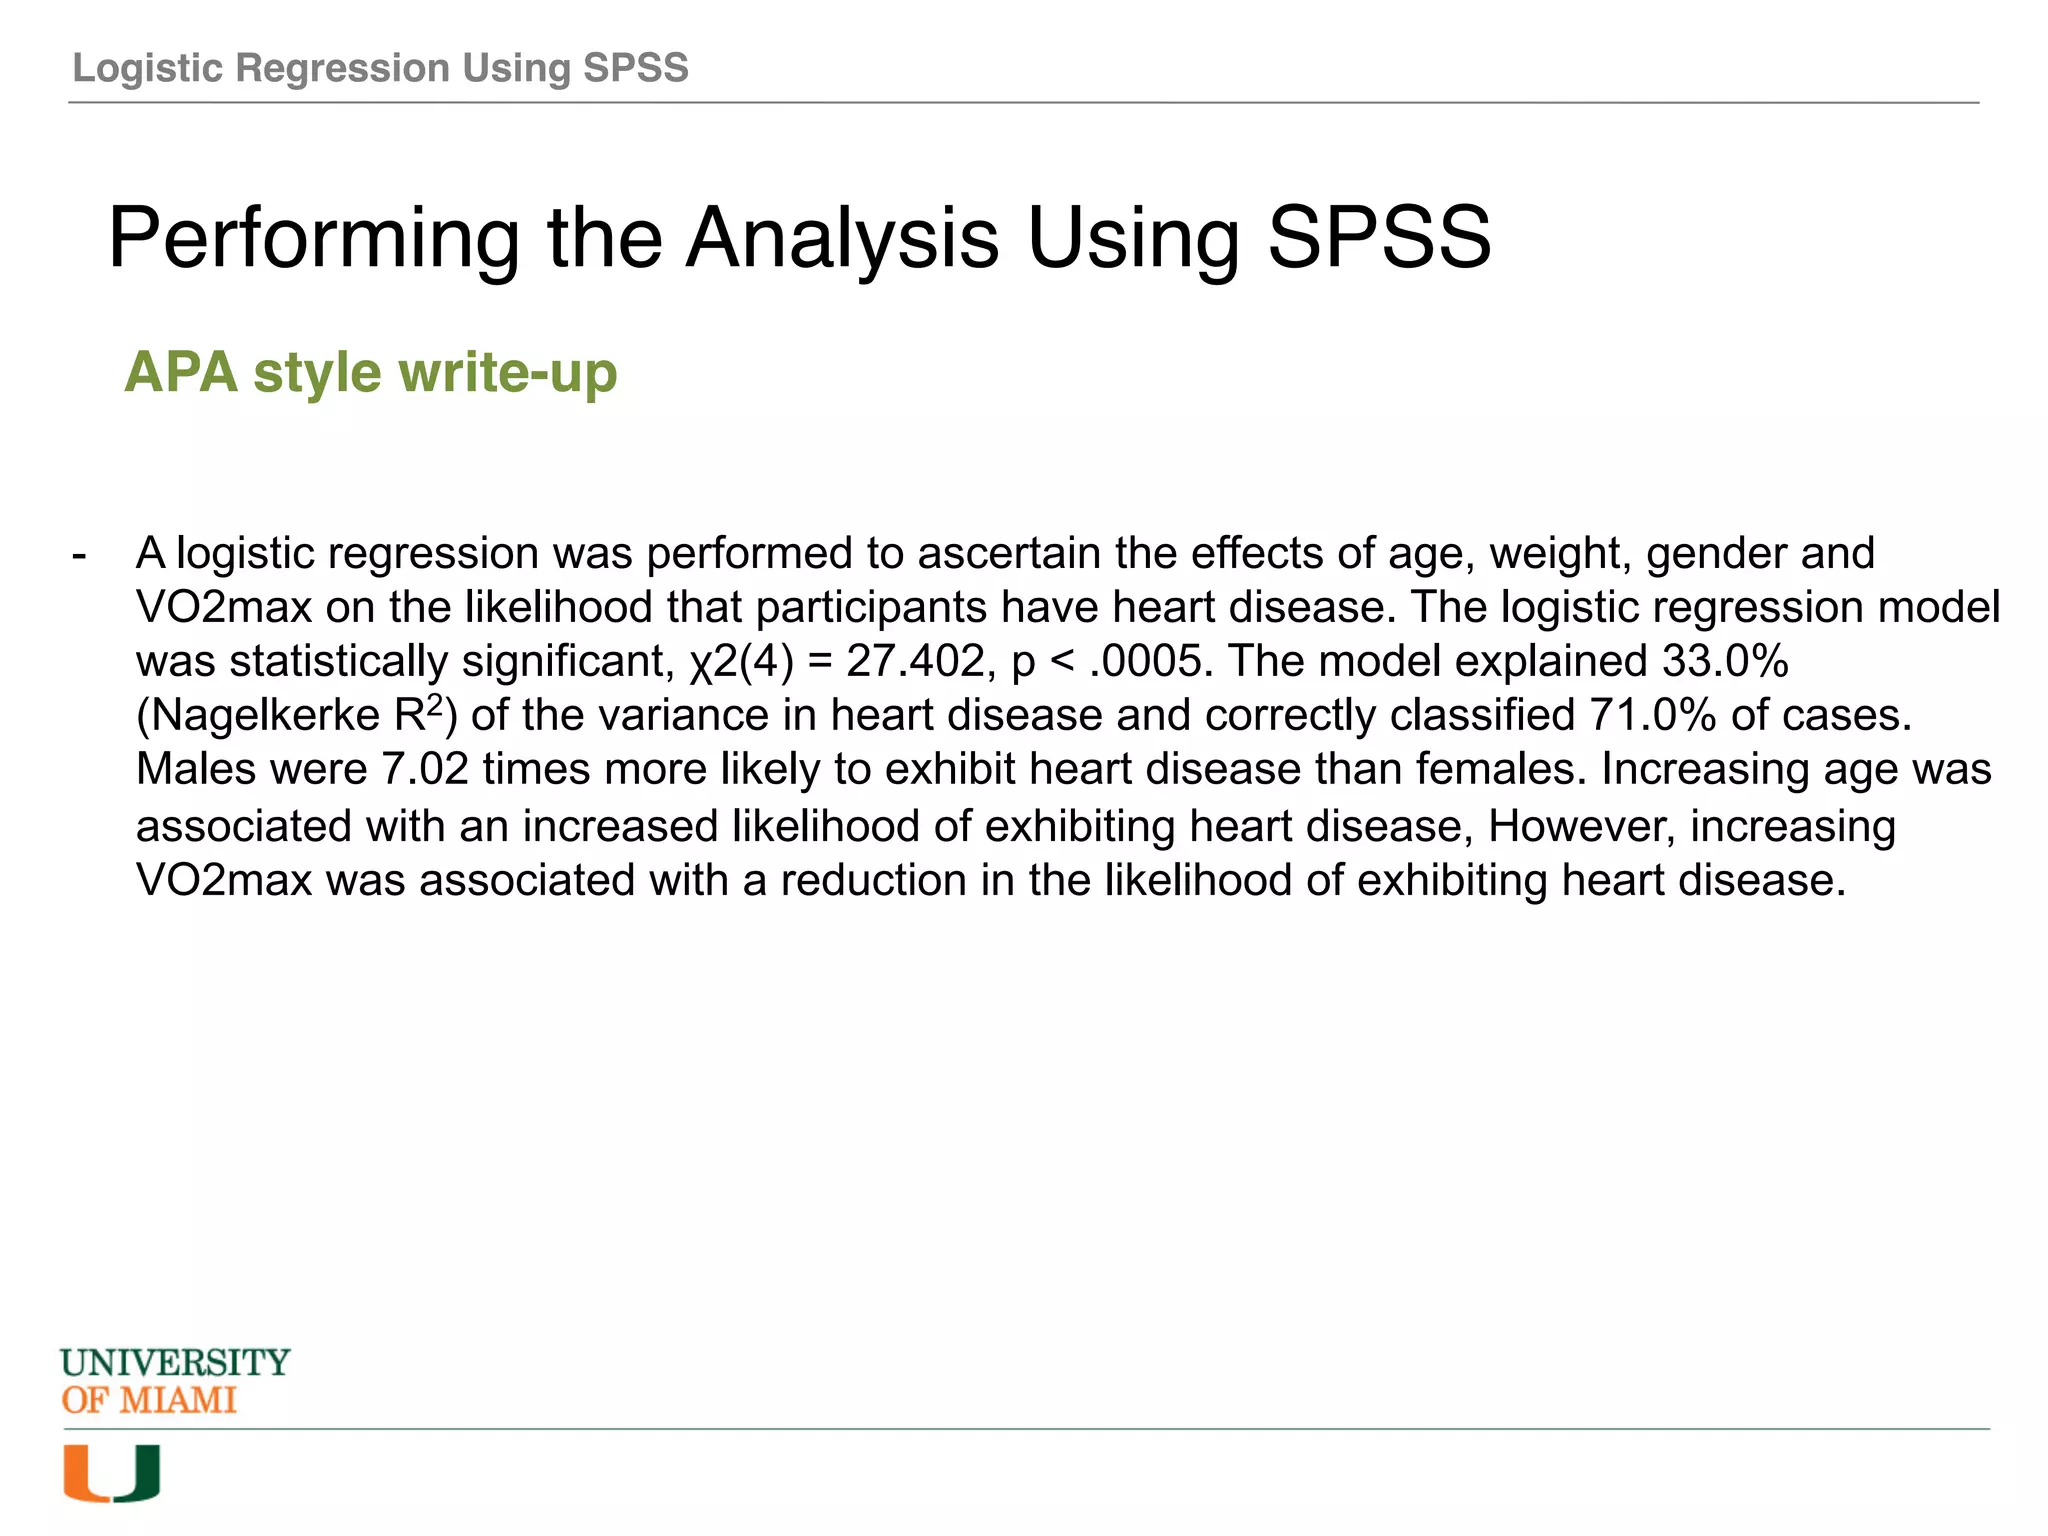
The document provides an overview of how to perform logistic regression analysis in SPSS. It discusses key concepts of logistic regression including using it to predict categorical outcomes from predictor variables. It also reviews assumptions of logistic regression and how to interpret outputs in SPSS including testing model fit and predicting probabilities. The document then demonstrates how to conduct a logistic regression analysis in SPSS to predict heart disease from variables like age, gender and VO2 max.
- Multinomial logistic regression predicts categorical membership in a dependent variable based on multiple independent variables. It is an extension of binary logistic regression that allows for more than two categories.
- Careful data analysis including checking for outliers and multicollinearity is important. A minimum sample size of 10 cases per independent variable is recommended.
- Multinomial logistic regression does not assume normality, linearity or homoscedasticity like discriminant function analysis does, making it more flexible and commonly used. It does assume independence between dependent variable categories.
This document provides guidance on performing and interpreting logistic regression analyses in SPSS. It discusses selecting appropriate statistical tests based on variable types and study objectives. It covers assumptions of logistic regression like linear relationships between predictors and the logit of the outcome. It also explains maximum likelihood estimation, interpreting coefficients, and evaluating model fit and accuracy. Guidelines are provided on reporting logistic regression results from SPSS outputs.
This document provides an overview of forecasting using Eviews 2.0 software. It distinguishes between ex post and ex ante forecasting. Ex post forecasts use known data to evaluate a forecasting model, while ex ante forecasts predict values using uncertain explanatory variables. The document then discusses univariate forecasting methods in Eviews, including trend extrapolation, modeling trend behavior, and analyzing residuals to check assumptions. It provides examples of estimating a trend model, viewing residuals, and making forecasts in Eviews.
This document provides information about non-parametric statistical tests. It discusses the Mann-Whitney U test, chi-square test, and how to perform chi-square tests in SPSS. Key points include:
- Non-parametric tests do not assume a specific data distribution and can be used for small sample sizes, ordinal data, or outliers. Examples include Mann-Whitney U, Kruskal-Wallis, and chi-square tests.
- Chi-square tests independence between two categorical variables. Assumptions include frequencies data and expected counts over 5 in 80% of cells.
- To perform a chi-square test in SPSS, select two categorical variables, choose crosstabs
Statistics For Data Analytics - Multiple & logistic regression Shrikant Samarth
Task: To build multiple regression and logistic regression models on appropriate data.
Approach: A general topic was selected first after which the data was downloaded from the source keeping the restrictions in mind and then cleaned in R. Then the multiple regression and logistic regression models were built using IBM SPSS and the outputs were interpreted. The dependent variable was life expectancy and the independent variables were Age-standardized Mortality-Communicable”, “Age-standardized Mortality-Cardiovascular Disease and Diabetes".
Findings: Multipleregression - analysis was conducted to make sure normality, linearity, multi-collinearity, independence of errors and homoscedasticity were not violated. Statistically, the score of Life expectancy at age 60, 퐹(2,102) = 39.474 푅2 = .436, 푝 < 0.0005
Logistic Regression: Result shows 58.9% (Cox & Snell R-Square) and 80.1% (Nagelkerke R-Square) of the variance and gives 92.4% of correctly classified countries. The two indicating factors made a remarkable commitment to the model. Also, the model predicts the increase in “Mortality-Cardiovascular/Diabetes” and “Mortality rate cause by Communicable” variables is the cause of a decrease in Life Expectancy in a country.
Tools: IBM SPSS
This document summarizes quantitative data analysis techniques. It discusses how to summarize data using simple statistics like means and standard deviations. It also covers effect statistics that summarize relationships between variables, such as slopes from regression. Statistical tests like t-tests and ANOVA are used to generalize sample results to populations and assess statistical significance. Precision is expressed using confidence intervals rather than just p-values. More complex models can also be reduced to these foundational analyses.
Binary OR Binomial logistic regression Dr Athar Khan
Binary logistic regression can be used to model the relationship between predictor variables and a binary dependent variable. The document discusses using logistic regression to predict the likelihood of clients terminating counseling early based on gender, income level, avoidance of disclosure, and symptom severity. The full model was statistically significant and correctly classified 84.4% of cases. Avoidance of disclosure and symptom severity significantly predicted early termination, while gender and income level were not significant predictors.
Histograms and Descriptive Statistics Scoring GuideCRITERIANON.docxpooleavelina
Histograms and Descriptive Statistics Scoring Guide
CRITERIA
NON-PERFORMANCE
BASIC
PROFICIENT
DISTINGUISHED
Apply the appropriate SPSS procedures for creating histograms to generate relevant output.
Does not provide SPSS output.
Provides SPSS output with errors.
Applies the appropriate SPSS procedures for creating histograms to generate relevant output.
Analyzes the histogram output, demonstrating insight and understanding of relevant data.
Interpret histogram results, including concepts of skew, kurtosis, outliers, symmetry, and modality.
Does not provide an interpretation of histogram results.
Provides an interpretation of histogram results.
Interprets histogram results, including concepts of skew, kurtosis, outliers, symmetry, and modality.
Evaluates histogram results, including concepts of skew, kurtosis, outliers, symmetry, and modality.
Analyze the strengths and limitations of examining a distribution of scores with a histogram.
Does not identify the strengths and limitations of examining a distribution of scores with a histogram.
Identifies the strengths and limitations of examining a distribution of scores with a histogram.
Analyzes the strengths and limitations of examining a distribution of scores with a histogram.
Evaluates the strengths and limitations of examining a distribution of scores with a histogram. Demonstrates insight and understanding of relevant data.
Apply the appropriate SPSS procedure for generating descriptive statistics to generate relevant output.
Does not provide SPSS output.
Includes some, but not all, of the required output. Numerous errors in SPSS output.
Applies the appropriate SPSS procedure for generating descriptive statistics to generate relevant output.
Applies the appropriate SPSS procedure for generating descriptive statistics to generate relevant output. Includes all relevant output; no irrelevant output is included. No errors in SPSS output.
Analyze meaningful versus meaningless variables reported in descriptive statistics.
Does not identify meaningful versus meaningless variables reported in descriptive statistics.
Identifies meaningful versus meaningless variables reported in descriptive statistics.
Analyzes meaningful versus meaningless variables reported in descriptive statistics.
Evaluates meaningful versus meaningless variables reported in descriptive statistics.
Interpret descriptive statistics for meaningful variables.
Does not identify meaningful variables.
Identifies meaningful variables.
Interprets descriptive statistics for meaningful variables.
Evaluates descriptive statistics for meaningful variables.
Apply the appropriate SPSS procedures for creating z scores and descriptive statistics to generate relevant output.
Does not provide SPSS output.
Provides SPSS output with errors.
Applies the appropriate SPSS procedures for creating z scores and descriptive statistics to generate relevant output.
Analyzes the z scores and descriptive statistics output, demonstrating insight and understand ...
1) The document discusses how to perform a one-way ANOVA analysis in SPSS to determine if the means of three populations are statistically different.
2) It provides an example comparing the weights of maize plants that received different fertilizer treatments (biological, chemical, none).
3) The one-way ANOVA analysis found that the mean weights were statistically different between the three fertilizer groups, with the chemical fertilizer producing the highest average weight.
Advice On Statistical Analysis For Circulation ResearchNancy Ideker
This document provides an overview and review of statistical methods for analyzing cardiovascular research data. It discusses common statistical errors in previous decades, such as low statistical power and inadequate analysis of repeated measures studies. It introduces several statistical methods that are useful but not always familiar to cardiologists, including power analysis, methods for analyzing repeated measures, analysis of covariance, multivariate analysis of variance, nonparametric tests, and more. The goal is to help researchers choose the appropriate statistical tests and properly interpret the results.
This document provides an overview of descriptive statistics and inferential statistics. Descriptive statistics are used to describe basic features of data through simple summaries, while inferential statistics are used to make inferences about populations based on samples. Examples of descriptive statistics include measures of central tendency, dispersion, frequency distributions and contingency tables. Inferential statistics allow for comparisons between groups and populations through techniques like t-tests, analysis of variance, regression analysis, and other general linear models.
This document provides an overview of descriptive statistics and inferential statistics. Descriptive statistics are used to describe basic features of data through simple summaries, while inferential statistics are used to make generalizations beyond the sample data. Key concepts covered include measures of central tendency and dispersion, the general linear model, dummy variables, experimental and quasi-experimental designs, analysis of variance, analysis of covariance, and regression analysis.
The document discusses descriptive statistics and inferential statistics. Descriptive statistics are used to describe basic features of data through simple summaries, while inferential statistics are used to make inferences beyond the sample data to general populations. Some common descriptive statistics are measures of central tendency, dispersion, frequency, and contingency tables. Inferential statistics allow for comparisons between groups and determining the probability of observed differences occurring by chance. Regression analysis is also discussed as a technique used to model relationships between dependent and independent variables and understand how changes in independent variables impact the dependent variable.
The document discusses recoding variables and conducting ANOVA in SPSS. It explains that the SPSS data editor contains two windows: the data view allows data entry and viewing with variables in columns, while the variable view defines variable types with variables in rows. It describes how to recode variables into the same or different variables, and provides an example of recoding age into categories. It also explains how to conduct a one-way ANOVA to compare group means and test hypotheses, and provides an example comparing fertilizer treatments using ANOVA.
This document provides instructions for conducting a factor analysis in SPSS. It describes screening the data by examining correlations between variables to identify any that do not correlate well. It recommends having a sample size over 300 and communalities above 0.5. The analysis is run using principal component analysis. Factors are extracted based on eigenvalues over 1 or a fixed number. An orthogonal rotation like varimax is typically used to improve interpretability of the factors. Factor scores can optionally be saved.
This document defines key statistical terms and concepts. It discusses populations and samples, measures of central tendency like mean and median, measures of variation like standard deviation and coefficient of variation, distributions like Gaussian and standard normal, and methods of analyzing data like linear regression and correlation coefficient. Uncertainty analysis is also covered, including identifying possible outliers using z-scores and Chauvenet's criterion.
This document discusses how to analyze data and perform various statistical tests using SPSS software. It explains how to open data files, enter data, and access the SPSS data editor window. It then covers determining descriptive statistics like frequencies, means, and medians. Finally, it demonstrates how to conduct t-tests, ANOVA, correlation analysis, linear regression, and create scatter plots in SPSS.
The document describes how to conduct and interpret a one-way repeated measures ANOVA in SPSS. It discusses the key assumptions, provides a worked example using data from a word memory experiment, and walks through interpreting the SPSS output. The example ANOVA found a significant effect of word list on words remembered, with participants remembering more words from unrelated lists compared to phonologically related lists.
This document provides information about ISO 9001 and ISO 22000 standards for quality management systems and food safety management systems. It includes definitions of ISO 9001 and ISO 22000, lists of quality tools like Ishikawa diagrams, histograms, Pareto charts, scatter plots, check sheets and control charts. It also provides additional related topics and resources for ISO 9001 and 22000 certification and implementation.
This document provides an overview of various SAS procedures and techniques for data analysis. It covers topics such as SAS input/output, functions in data step, simple statistics procedures, hypothesis testing for means and proportions, multiple linear regression, generalized linear regression, cluster analysis, association analysis, logistic regression, and more. The document serves as a reference guide for using SAS to perform common statistical analyses and predictive modeling.
This document provides an overview of methods for data analysis. It discusses data, descriptive statistics such as measures of central tendency and dispersion, inferential statistics including hypothesis testing and probability, and statistical software packages with a focus on SPSS. SPSS allows users to easily input, manage, and analyze data to obtain summary statistics and perform inferential analyses like t-tests, ANOVA, and regression. Outputs can be copied into reports.
The document provides information about ISO 9001 certification requirements and quality management tools. It includes details on MATRADE's ISO 9001 certification and describes various quality tools like Ishikawa diagrams, histograms, Pareto charts, scatter plots, check sheets, and control charts. Additional links are given for free resources on implementing ISO 9001 standards and templates.
Multinomial logisticregression basicrelationshipsAnirudha si
This document provides an overview of multinomial logistic regression. It discusses how multinomial logistic regression compares multiple groups through binary logistic regressions. It describes how to interpret the results, including evaluating the overall relationship between predictors and the dependent variable and relationships between individual predictors and the dependent variable. Requirements and assumptions of the analysis are explained, such as the dependent variable being non-metric and cases-to-variable ratios. Methods for evaluating model accuracy and usefulness are also outlined.
The document provides an overview of ISO 9001 quality management systems and includes information on forms, checklists, and procedures related to ISO 9001 implementation. It also lists various quality management tools like Ishikawa diagrams, histograms, Pareto charts, and control charts. Other topics related to ISO 9001 certification, requirements, training, and standards are referenced for further reading.
The document discusses the benefits of ISO 9001 certification for quality management systems, including improved internal processes and management. It provides an overview of ISO 9001 and lists several quality tools used in the standard like Ishikawa diagrams, histograms, Pareto charts, scatter plots, check sheets and control charts. Additional related topics are also listed for further reading.
Your Paper was well written, however; I need you to follow the frochellscroop
Your Paper was well written, however; I need you to follow the following Analysis Guidance for Intervention Data. I will give you a passing grade when you submit with these by the 26th of April at 1pm EST
This document is designed to provide a summary of the key steps for analysing intervention data. The main analysis is conducted using the general linear model function in SPSS. This document does not cover how to clean data for analysis. (Data for the PARS module has already been cleaned so students do not have to undertake this part of the analysis.) This document is written with the PARS assignment in mind, so please refer to statistical texts for details on how to check assumptions, and a broader overview of how to interpret the output of intervention analyses in SPSS.
Preparing Scales
When using scales, ensure you compute scale reliabilities (Cronbachs Alpha using the function Analyse>Scale>Reliability analysis). Make sure scales are recoded as required by the specific scale you’re using. If you find poor reliability, that might indicate scale items have not been coded as required (e.g. a scale item may need reverse coding). If scale reliability is poor, then you may want to exclude it from the analysis, remove a low-loading item, or report why you think the reliability is poor and justify why you decided to include it. Scale items should be aggregated or averaged using the compute variable function in SPSS (Transform>Compute variable) for the main analysis, as directed by the scale authors. (For the PARS assignment, scale reliability statistics can be reported in the appendix.)
Calculating Means and Standard Deviations
It is useful at this stage to calculate the means and standard deviations for the data using the function Analyse>Descriptive Statistics. For intervention data comparing more than one condition, you need to isolate a condition in the dataset before generating the means and standard deviations for that condition. The analyses testing the effect of an intervention with individuals in different conditions (i.e. between-subject) are essentially testing whether there is a significant difference in the means of groups in different conditions. The means for the different conditions show whether levels are increasing or decreasing, and this is useful for interpreting the results of the analysis.
Isolate study conditions using the function Data>Select cases, and use the function ‘If condition satisfied’. In the PARS data, use cohort as the variable in the rule (i.e. ‘Cohort = 1’ for the intervention group, or ‘Cohort = 2’ for the control group). When you have either of these rules applied, SPSS will only run the analysis on the cases selected by that rule. For example, if the rule applied is ‘Cohort = 1’ only cases with the value 1 in the cohort variable will be included in the analysis.
Bivariate Correlations
As part the analysis, you need to run bivariate correlations. Use the function Analyse>Correlate>Bivariate. (For ...
Predictably Improve Your B2B Tech Company's Performance by Leveraging DataKiwi Creative
Harness the power of AI-backed reports, benchmarking and data analysis to predict trends and detect anomalies in your marketing efforts.
Peter Caputa, CEO at Databox, reveals how you can discover the strategies and tools to increase your growth rate (and margins!).
From metrics to track to data habits to pick up, enhance your reporting for powerful insights to improve your B2B tech company's marketing.
- - -
This is the webinar recording from the June 2024 HubSpot User Group (HUG) for B2B Technology USA.
Watch the video recording at https://youtu.be/5vjwGfPN9lw
Sign up for future HUG events at https://events.hubspot.com/b2b-technology-usa/
State of Artificial intelligence Report 2023kuntobimo2016
Artificial intelligence (AI) is a multidisciplinary field of science and engineering whose goal is to create intelligent machines.
We believe that AI will be a force multiplier on technological progress in our increasingly digital, data-driven world. This is because everything around us today, ranging from culture to consumer products, is a product of intelligence.
The State of AI Report is now in its sixth year. Consider this report as a compilation of the most interesting things we’ve seen with a goal of triggering an informed conversation about the state of AI and its implication for the future.
We consider the following key dimensions in our report:
Research: Technology breakthroughs and their capabilities.
Industry: Areas of commercial application for AI and its business impact.
Politics: Regulation of AI, its economic implications and the evolving geopolitics of AI.
Safety: Identifying and mitigating catastrophic risks that highly-capable future AI systems could pose to us.
Predictions: What we believe will happen in the next 12 months and a 2022 performance review to keep us honest.
STATATHON: Unleashing the Power of Statistics in a 48-Hour Knowledge Extravag...sameer shah
"Join us for STATATHON, a dynamic 2-day event dedicated to exploring statistical knowledge and its real-world applications. From theory to practice, participants engage in intensive learning sessions, workshops, and challenges, fostering a deeper understanding of statistical methodologies and their significance in various fields."
Beyond the Basics of A/B Tests: Highly Innovative Experimentation Tactics You...Aggregage
This webinar will explore cutting-edge, less familiar but powerful experimentation methodologies which address well-known limitations of standard A/B Testing. Designed for data and product leaders, this session aims to inspire the embrace of innovative approaches and provide insights into the frontiers of experimentation!
Codeless Generative AI Pipelines
(GenAI with Milvus)
https://ml.dssconf.pl/user.html#!/lecture/DSSML24-041a/rate
Discover the potential of real-time streaming in the context of GenAI as we delve into the intricacies of Apache NiFi and its capabilities. Learn how this tool can significantly simplify the data engineering workflow for GenAI applications, allowing you to focus on the creative aspects rather than the technical complexities. I will guide you through practical examples and use cases, showing the impact of automation on prompt building. From data ingestion to transformation and delivery, witness how Apache NiFi streamlines the entire pipeline, ensuring a smooth and hassle-free experience.
Timothy Spann
https://www.youtube.com/@FLaNK-Stack
https://medium.com/@tspann
https://www.datainmotion.dev/
milvus, unstructured data, vector database, zilliz, cloud, vectors, python, deep learning, generative ai, genai, nifi, kafka, flink, streaming, iot, edge
3. Logistic Regression Using SPSS
Overview
Logistic Regression
- Logistic regression is used to predict a categorical (usually
dichotomous) variable from a set of predictor variables.
- For a logistic regression, the predicted dependent variable is a function
of the probability that a particular subject will be in one of the
categories.
4. Logistic Regression Using SPSS
Overview
Logistic Regression - Examples
- A researcher wants to understand whether exam performance (passed
or failed) can be predicted based on revision time, test anxiety and
lecture attendance.
- A researcher wants to understand whether drug use (yes or no) can be
predicted based on prior criminal convictions, drug use amongst friends,
income, age and gender.
5. Logistic Regression Using SPSS
Overview
Logistic Regression - Assumption
1. Your dependent variable should be measured on a dichotomous scale.
2. You have one or more independent variables, which can be either
continuous or categorical.
3. You should have independence of observations and the dependent
variable should have mutually exclusive and exhaustive categories.
6. Logistic Regression Using SPSS
Overview
Logistic Regression - Assumption
4. There needs to be a linear relationship between any continuous
independent variables and the logit transformation of the dependent
variable. à Box-Tidwell Test
7. Logistic Regression Using SPSS
Overview
Box-Tidwell Test
- We include in the model the interactions between the continuous
predictors and their logs.
- If the interaction term is statistically significant, the original continuous
independent variable is not linearly related to the logit of the dependent
variable.
- Don’t worry about the significant interaction if the sample sizes are
large.
8. Logistic Regression Using SPSS
Performing the Analysis Using SPSS
Dataset
Please download the dataset using this link:
https://miami.box.com/s/cb1tytyzogqe1vs7eu4fdqj7m9ewtwzo
And open it in SPSS
9. Logistic Regression Using SPSS
Performing the Analysis Using SPSS
Dataset
1) The dependent variable, heart_disease , which is whether the
participant has heart disease;
2) The independent variable, age , which is the participant's age in years;
3) The independent variable, weight , which is the participant's weight
(technically, it is their 'mass’);
4) The independent variable, gender , which has two categories: "Male"
and "Female";
5) The independent variable, VO2max , which is the maximal aerobic
capacity.
6) The case identifier, caseno , which is used for easy elimination of cases
(e.g., participants) that might occur when checking outliers.
10. Logistic Regression Using SPSS
Performing the Analysis Using SPSS
Click Transform > Compute Variable:
- We want to compute the logs of any continuous independent variable,
in our case: age, weight, and VO2 max.
- For Age variable:
Type LN_age in target variable and LN(age) in Numeric Expression
- Repeat the same procedure for the other two variables.
11. Logistic Regression Using SPSS
Performing the Analysis Using SPSS
Click Analyze > Regression > Binary Logistic
12. Logistic Regression Using SPSS
Performing the Analysis Using SPSS
In the Logistic Regression Window
- Move your DV into the DV box, and all of your IVs in the covariates box.
13. Logistic Regression Using SPSS
Performing the Analysis Using SPSS
For Box-Tidwell test
- Add the interaction term between each continues IV and its log.
14. Logistic Regression Using SPSS
Performing the Analysis Using SPSS
In the Logistic Regression Window: Click on Categorical
- Transfer the categorical independent variable, gender, from
the Covariates: box to the Categorical Covariates: box, as shown below,
and then change the reference category to be the first, then click on
change:
15. Logistic Regression Using SPSS
Performing the Analysis Using SPSS
In the Logistic Regression Window: Click on Options
- Check the appropriate statistics and plots needed for the analysis as
shown below:
16. Logistic Regression Using SPSS
Performing the Analysis Using SPSS
SPSS output for Box-Tedwell Test
- If all of them are not significant, redo the analysis with the interaction
terms:
17. Logistic Regression Using SPSS
Performing the Analysis Using SPSS
Redo the analysis: Click Analyze > Regression > Binary Logistic
18. Logistic Regression Using SPSS
Performing the Analysis Using SPSS
Remove interaction terms from covariates:
19. Logistic Regression Using SPSS
Performing the Analysis Using SPSS
SPSS output
This part of the output tells you about the cases that were included and excluded from the
analysis, the coding of the dependent variable, and coding of any categorical variables listed on
the categorical subcommand.
20. Logistic Regression Using SPSS
Performing the Analysis Using SPSS
SPSS output – Block 0
This part of the output describes a “null model”, which is model with no predictors and just the
intercept. This is why you will see all of the variables that you put into the model in the table
titled “Variables not in the Equation”.
21. Logistic Regression Using SPSS
Performing the Analysis Using SPSS
SPSS output – Block 1
The section contains what is frequently the most interesting part of the output: the overall test of
the model (in the “Omnibus Tests of Model Coefficients” table) and the coefficients and odds
ratios (in the “Variables in the Equation” table).
The overall model is statistically significant, χ2(4) = 27.40, p < .05.
22. Logistic Regression Using SPSS
Performing the Analysis Using SPSS
SPSS output – Block 1
This table contains the Cox & Snell R Square and Nagelkerke R Square values, which are both
methods of calculating the explained variation. These values are sometimes referred to
as pseudo R2 values (and will have lower values than in multiple regression). However, they are
interpreted in the same manner, but with more caution. Therefore, the explained variation in the
dependent variable based on our model ranges from 24.0% to 33.0%, depending on whether you
reference the Cox & Snell R2 or Nagelkerke R2 methods, respectively.
23. Logistic Regression Using SPSS
Performing the Analysis Using SPSS
SPSS output – Block 1
The Hosmer-Lemeshow tests the null hypothesis that predictions made by the model fit perfectly
with observed group memberships. A chi-square statistic is computed comparing the observed
frequencies with those expected under the linear model. A nonsignificant chi-square indicates
that the data fit the model well.
24. Logistic Regression Using SPSS
Performing the Analysis Using SPSS
SPSS output – Block 1
Logistic regression estimates the probability of an event (in this case, having heart disease)
occurring. If the estimated probability of the event occurring is greater than or equal to 0.5 (better
than even chance), SPSS Statistics classifies the event as occurring (e.g., heart disease being
present). If the probability is less than 0.5, SPSS Statistics classifies the event as not occurring
(e.g., no heart disease). It is very common to use binomial logistic regression to predict whether
cases can be correctly classified (i.e., predicted) from the independent variables. Therefore, it
becomes necessary to have a method to assess the effectiveness of the predicted classification
against the actual classification.
25. Logistic Regression Using SPSS
Performing the Analysis Using SPSS
SPSS output – Block 1
- With the independent variables added, the model now correctly classifies 71.0% of cases
overall (see "Overall Percentage" row) à Percentage accuracy in classification.
- 45.7% of participants who had heart disease were also predicted by the model to have heart
disease (see the "Percentage Correct" column in the "Yes" row of the observed categories). à
Sensitivity
- 84.6% of participants who did not have heart disease were correctly predicted by the model not
to have heart disease (see the "Percentage Correct" column in the "No" row of the observed
categories). à Specificity
26. Logistic Regression Using SPSS
Performing the Analysis Using SPSS
SPSS output – Block 1
- The positive predictive value is the percentage of correctly predicted cases with the
observed characteristic compared to the total number of cases predicted as having the
characteristic. In our case, this is 100 x (16 ÷ (10 + 16)) which is 61.5%. That is, of all cases
predicted as having heart disease, 61.5% were correctly predicted.
- The negative predictive value is the percentage of correctly predicted cases without the
observed characteristic compared to the total number of cases predicted as not having the
characteristic. In our case, this is 100 x (55 ÷ (55 + 19)) which is 74.3%. That is, of all cases
predicted as not having heart disease, 74.3% were correctly predicted.
27. Logistic Regression Using SPSS
Performing the Analysis Using SPSS
SPSS output – Block 1
- The Wald test ("Wald" column) is used to determine statistical significance for each of the
independent variables. The statistical significance of the test is found in the "Sig." column.
From these results you can see that age (p = .003), gender (p = .021) and VO2max (p = .039)
added significantly to the model/prediction, but weight (p = .799) did not add significantly to
the model.
28. Logistic Regression Using SPSS
Performing the Analysis Using SPSS
SPSS output – Block 1
- You can use the information in the "Variables in the Equation" table to predict the probability of
an event occurring based on a one-unit change in an independent variable when all other
independent variables are kept constant. For example, the table shows that the odds of
having heart disease ("yes" category) is 7.026 times greater for males as opposed to females.
29. Logistic Regression Using SPSS
Performing the Analysis Using SPSS
APA style write-up
- A logistic regression was performed to ascertain the effects of age, weight, gender and
VO2max on the likelihood that participants have heart disease. The logistic regression model
was statistically significant, χ2(4) = 27.402, p < .0005. The model explained 33.0%
(Nagelkerke R2) of the variance in heart disease and correctly classified 71.0% of cases.
Males were 7.02 times more likely to exhibit heart disease than females. Increasing age was
associated with an increased likelihood of exhibiting heart disease, However, increasing
VO2max was associated with a reduction in the likelihood of exhibiting heart disease.
30. Multiple Regression Using SPSS
Presented by Nasser Hasan - Statistical Supporting Unit
6/3/2020
Thanks for Listening and Attending!
Any Questions?
Can you please give us a minute to fill this survey as it will help
us to evaluate our performance and take your feedback into
consideration for future webinars:
https://umiami.qualtrics.com/jfe/form/SV_a9N5Xta6OlybEeV