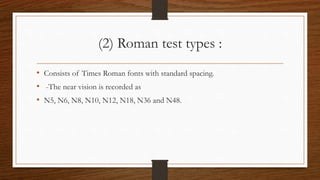
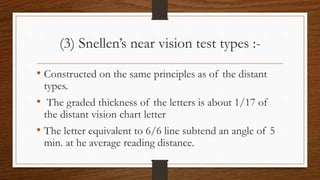
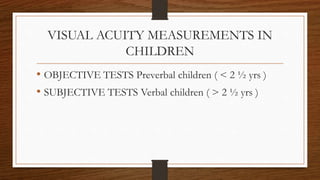
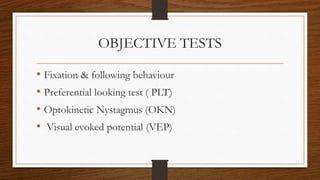
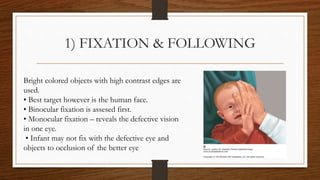
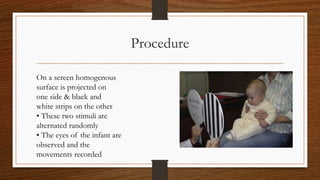
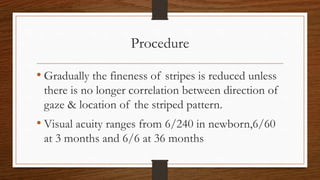
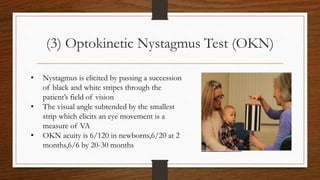
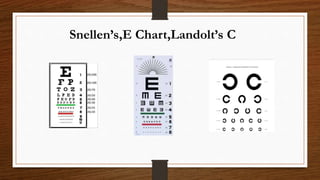
VISUAL ACUITY
MEASUREMENT, CONTRAST
SENSITIVITY
Lecture By
Dr. Sania Aslam OD
VISUAL ACUITY PRINCIPLES
• The visual acuity is determined by the smallest retinal image the form of
which can be appreciated
• For discriminating the form of an object its parts must be differentiated
• It is necessary that two individual cones must be stimulated with one
between them remaining unstimulated
VISUAL ANGLE
• It is found that the object must subtend a visual angle of 1 minute at the
nodal point of the eye
• VA test types consists of a series of
letters of diminishing size.
• Each letter is shaped such that it can be
placed in a square, the sides of which are
five times the breadth of the constituent
lines. Hence the whole letter will subtend
an angle of 5 min. at the nodal point of
the eye at the given distance.
COMPONENTS OF VISUAL ACUITY
•Detection or visibility
•Resolution
•Recognition
1. Detection or Visibility
• Ability to determine whether or not an object is present in an
otherwise empty visual field is termed visibility.
• This depends upon the specification of stimulus such as size,
shape, & illumination.
• A black dot against a white background can be detected if its
diameter is of the order of 30 sec or more
2. Resolution (Ordinary VA)
• Discrimination of two spatially separated targets is
termed resolution
• It is essentially an assessment of function of the fovea
centralis
• This component of VA is measured clinically using
Snellen’s or other test types
3. Recognition
• Virtue by which an individual identifies the test
patterns with which he had some experience
• It involves cognitive component in addition to
spatial resolution
• E.g. Identification of faces
MEASUREMENT OF VISUAL ACUITY
• The visual acuity is a highly complex function
• In clinical practice, VA is considered synonymous
with the measurement of minimum resolvable only
• Hence, examination with various VA charts is
quite satisfactory, although incomplete
MEASUREMENT OF VISUAL ACUITY IN
ADULTS
• The distant central VA in adults is tested by :
• Snellen’s test types
• Landolt’s C test types
• E chart
SNELLEN’S TEST TYPE
• Basis of the test :
• Two distant points are visible as separate only when they
subtend an angle of 1 min at the nodal point of eye
• Black capital letters on white board, arranged in lines,
each progressively diminishing in size
Each letter of the chart
is so designed that it fits
in a square,the sides of
which are 5 times the
breadth of constituent
lines
• The line comprising the
letters have such a
breadth that they will
subtend an angle of 1
min at the nodal point
METHOD
• Patient seated at 6 meters from the chart
• Illumination is 20 foot candles
• Each eye is tested separately.
• VA is recorded as a fraction (6/60, 6/36, 6/24,6/12,6/9, 6/6)
• Numerator: distance of the pt. from the chart
• Denominator: smallest letters accurately read
• If pt. cannot see the top line from 6m, he is asked to slowly move
towards the chart till he can read the top line(5/60, 4/60, 3/60, 2/60,
1/60)
• If the pt. is unable to see even from 1m, he is asked to count fingers of
the examiner
• When the pt. fails to count fingers, the examiner moves his hands close
to the pt’s face & asks whether he could appreciate the movements or
not. (HM +/-)
• When the patient cannot appreciate hand movements, perception to light
is noted. (PL +/-) with projection of rays in four quadrants.
LANDOLT’S TEST TYPES
Similar to Snellen’s test types
• Instead of letters, broken rings
are used & the patient is asked to
detect the direction of the break
in the circle
• Each broken ring subtends an
angle of 5 min. at nodal point
E CHART :-
Similar to snellen’s and landolt’s the
difference
is that in this chart E of different sizes are
arranged
• Pt. is asked to tell the direction towards
which
the arms of the E are pointing
SNELLEN’S EQUIVALENT
• In U.S., the metric system is not usually employed & the values are converted
to feet
• ( 6m = 20 feet)
• VA 6/6 = 20/20
• VA 6/60 = 20/200
• VA 3/60 = 20/400
Decimal acuity
• In this system, the Snellen’s fraction is reduced to a decimal no.
• Higher VA is represented by a numerically larger number, which is reverse in
the Snellen’s grading
• Ex- 6/6 = 1.0 6/9 = 0.67 6/60 = 0.10
The Bailey-Lovie logMAR chart
• Principle:-
 Used logarithmic scale.
 Each step indicates increase of 25% in letter size.
 Letter sizes ratio as we move up is a constant value of 1.26(0.1log unit steps).
 Incorporated 5 letters in every row.
 Spacing b/w 2 adjacent letters = width of 1 letter.
 Spacing b/w 2 hz rows = height of the letter on lower row.
Results of this chart were
obtained in terms of
logMAR score i.e log of
minimum angle of resolution
• As each letter size changes
by 0.1 logMAR units per row
& there are 5 letters on each
row ,therefore each letter can
be assigned value of 0.02
• Thus final logMAR takes
account of every letter that
has been correctly read
Snellens Chart
• Irregular progression of letter size
• Variable number of letters in each line
• Variable legibility (difficulty) of test
letters
• Distance between each letter is not
uniform
• Uniform progression of letter size
• Same number of letters in each line
• All letters with similar legibility
• The distance b/w each letter is equal
to the width of the letter
logMAR Chart
Measurement of VA for Near
• Near vision is tested by asking the patient to read a near
vision chart kept at a distance of 25cm to 35cm
• Each eye should be tested separately
• The near vision is recorded as the smallest type which
the patient can read comfortably
1) Jaeger’s charts :-
Consist of ordinary printer’s
fonts of varying sizes
• Prints are marked from 1 to 7
and accordingly pt’s acuity is
labeled as J1 to J7 depending
upon the print he can read
(2) Roman test types :
• Consists of Times Roman fonts with standard spacing.
• -The near vision is recorded as
• N5, N6, N8, N10, N12, N18, N36 and N48.
(3) Snellen’s near vision test types :-
• Constructed on the same principles as of the distant
types.
• The graded thickness of the letters is about 1/17 of
the distant vision chart letter
• The letter equivalent to 6/6 line subtend an angle of 5
min. at he average reading distance.
VISUAL ACUITY MEASUREMENTS IN
CHILDREN
• OBJECTIVE TESTS Preverbal children ( < 2 ½ yrs )
• SUBJECTIVE TESTS Verbal children ( > 2 ½ yrs )
OBJECTIVE TESTS
• Fixation & following behaviour
• Preferential looking test ( PLT)
• Optokinetic Nystagmus (OKN)
• Visual evoked potential (VEP)
1) FIXATION & FOLLOWING
Bright colored objects with high contrast edges are
used.
• Best target however is the human face.
• Binocular fixation is assesed first.
• Monocular fixation – reveals the defective vision
in one eye.
• Infant may not fix with the defective eye and
objects to occlusion of the better eye
Quality of fixation behaviour – C S M
• C – Central – foveal fixation
• S - Steady – no nystagmus
• M – Maintained – fixation after a blink
QUANTITATIVE METHODS
• Methods to detect the resolution acuity
• More sophisticated method of visual assesment than mere fixation
assesment.
Include –
• PREFERENTIAL LOOKING TEST
• OPTOKINETIC NYSTAGMUS
• VISUAL EVOKED POTENTIAL
(2) Preferential looking test
Assumes that the child will prefer to look at an area
of higher visual interest, rather than a neutral grey
field
• Child presented with two adjacent stimulus
fields,one which is striped and other homogenous
• Method suitable for infants upto 4 months of age
• Ex- Lea’s paddles, Teller’s acuity cards
Procedure
On a screen homogenous
surface is projected on
one side & black and
white strips on the other
• These two stimuli are
alternated randomly
• The eyes of the infant are
observed and the
movements recorded
Procedure
• Gradually the fineness of stripes is reduced unless
there is no longer correlation between direction of
gaze & location of the striped pattern.
• Visual acuity ranges from 6/240 in newborn,6/60
at 3 months and 6/6 at 36 months
(3) Optokinetic Nystagmus Test (OKN)
• Nystagmus is elicited by passing a succession
of black and white stripes through the
patient’s field of vision
• The visual angle subtended by the smallest
strip which elicits an eye movement is a
measure of VA
• OKN acuity is 6/120 in newborns,6/20 at 2
months,6/6 by 20-30 months
(4) Visual evoked response (VER)
• Refers to EEG recording made from the occipital lobe in
response to visual stimuli.
• It is useful in assessing visual function in infants.
• Only clinically objective technique available to assess the
functional state of visual system beyond the retinal ganglion cells.
• Two types – flash & pattern reversal VER
Visual evoked response (VER)
• Flash VER tells about the integrity of macular and visual pathway
• Pattern reversal VER uses some patterned stimulus like
checkerboard
• The pattern of stimulus is changed and so it gives an idea of
form sense
• VER studies shown VA in infants to be 6/120 at 1 month,6/60
at 2 months & 6/6 at 1 yr of age.
SUBJECTIVE TESTS
• Optotypesymbol whose identification implies VA
• Eg; Lea’s symbols ,HOTV, Snellen’s chart,
Landolt-C ,E chart.
• These tests are employed in verbal children.
Lea’s symbols
• Pt. is asked to match the
picture shown to the hand held
cards
• 4 shapes are included in this :
Circle, Square, Hut & Apple
• Done at 3m
HOVT /SHERIDAN GARDINER TEST
It is done at a distance of 6 meters
from the child
• It includes simple alphabets such as
H,O,T,V,X,A,U
• The patient matches the letter being
displayed with the hand held cards
Snellen’s,E Chart,Landolt’s C
IN SUMMARY
• INFANTS –
• Fixation methods
• Preferential looking test
• Optokinetic nystagmus
• Visual evoked potential
TODDLERS
• LEA’S SYMBOLS
• HOTV TEST
CHILDREN > 5 YRS & ADULTS
SNELLEN’S CHART
LANDOLT’S C CHART
E – CHART
ETDRS
Visual acuity measurement

Visual acuity measurement

  • 1.
  • 2.
    VISUAL ACUITY PRINCIPLES •The visual acuity is determined by the smallest retinal image the form of which can be appreciated • For discriminating the form of an object its parts must be differentiated • It is necessary that two individual cones must be stimulated with one between them remaining unstimulated
  • 3.
    VISUAL ANGLE • Itis found that the object must subtend a visual angle of 1 minute at the nodal point of the eye
  • 4.
    • VA testtypes consists of a series of letters of diminishing size. • Each letter is shaped such that it can be placed in a square, the sides of which are five times the breadth of the constituent lines. Hence the whole letter will subtend an angle of 5 min. at the nodal point of the eye at the given distance.
  • 5.
    COMPONENTS OF VISUALACUITY •Detection or visibility •Resolution •Recognition
  • 6.
    1. Detection orVisibility • Ability to determine whether or not an object is present in an otherwise empty visual field is termed visibility. • This depends upon the specification of stimulus such as size, shape, & illumination. • A black dot against a white background can be detected if its diameter is of the order of 30 sec or more
  • 7.
    2. Resolution (OrdinaryVA) • Discrimination of two spatially separated targets is termed resolution • It is essentially an assessment of function of the fovea centralis • This component of VA is measured clinically using Snellen’s or other test types
  • 8.
    3. Recognition • Virtueby which an individual identifies the test patterns with which he had some experience • It involves cognitive component in addition to spatial resolution • E.g. Identification of faces
  • 9.
    MEASUREMENT OF VISUALACUITY • The visual acuity is a highly complex function • In clinical practice, VA is considered synonymous with the measurement of minimum resolvable only • Hence, examination with various VA charts is quite satisfactory, although incomplete
  • 10.
    MEASUREMENT OF VISUALACUITY IN ADULTS • The distant central VA in adults is tested by : • Snellen’s test types • Landolt’s C test types • E chart
  • 11.
    SNELLEN’S TEST TYPE •Basis of the test : • Two distant points are visible as separate only when they subtend an angle of 1 min at the nodal point of eye • Black capital letters on white board, arranged in lines, each progressively diminishing in size
  • 12.
    Each letter ofthe chart is so designed that it fits in a square,the sides of which are 5 times the breadth of constituent lines • The line comprising the letters have such a breadth that they will subtend an angle of 1 min at the nodal point
  • 13.
    METHOD • Patient seatedat 6 meters from the chart • Illumination is 20 foot candles • Each eye is tested separately. • VA is recorded as a fraction (6/60, 6/36, 6/24,6/12,6/9, 6/6) • Numerator: distance of the pt. from the chart • Denominator: smallest letters accurately read
  • 14.
    • If pt.cannot see the top line from 6m, he is asked to slowly move towards the chart till he can read the top line(5/60, 4/60, 3/60, 2/60, 1/60) • If the pt. is unable to see even from 1m, he is asked to count fingers of the examiner • When the pt. fails to count fingers, the examiner moves his hands close to the pt’s face & asks whether he could appreciate the movements or not. (HM +/-) • When the patient cannot appreciate hand movements, perception to light is noted. (PL +/-) with projection of rays in four quadrants.
  • 15.
    LANDOLT’S TEST TYPES Similarto Snellen’s test types • Instead of letters, broken rings are used & the patient is asked to detect the direction of the break in the circle • Each broken ring subtends an angle of 5 min. at nodal point
  • 16.
    E CHART :- Similarto snellen’s and landolt’s the difference is that in this chart E of different sizes are arranged • Pt. is asked to tell the direction towards which the arms of the E are pointing
  • 17.
    SNELLEN’S EQUIVALENT • InU.S., the metric system is not usually employed & the values are converted to feet • ( 6m = 20 feet) • VA 6/6 = 20/20 • VA 6/60 = 20/200 • VA 3/60 = 20/400
  • 18.
    Decimal acuity • Inthis system, the Snellen’s fraction is reduced to a decimal no. • Higher VA is represented by a numerically larger number, which is reverse in the Snellen’s grading • Ex- 6/6 = 1.0 6/9 = 0.67 6/60 = 0.10
  • 19.
    The Bailey-Lovie logMARchart • Principle:-  Used logarithmic scale.  Each step indicates increase of 25% in letter size.  Letter sizes ratio as we move up is a constant value of 1.26(0.1log unit steps).  Incorporated 5 letters in every row.  Spacing b/w 2 adjacent letters = width of 1 letter.  Spacing b/w 2 hz rows = height of the letter on lower row.
  • 20.
    Results of thischart were obtained in terms of logMAR score i.e log of minimum angle of resolution • As each letter size changes by 0.1 logMAR units per row & there are 5 letters on each row ,therefore each letter can be assigned value of 0.02 • Thus final logMAR takes account of every letter that has been correctly read
  • 21.
    Snellens Chart • Irregularprogression of letter size • Variable number of letters in each line • Variable legibility (difficulty) of test letters • Distance between each letter is not uniform • Uniform progression of letter size • Same number of letters in each line • All letters with similar legibility • The distance b/w each letter is equal to the width of the letter logMAR Chart
  • 23.
    Measurement of VAfor Near • Near vision is tested by asking the patient to read a near vision chart kept at a distance of 25cm to 35cm • Each eye should be tested separately • The near vision is recorded as the smallest type which the patient can read comfortably
  • 24.
    1) Jaeger’s charts:- Consist of ordinary printer’s fonts of varying sizes • Prints are marked from 1 to 7 and accordingly pt’s acuity is labeled as J1 to J7 depending upon the print he can read
  • 25.
    (2) Roman testtypes : • Consists of Times Roman fonts with standard spacing. • -The near vision is recorded as • N5, N6, N8, N10, N12, N18, N36 and N48.
  • 26.
    (3) Snellen’s nearvision test types :- • Constructed on the same principles as of the distant types. • The graded thickness of the letters is about 1/17 of the distant vision chart letter • The letter equivalent to 6/6 line subtend an angle of 5 min. at he average reading distance.
  • 27.
    VISUAL ACUITY MEASUREMENTSIN CHILDREN • OBJECTIVE TESTS Preverbal children ( < 2 ½ yrs ) • SUBJECTIVE TESTS Verbal children ( > 2 ½ yrs )
  • 28.
    OBJECTIVE TESTS • Fixation& following behaviour • Preferential looking test ( PLT) • Optokinetic Nystagmus (OKN) • Visual evoked potential (VEP)
  • 29.
    1) FIXATION &FOLLOWING Bright colored objects with high contrast edges are used. • Best target however is the human face. • Binocular fixation is assesed first. • Monocular fixation – reveals the defective vision in one eye. • Infant may not fix with the defective eye and objects to occlusion of the better eye
  • 30.
    Quality of fixationbehaviour – C S M • C – Central – foveal fixation • S - Steady – no nystagmus • M – Maintained – fixation after a blink
  • 31.
    QUANTITATIVE METHODS • Methodsto detect the resolution acuity • More sophisticated method of visual assesment than mere fixation assesment. Include – • PREFERENTIAL LOOKING TEST • OPTOKINETIC NYSTAGMUS • VISUAL EVOKED POTENTIAL
  • 32.
    (2) Preferential lookingtest Assumes that the child will prefer to look at an area of higher visual interest, rather than a neutral grey field • Child presented with two adjacent stimulus fields,one which is striped and other homogenous • Method suitable for infants upto 4 months of age • Ex- Lea’s paddles, Teller’s acuity cards
  • 33.
    Procedure On a screenhomogenous surface is projected on one side & black and white strips on the other • These two stimuli are alternated randomly • The eyes of the infant are observed and the movements recorded
  • 34.
    Procedure • Gradually thefineness of stripes is reduced unless there is no longer correlation between direction of gaze & location of the striped pattern. • Visual acuity ranges from 6/240 in newborn,6/60 at 3 months and 6/6 at 36 months
  • 35.
    (3) Optokinetic NystagmusTest (OKN) • Nystagmus is elicited by passing a succession of black and white stripes through the patient’s field of vision • The visual angle subtended by the smallest strip which elicits an eye movement is a measure of VA • OKN acuity is 6/120 in newborns,6/20 at 2 months,6/6 by 20-30 months
  • 36.
    (4) Visual evokedresponse (VER) • Refers to EEG recording made from the occipital lobe in response to visual stimuli. • It is useful in assessing visual function in infants. • Only clinically objective technique available to assess the functional state of visual system beyond the retinal ganglion cells. • Two types – flash & pattern reversal VER
  • 37.
    Visual evoked response(VER) • Flash VER tells about the integrity of macular and visual pathway • Pattern reversal VER uses some patterned stimulus like checkerboard • The pattern of stimulus is changed and so it gives an idea of form sense • VER studies shown VA in infants to be 6/120 at 1 month,6/60 at 2 months & 6/6 at 1 yr of age.
  • 38.
    SUBJECTIVE TESTS • Optotypesymbolwhose identification implies VA • Eg; Lea’s symbols ,HOTV, Snellen’s chart, Landolt-C ,E chart. • These tests are employed in verbal children.
  • 39.
    Lea’s symbols • Pt.is asked to match the picture shown to the hand held cards • 4 shapes are included in this : Circle, Square, Hut & Apple • Done at 3m
  • 40.
    HOVT /SHERIDAN GARDINERTEST It is done at a distance of 6 meters from the child • It includes simple alphabets such as H,O,T,V,X,A,U • The patient matches the letter being displayed with the hand held cards
  • 41.
  • 42.
    IN SUMMARY • INFANTS– • Fixation methods • Preferential looking test • Optokinetic nystagmus • Visual evoked potential
  • 43.
    TODDLERS • LEA’S SYMBOLS •HOTV TEST CHILDREN > 5 YRS & ADULTS SNELLEN’S CHART LANDOLT’S C CHART E – CHART ETDRS