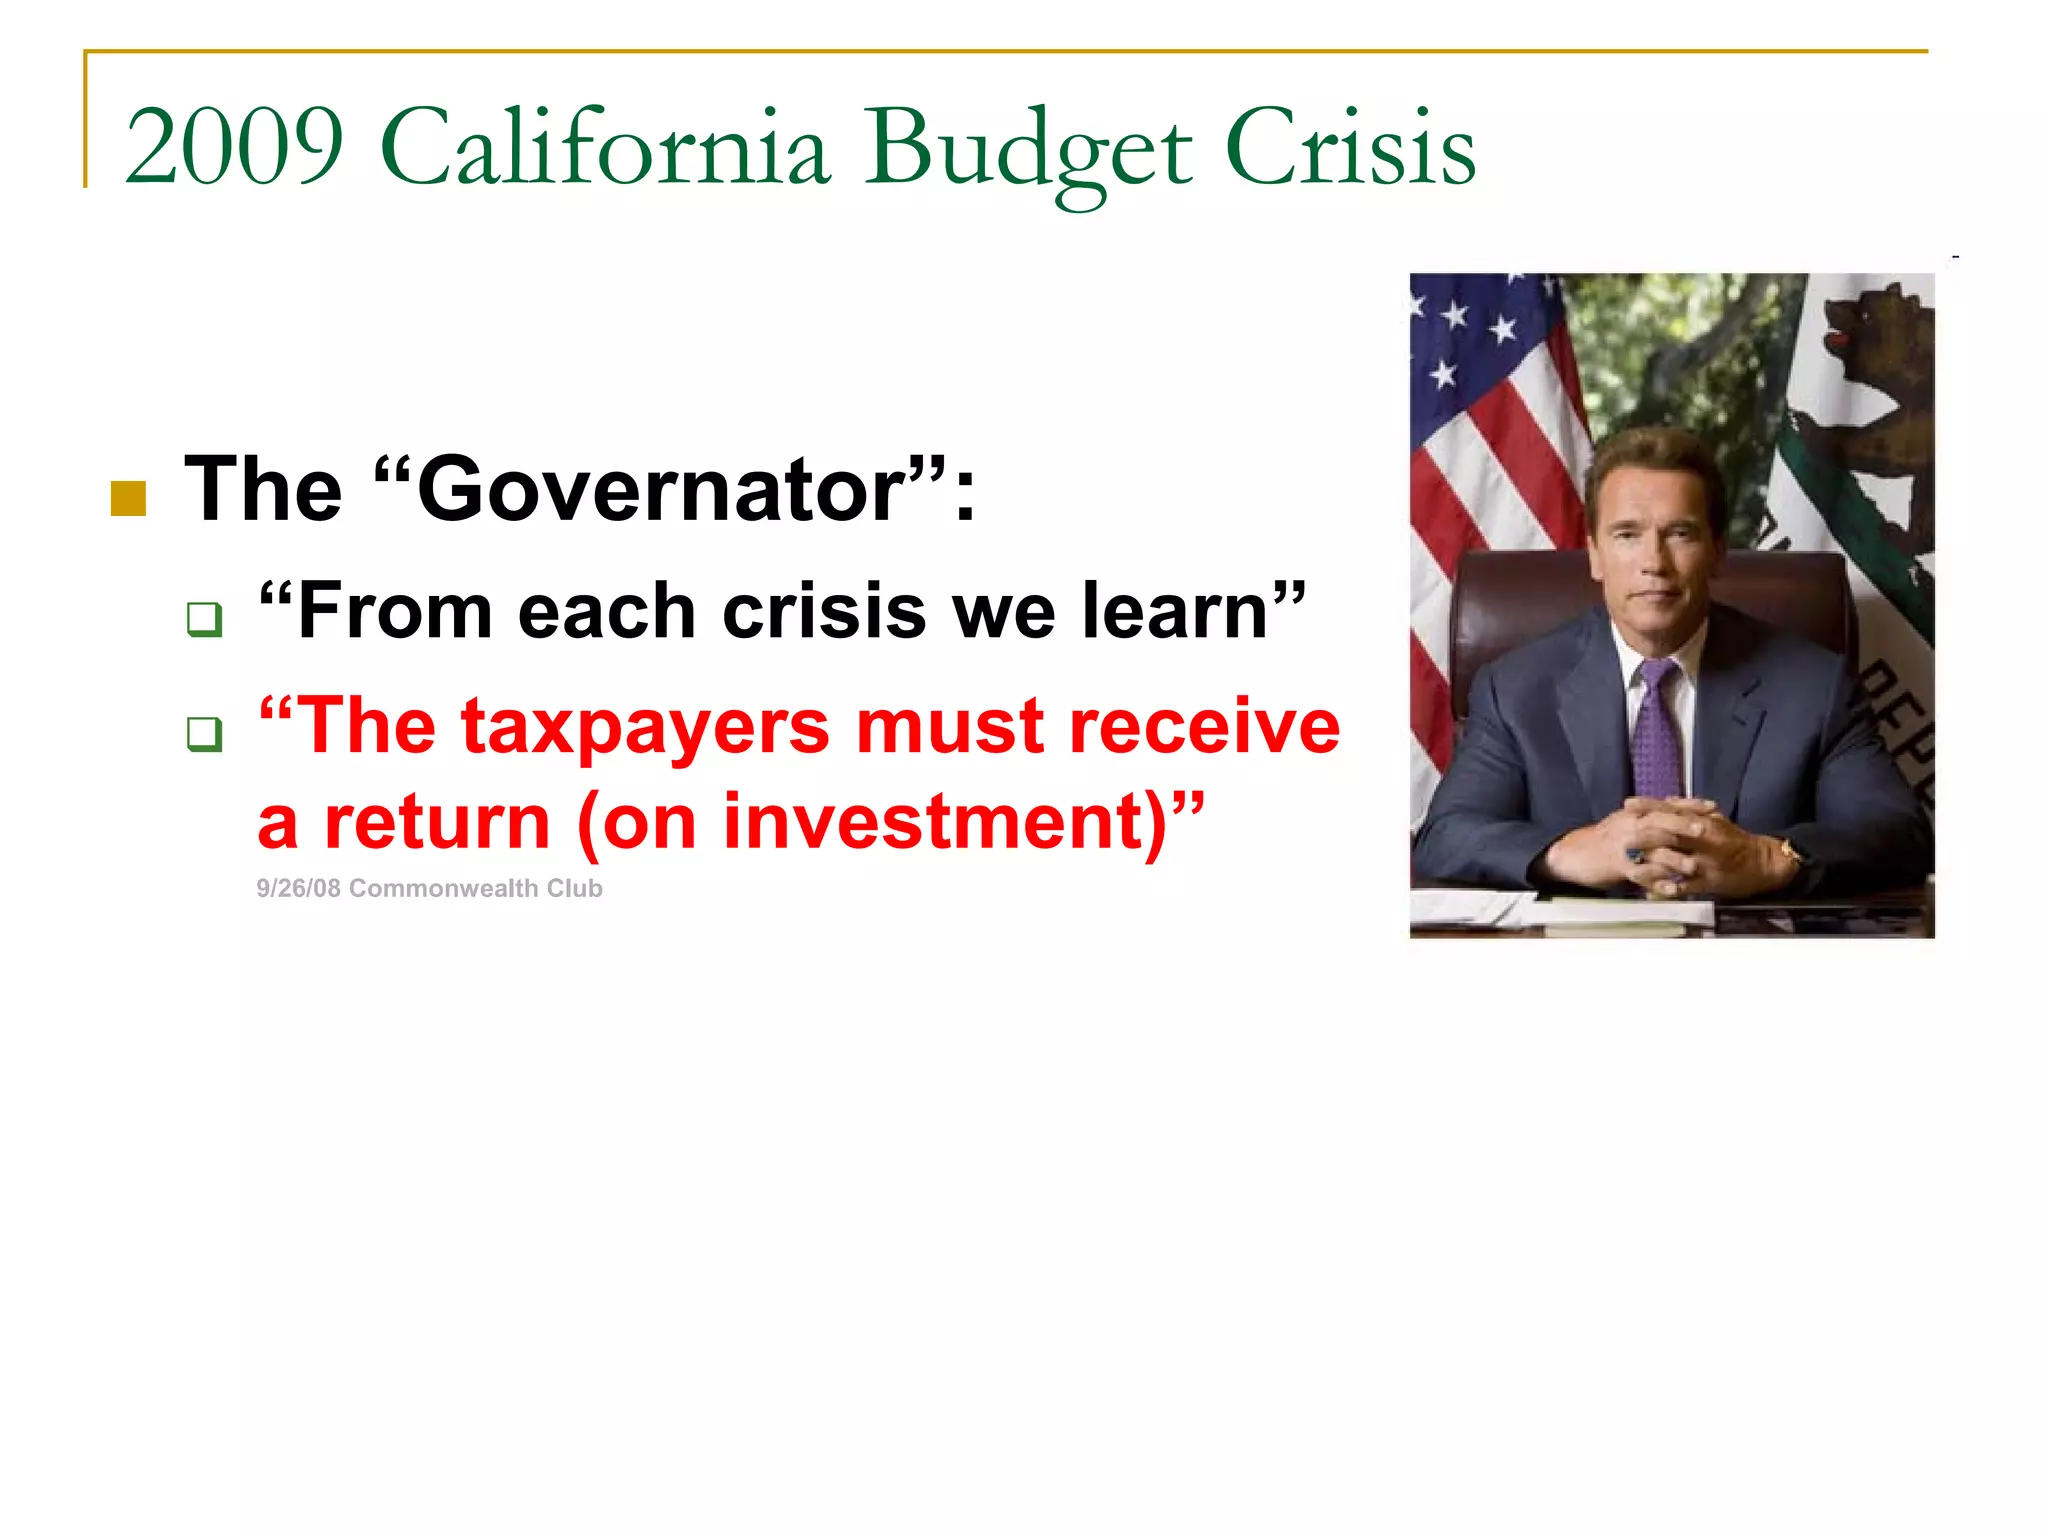
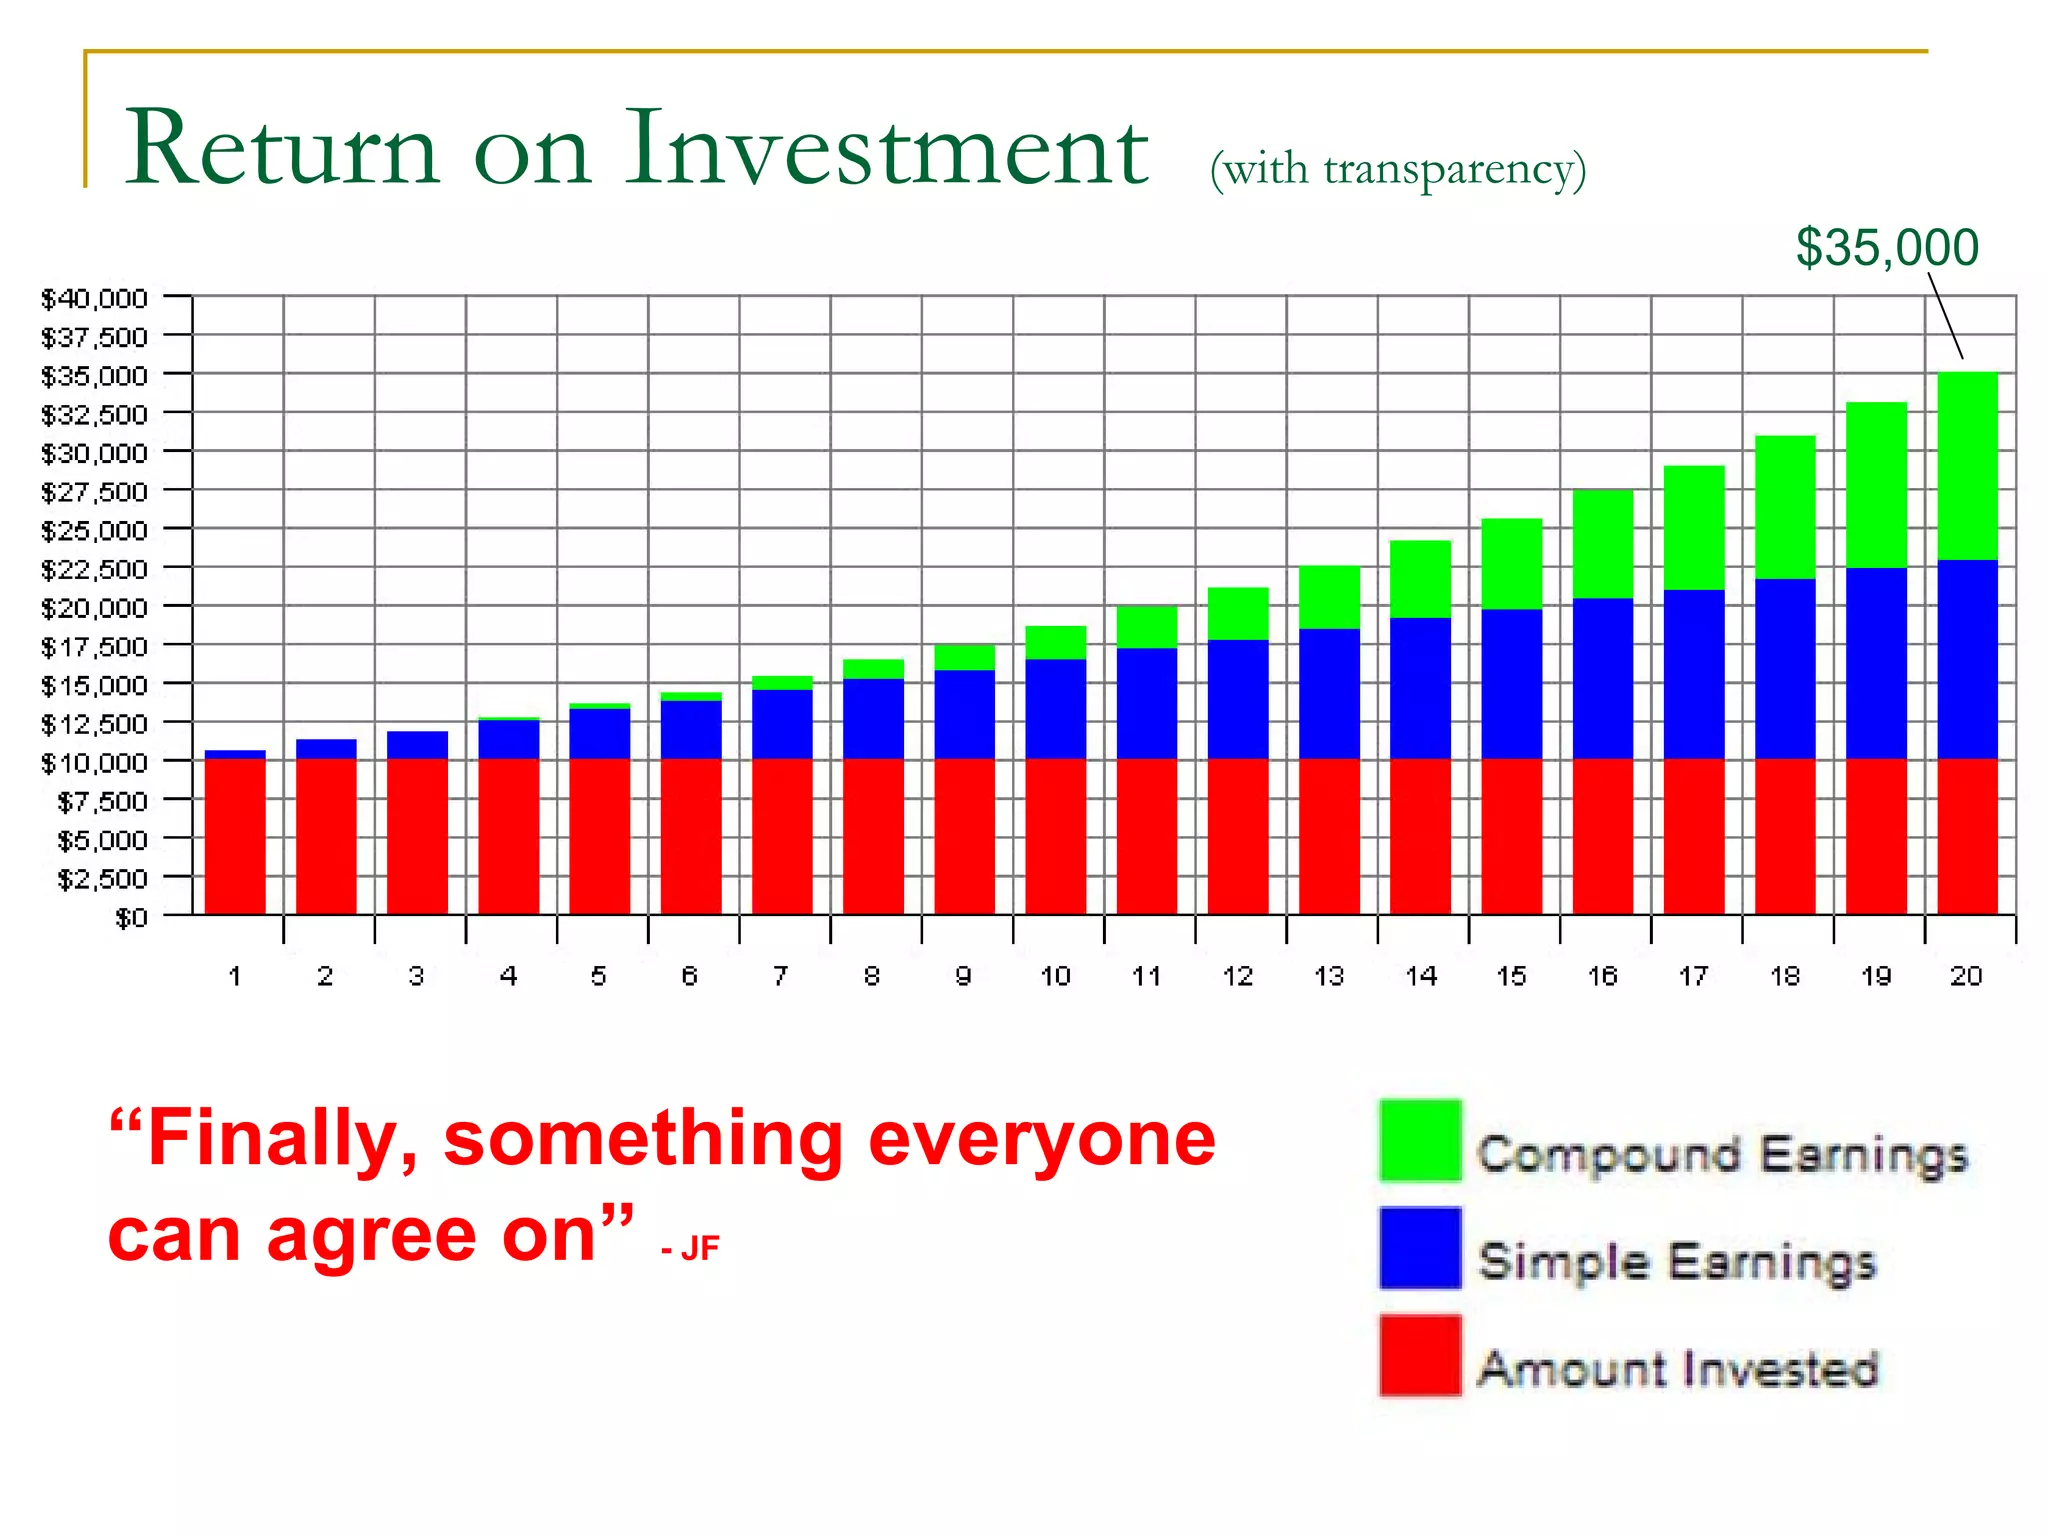
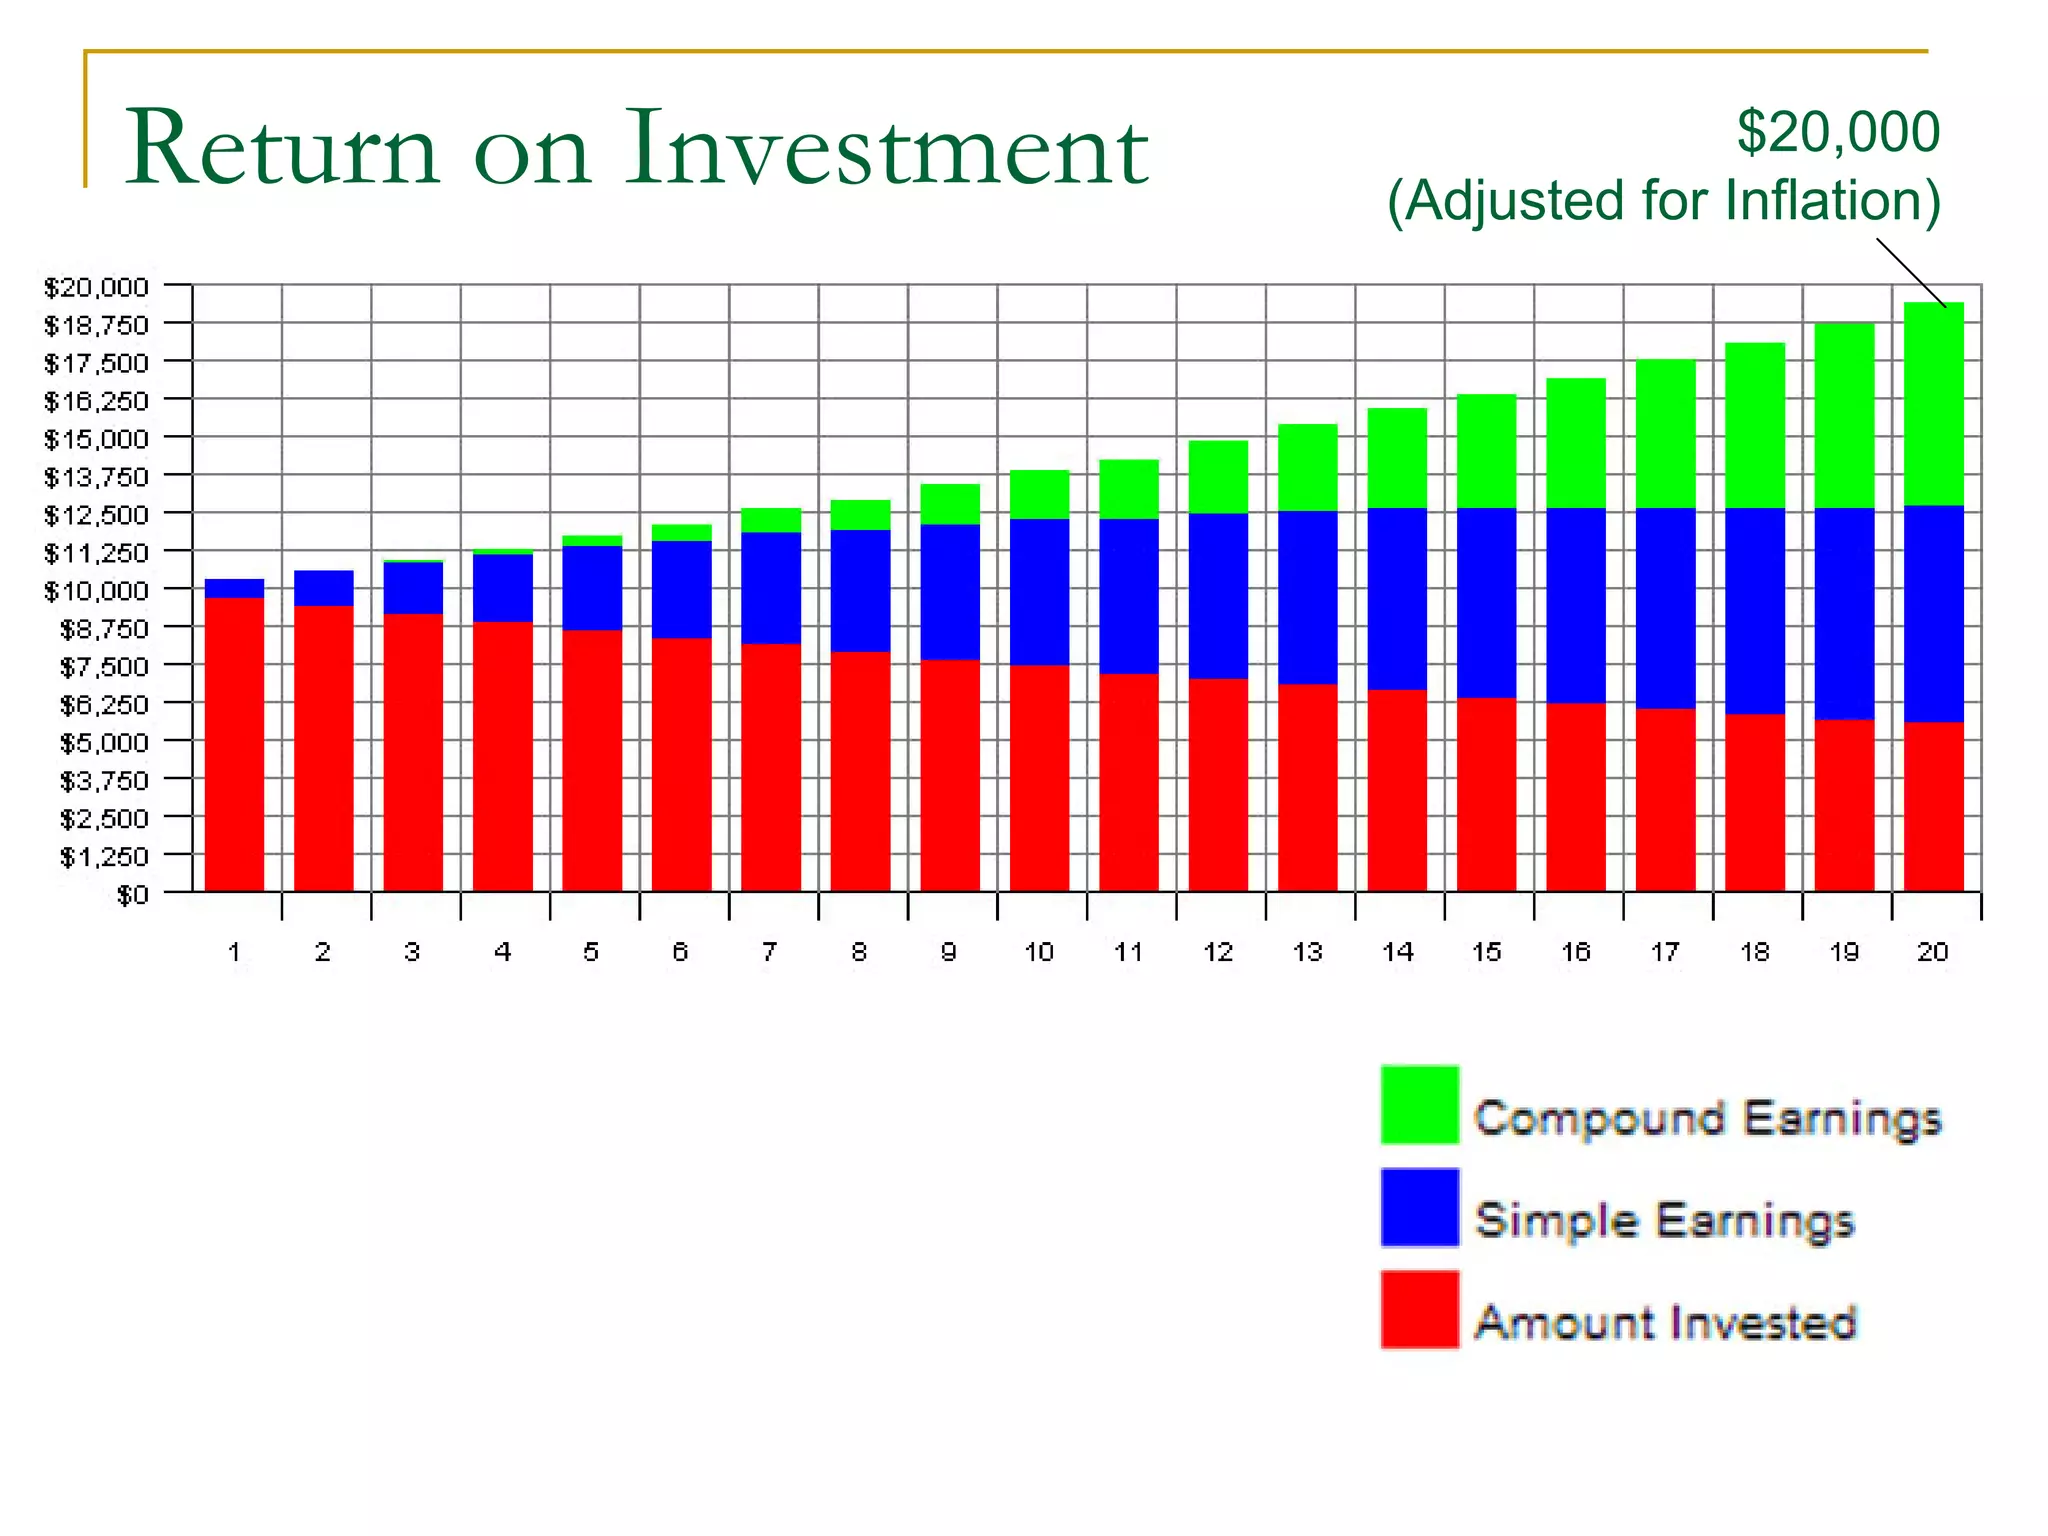
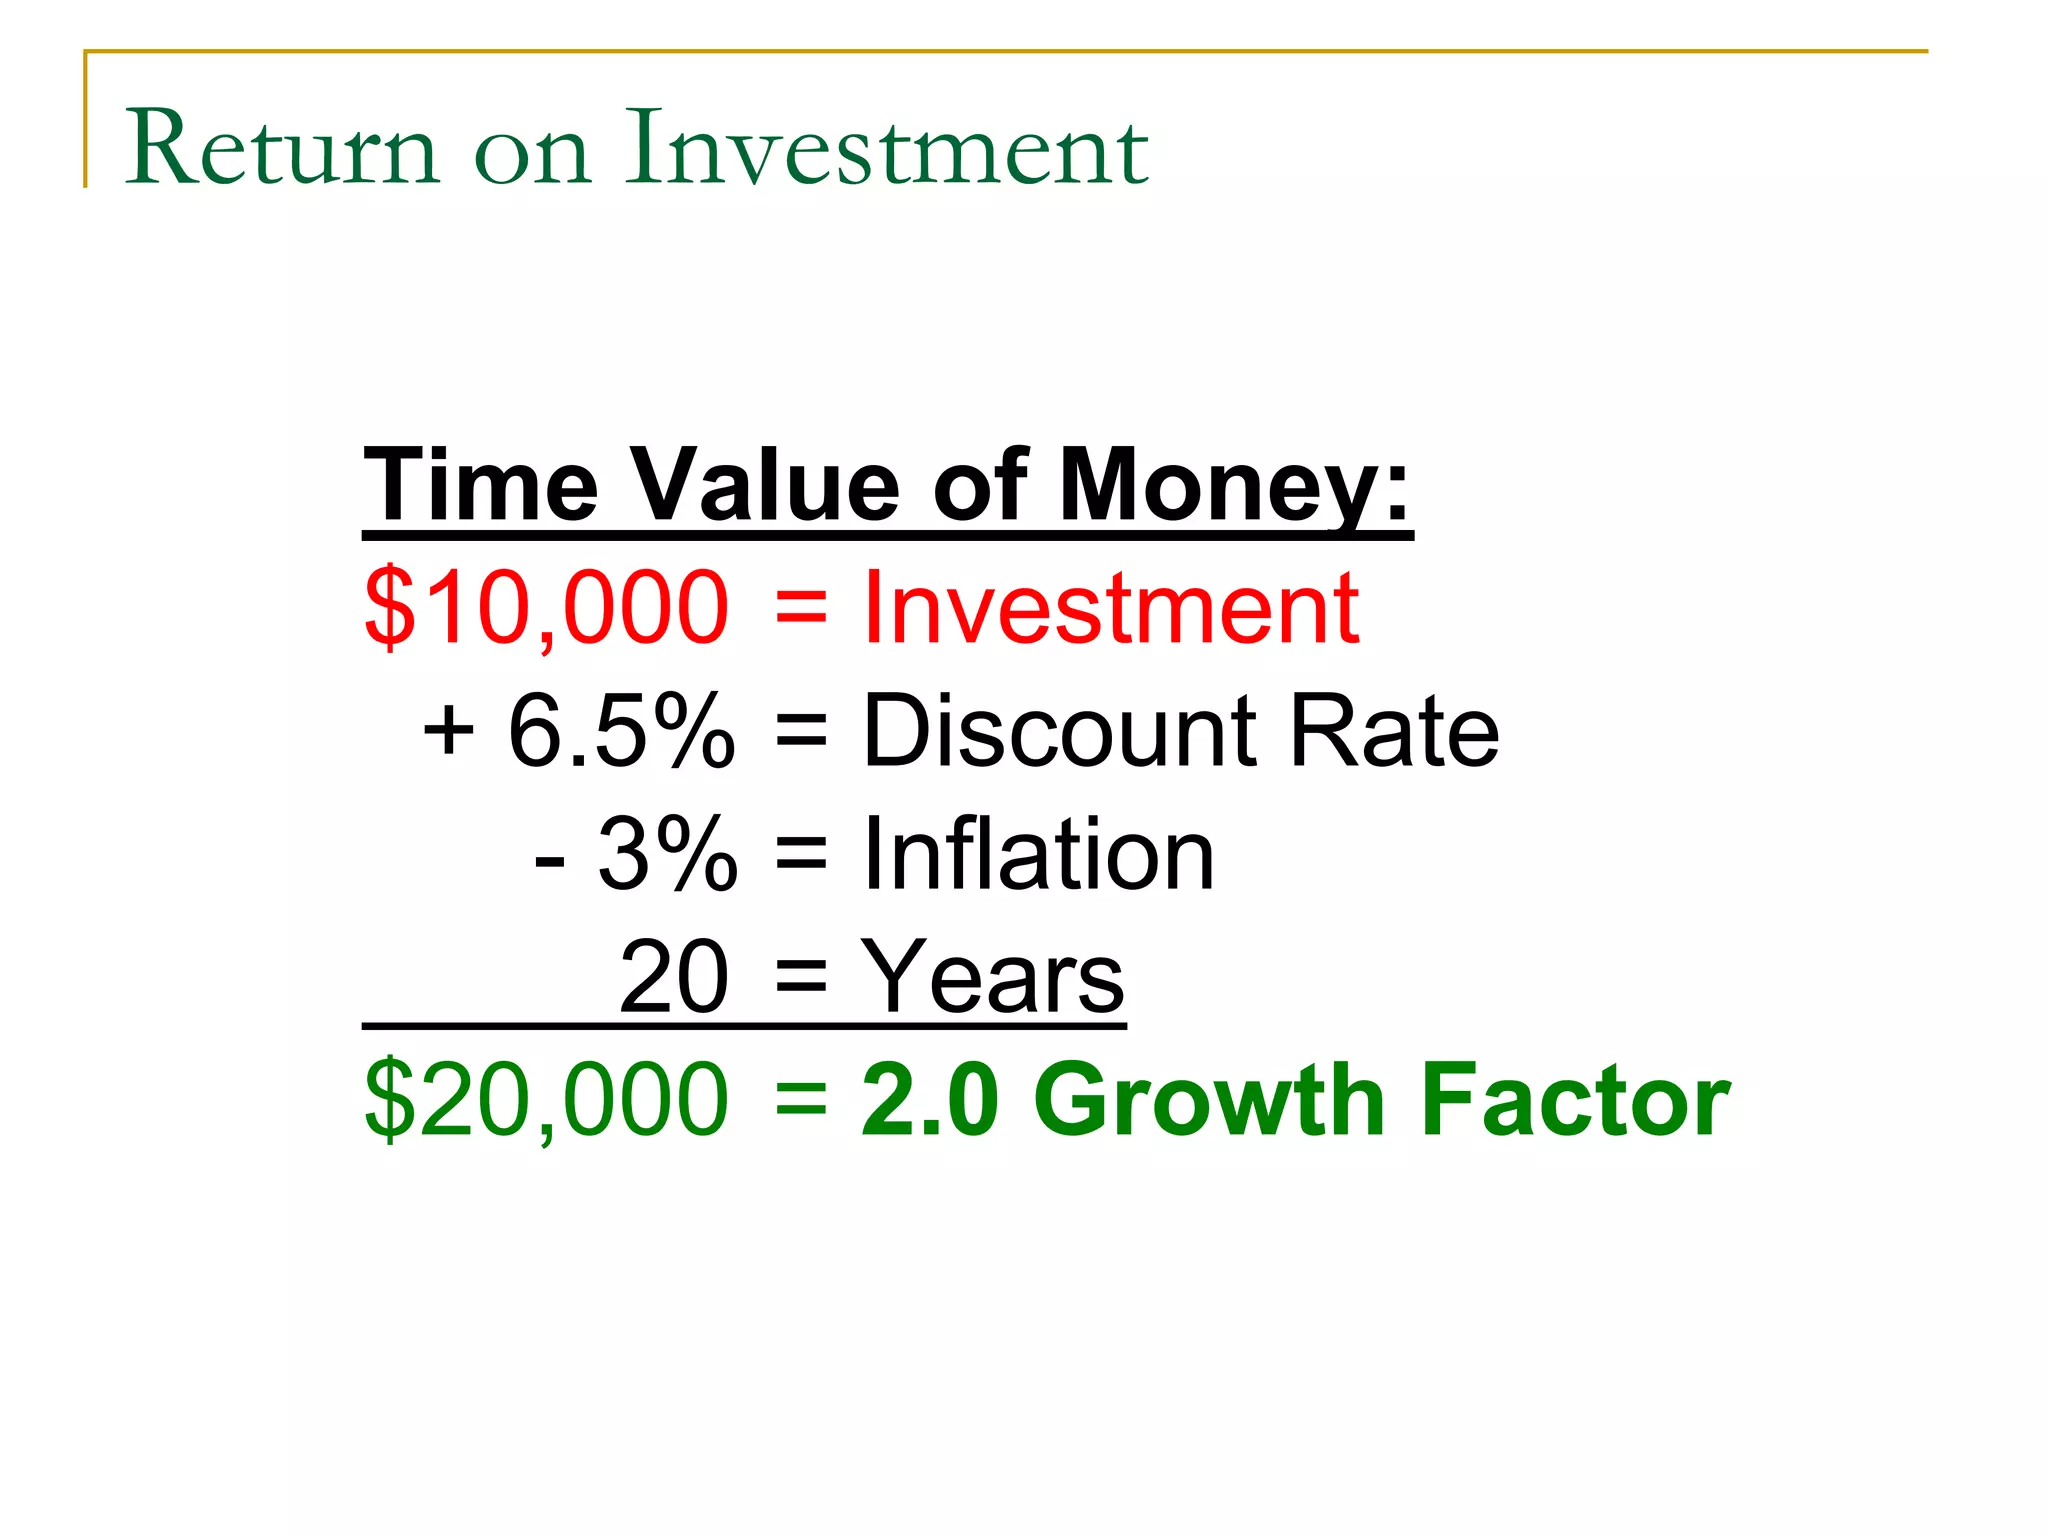
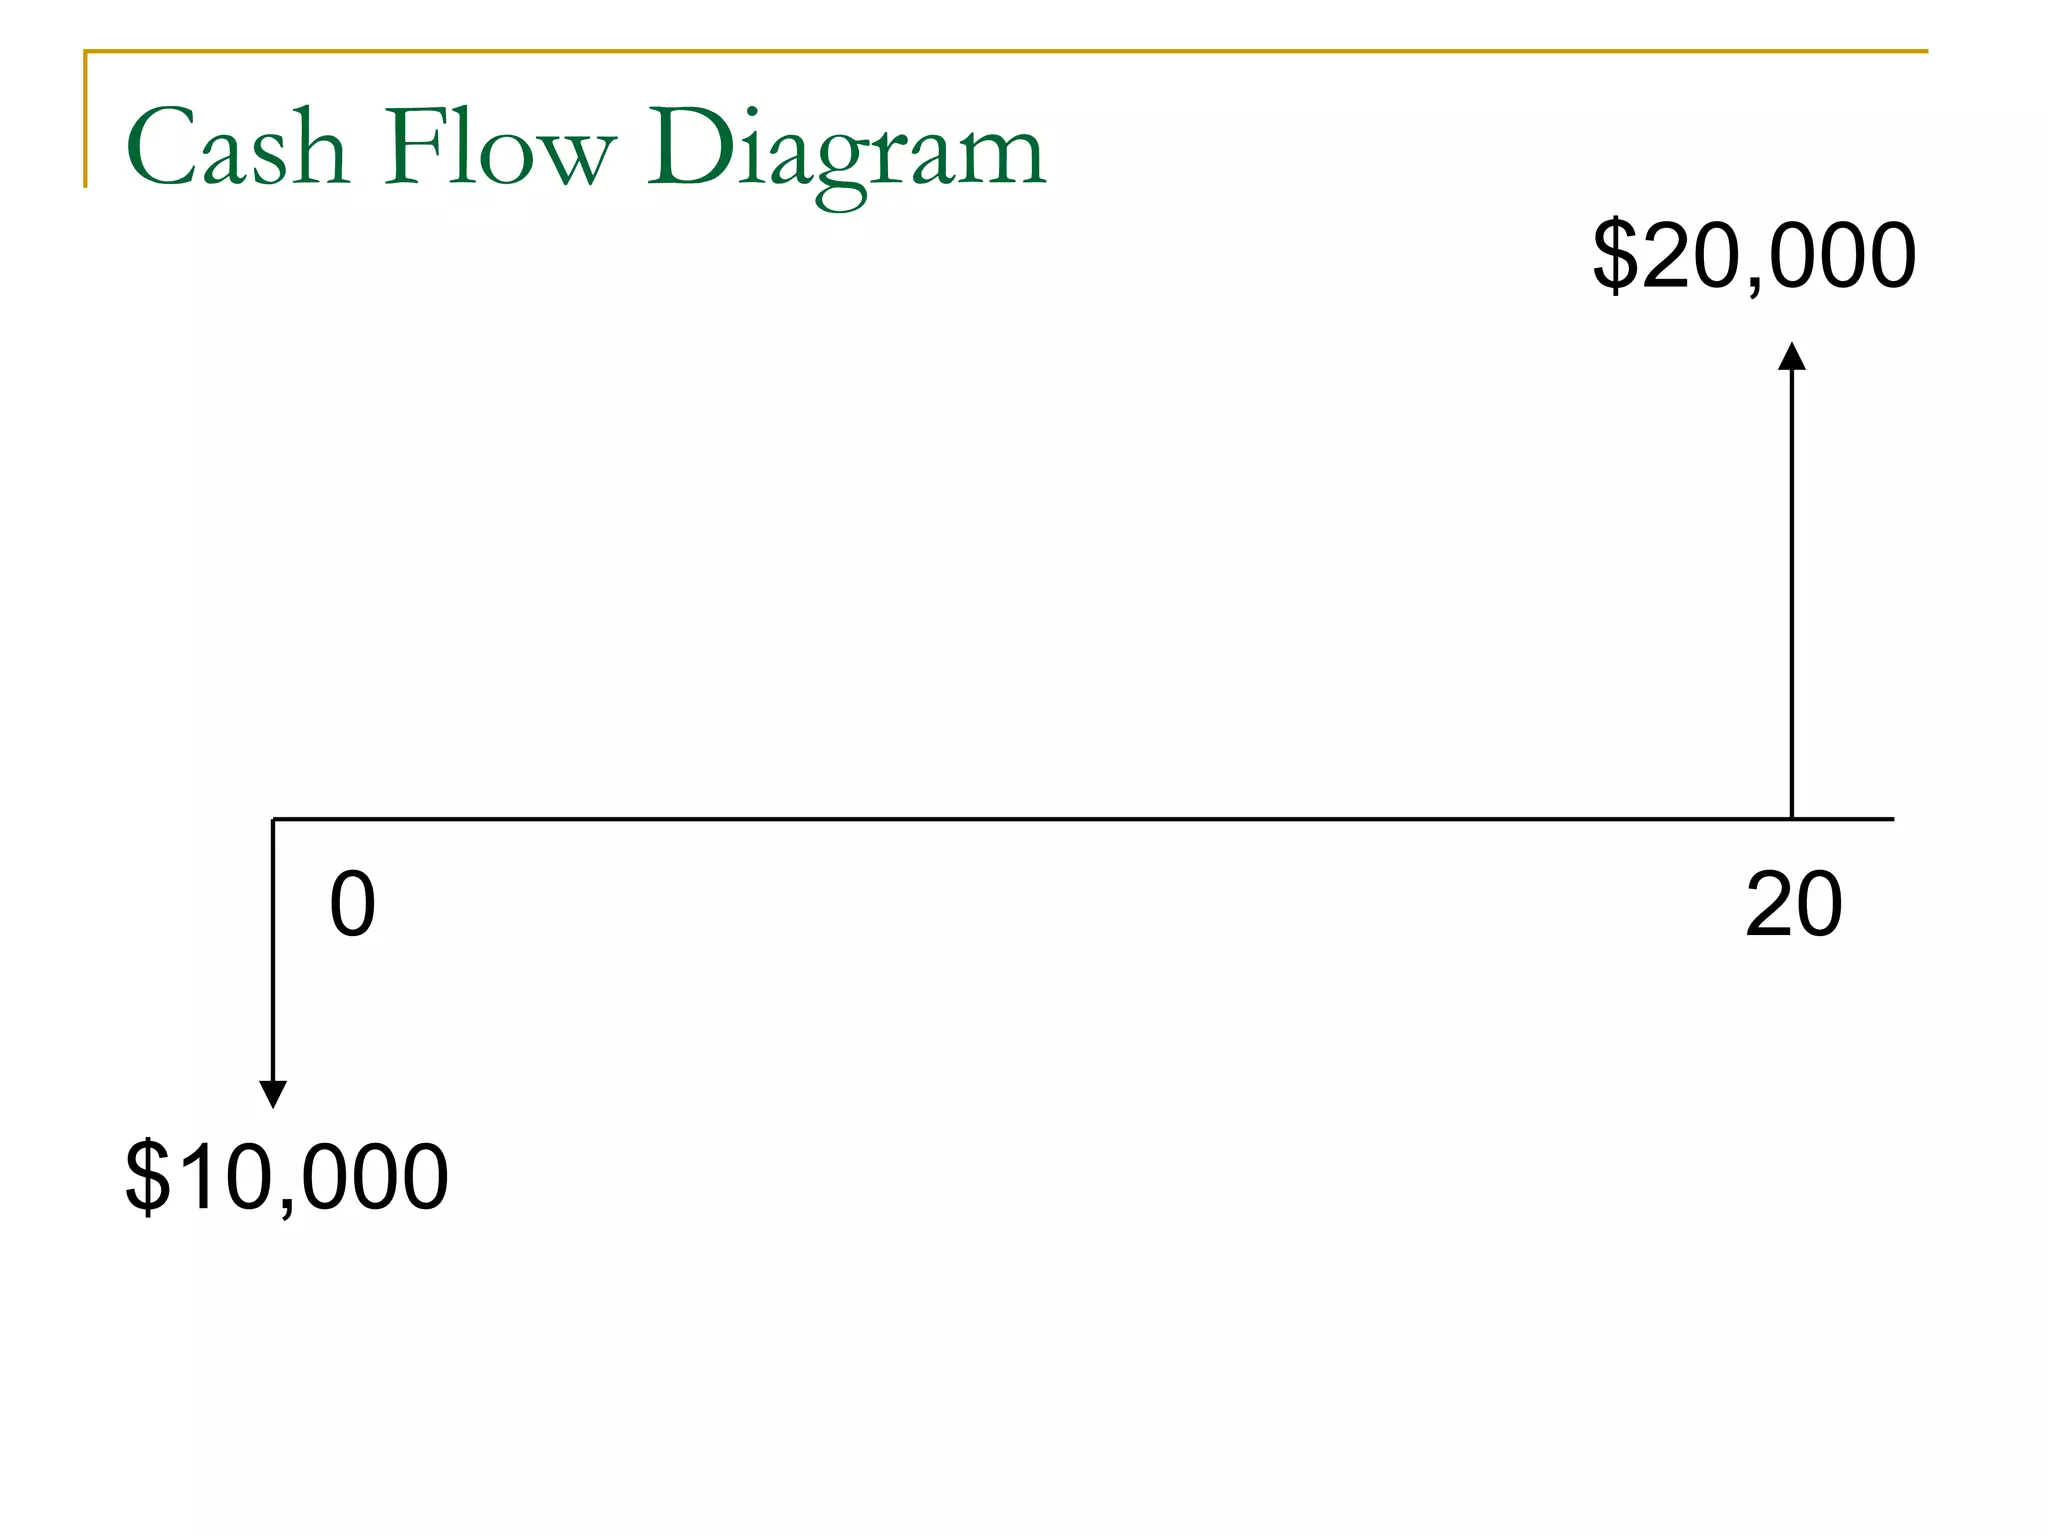
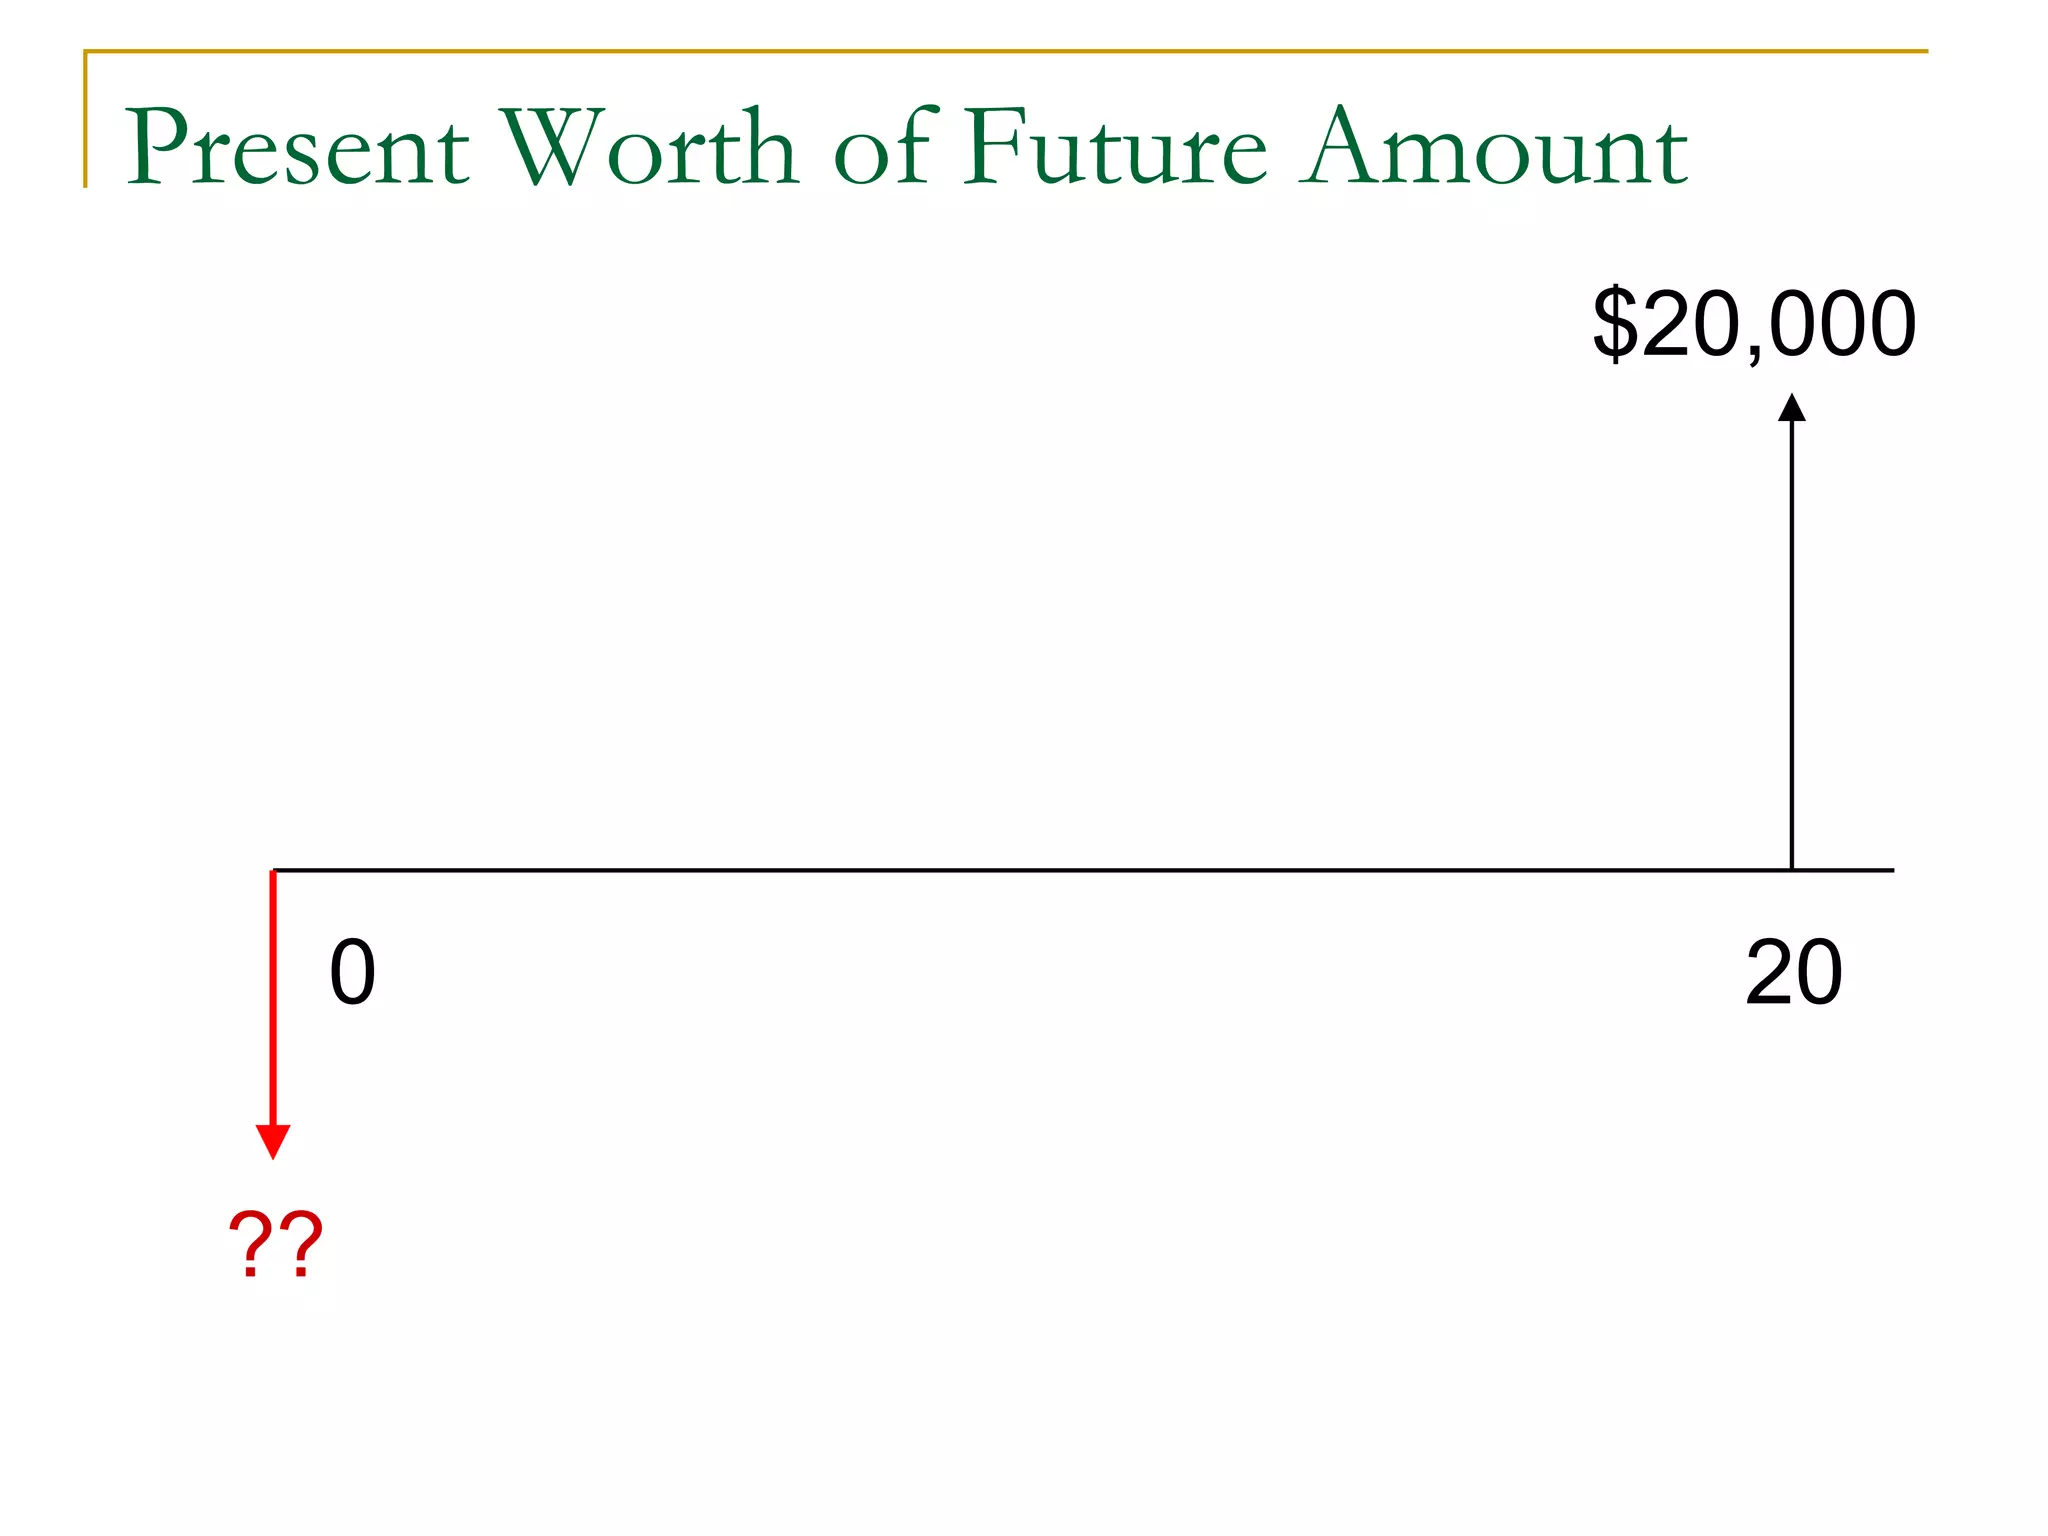
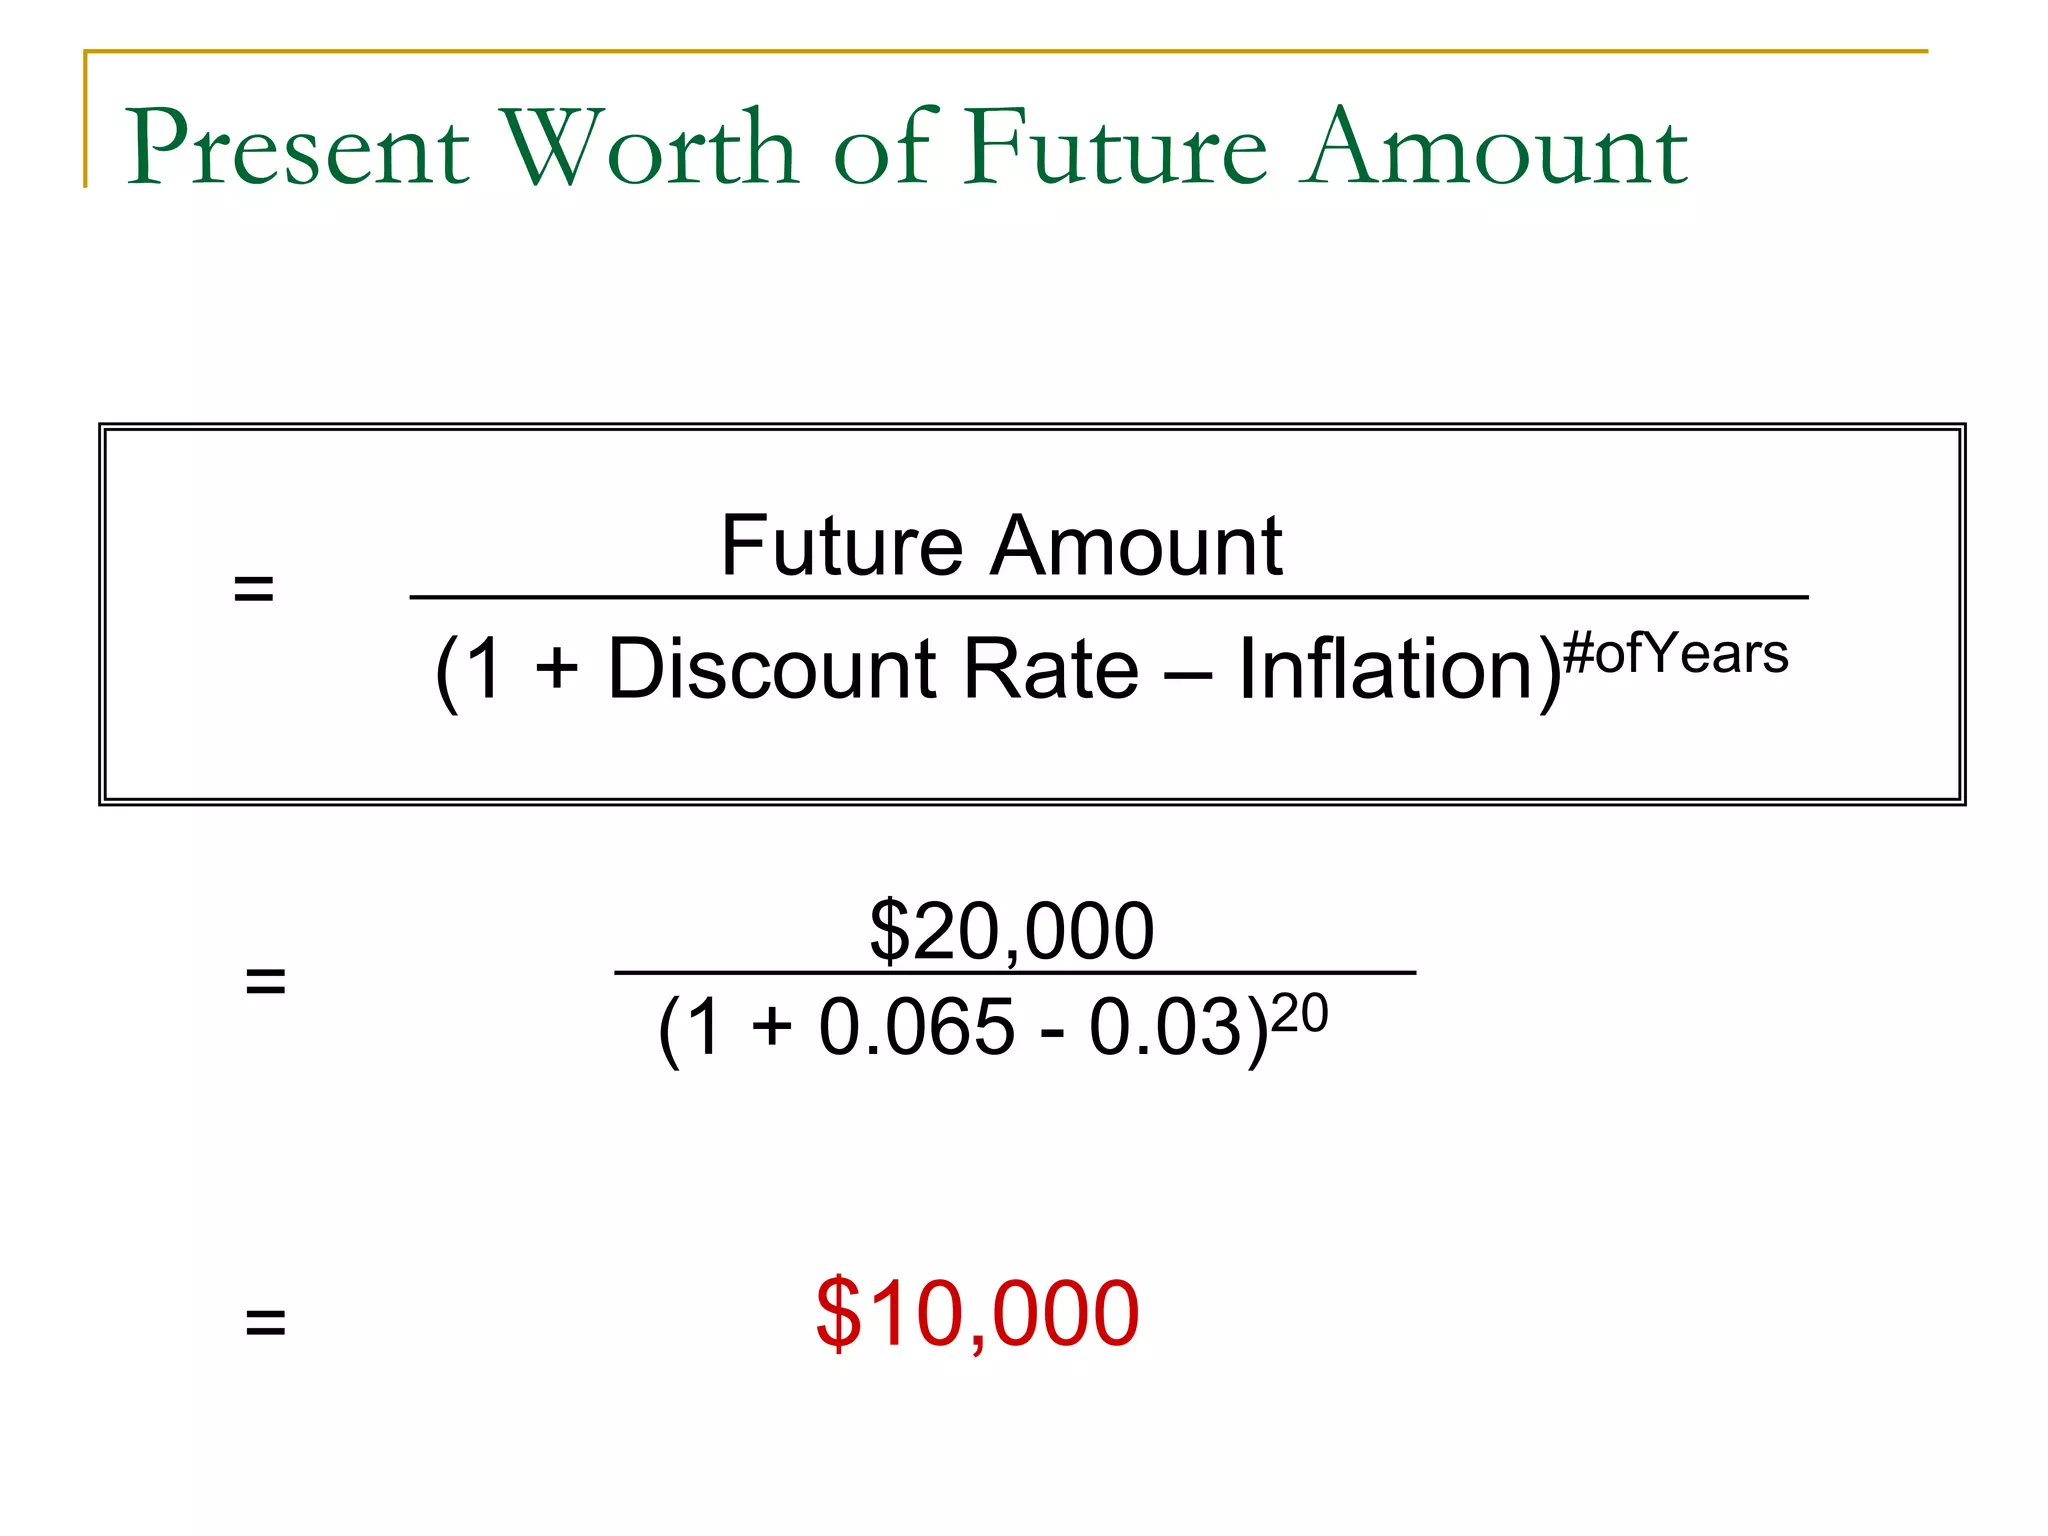
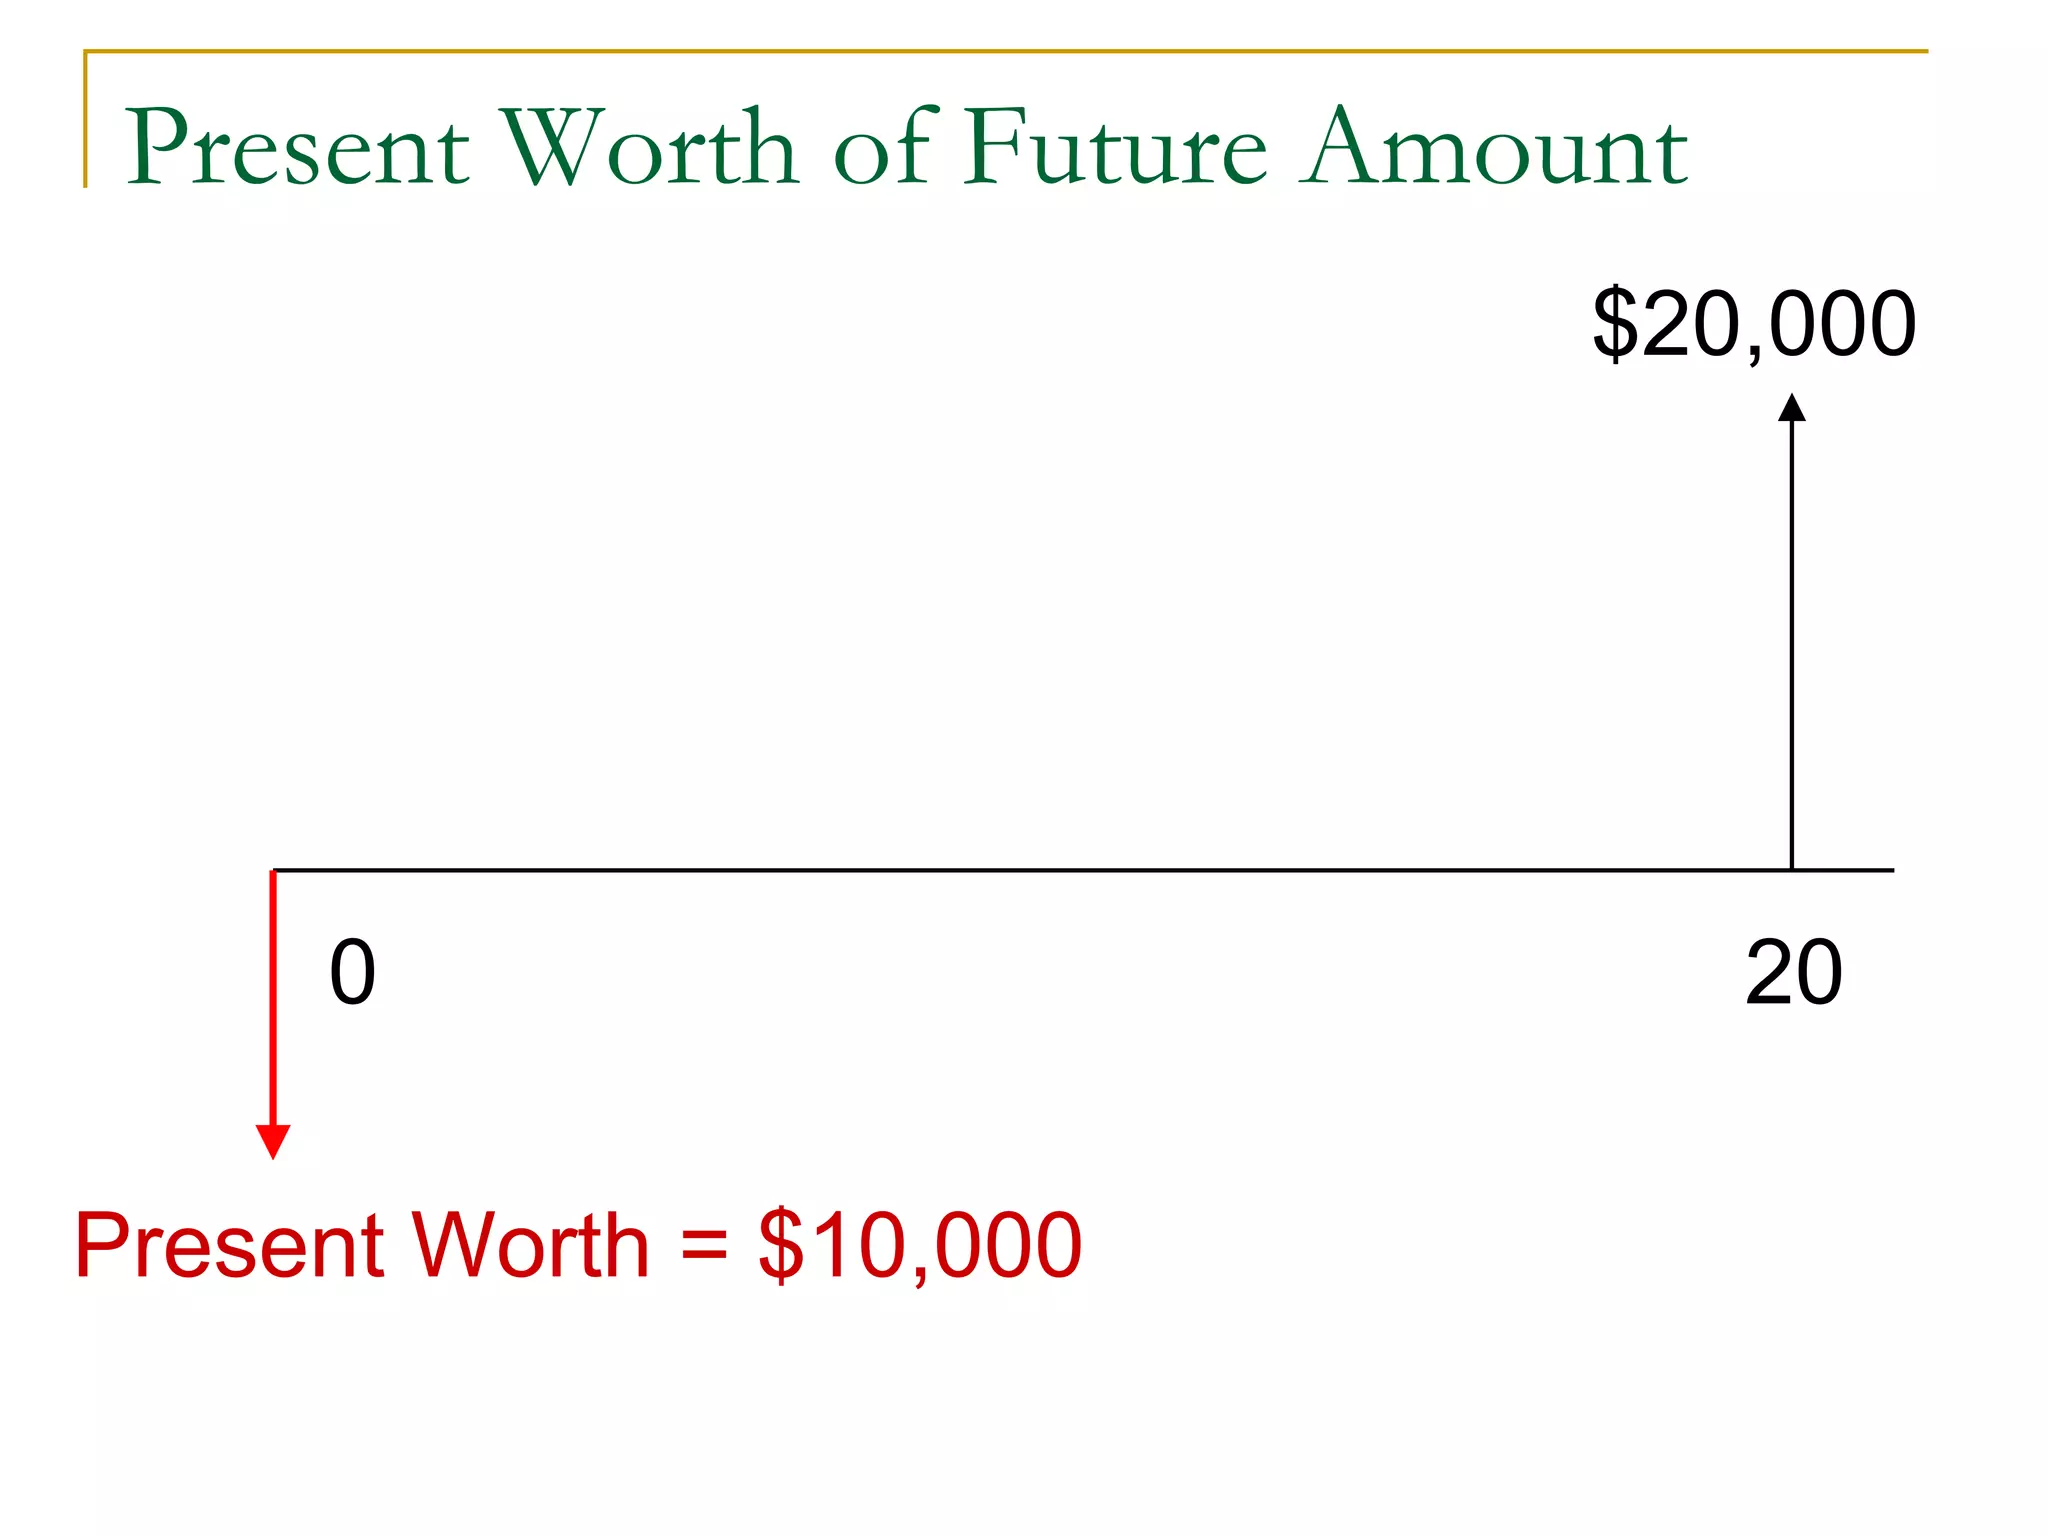
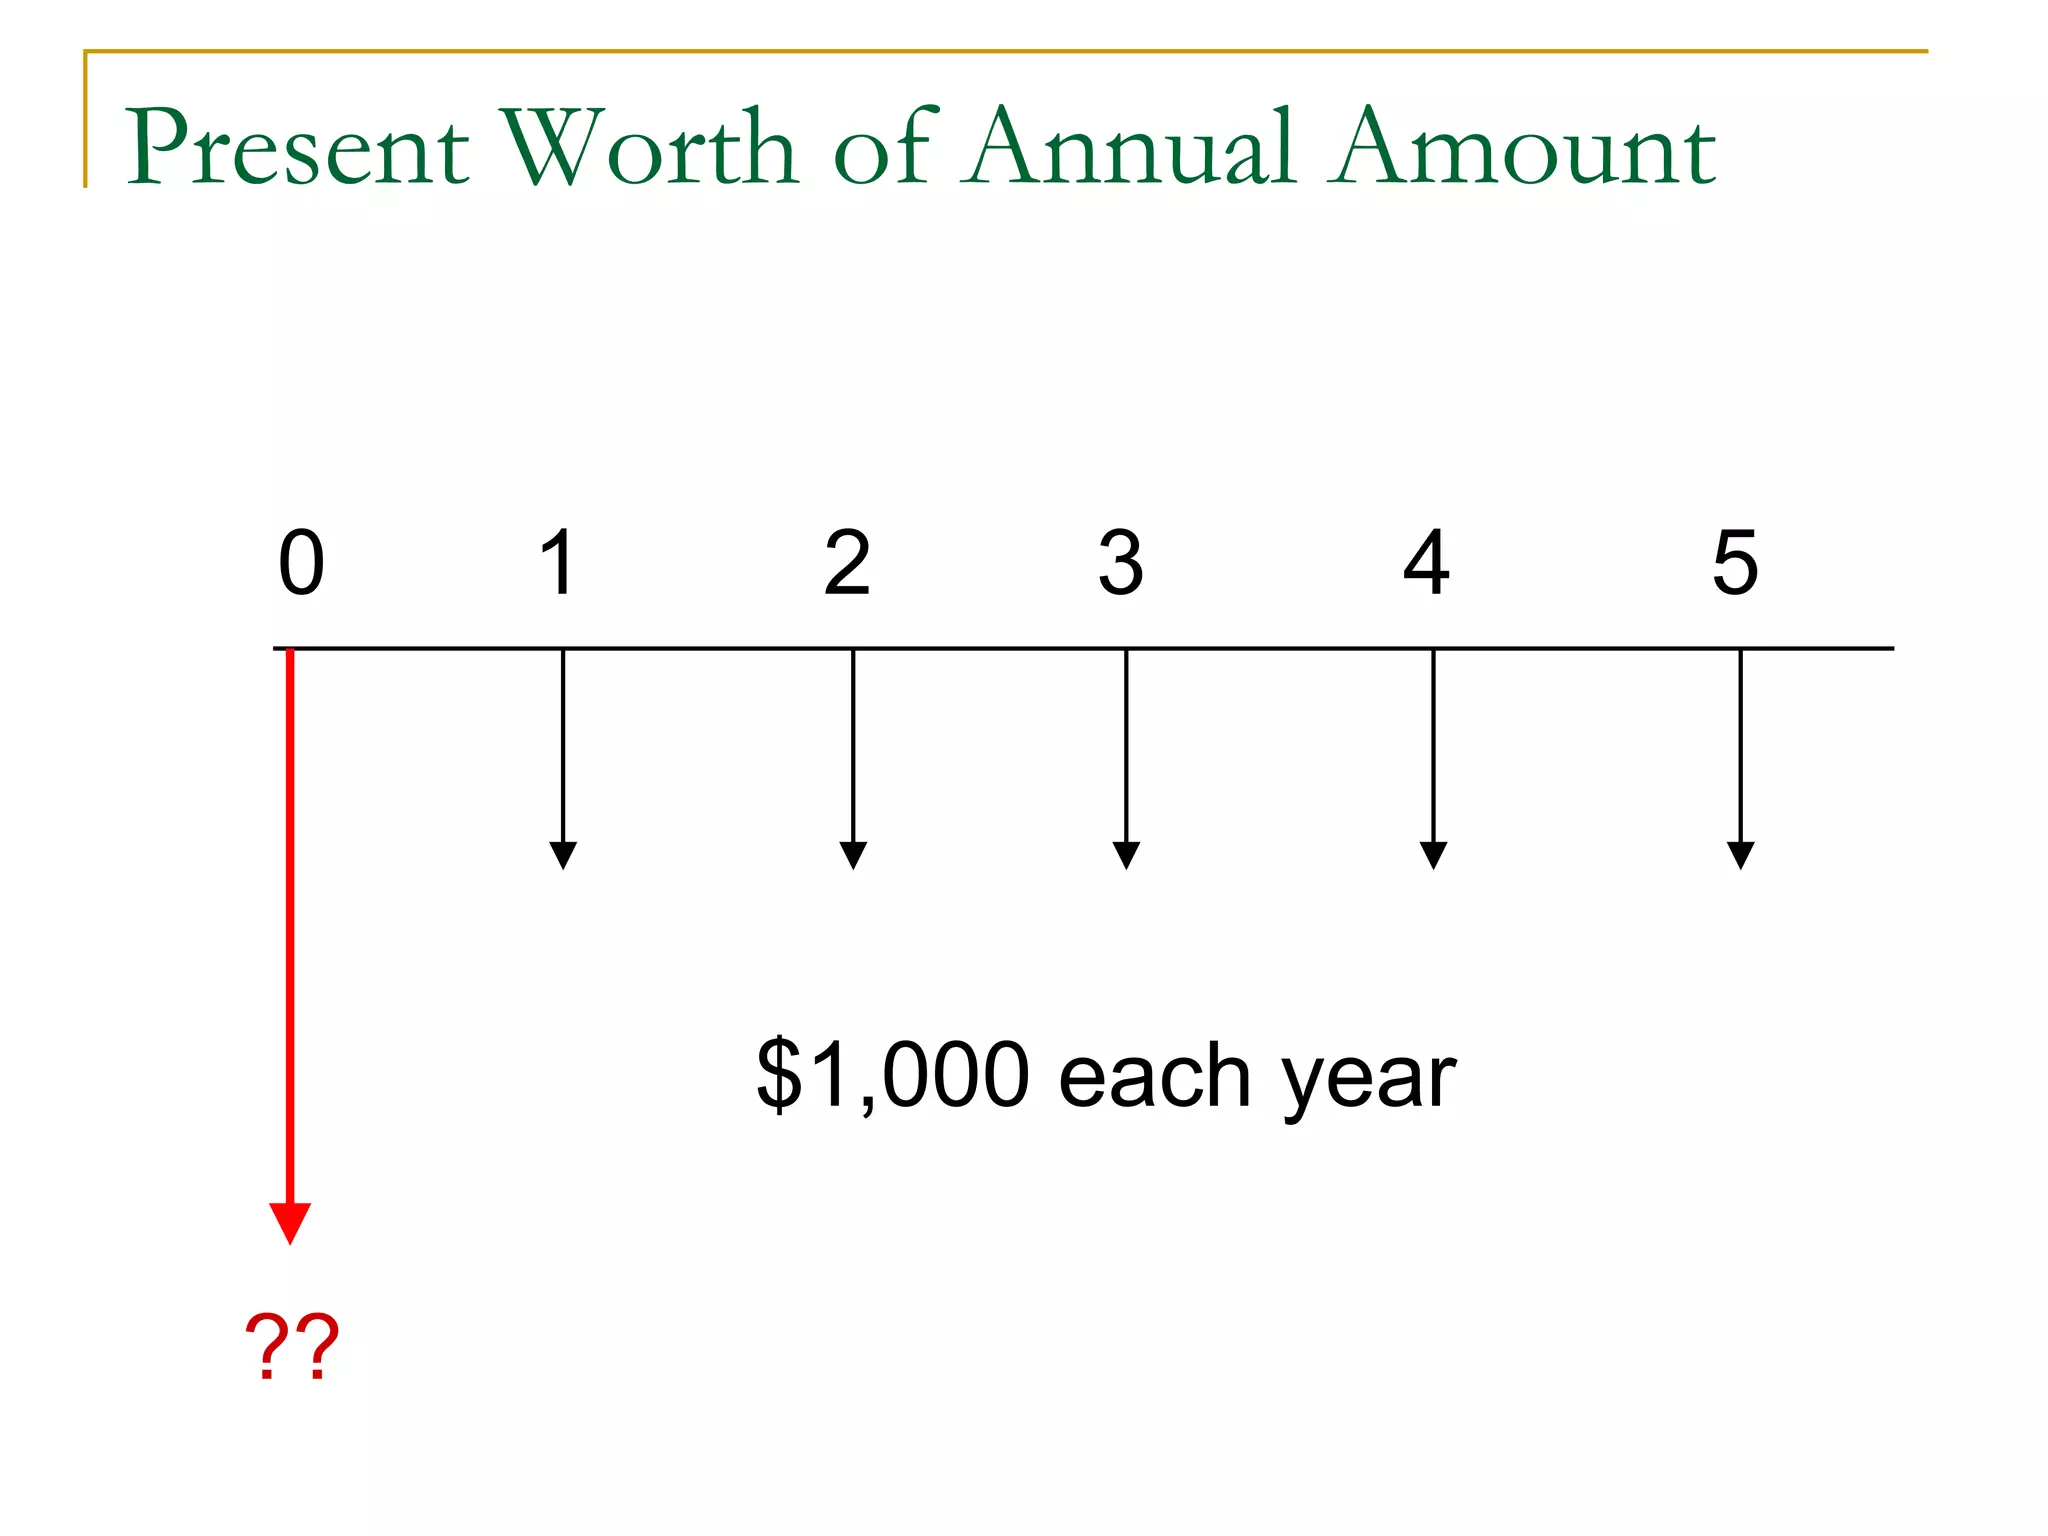
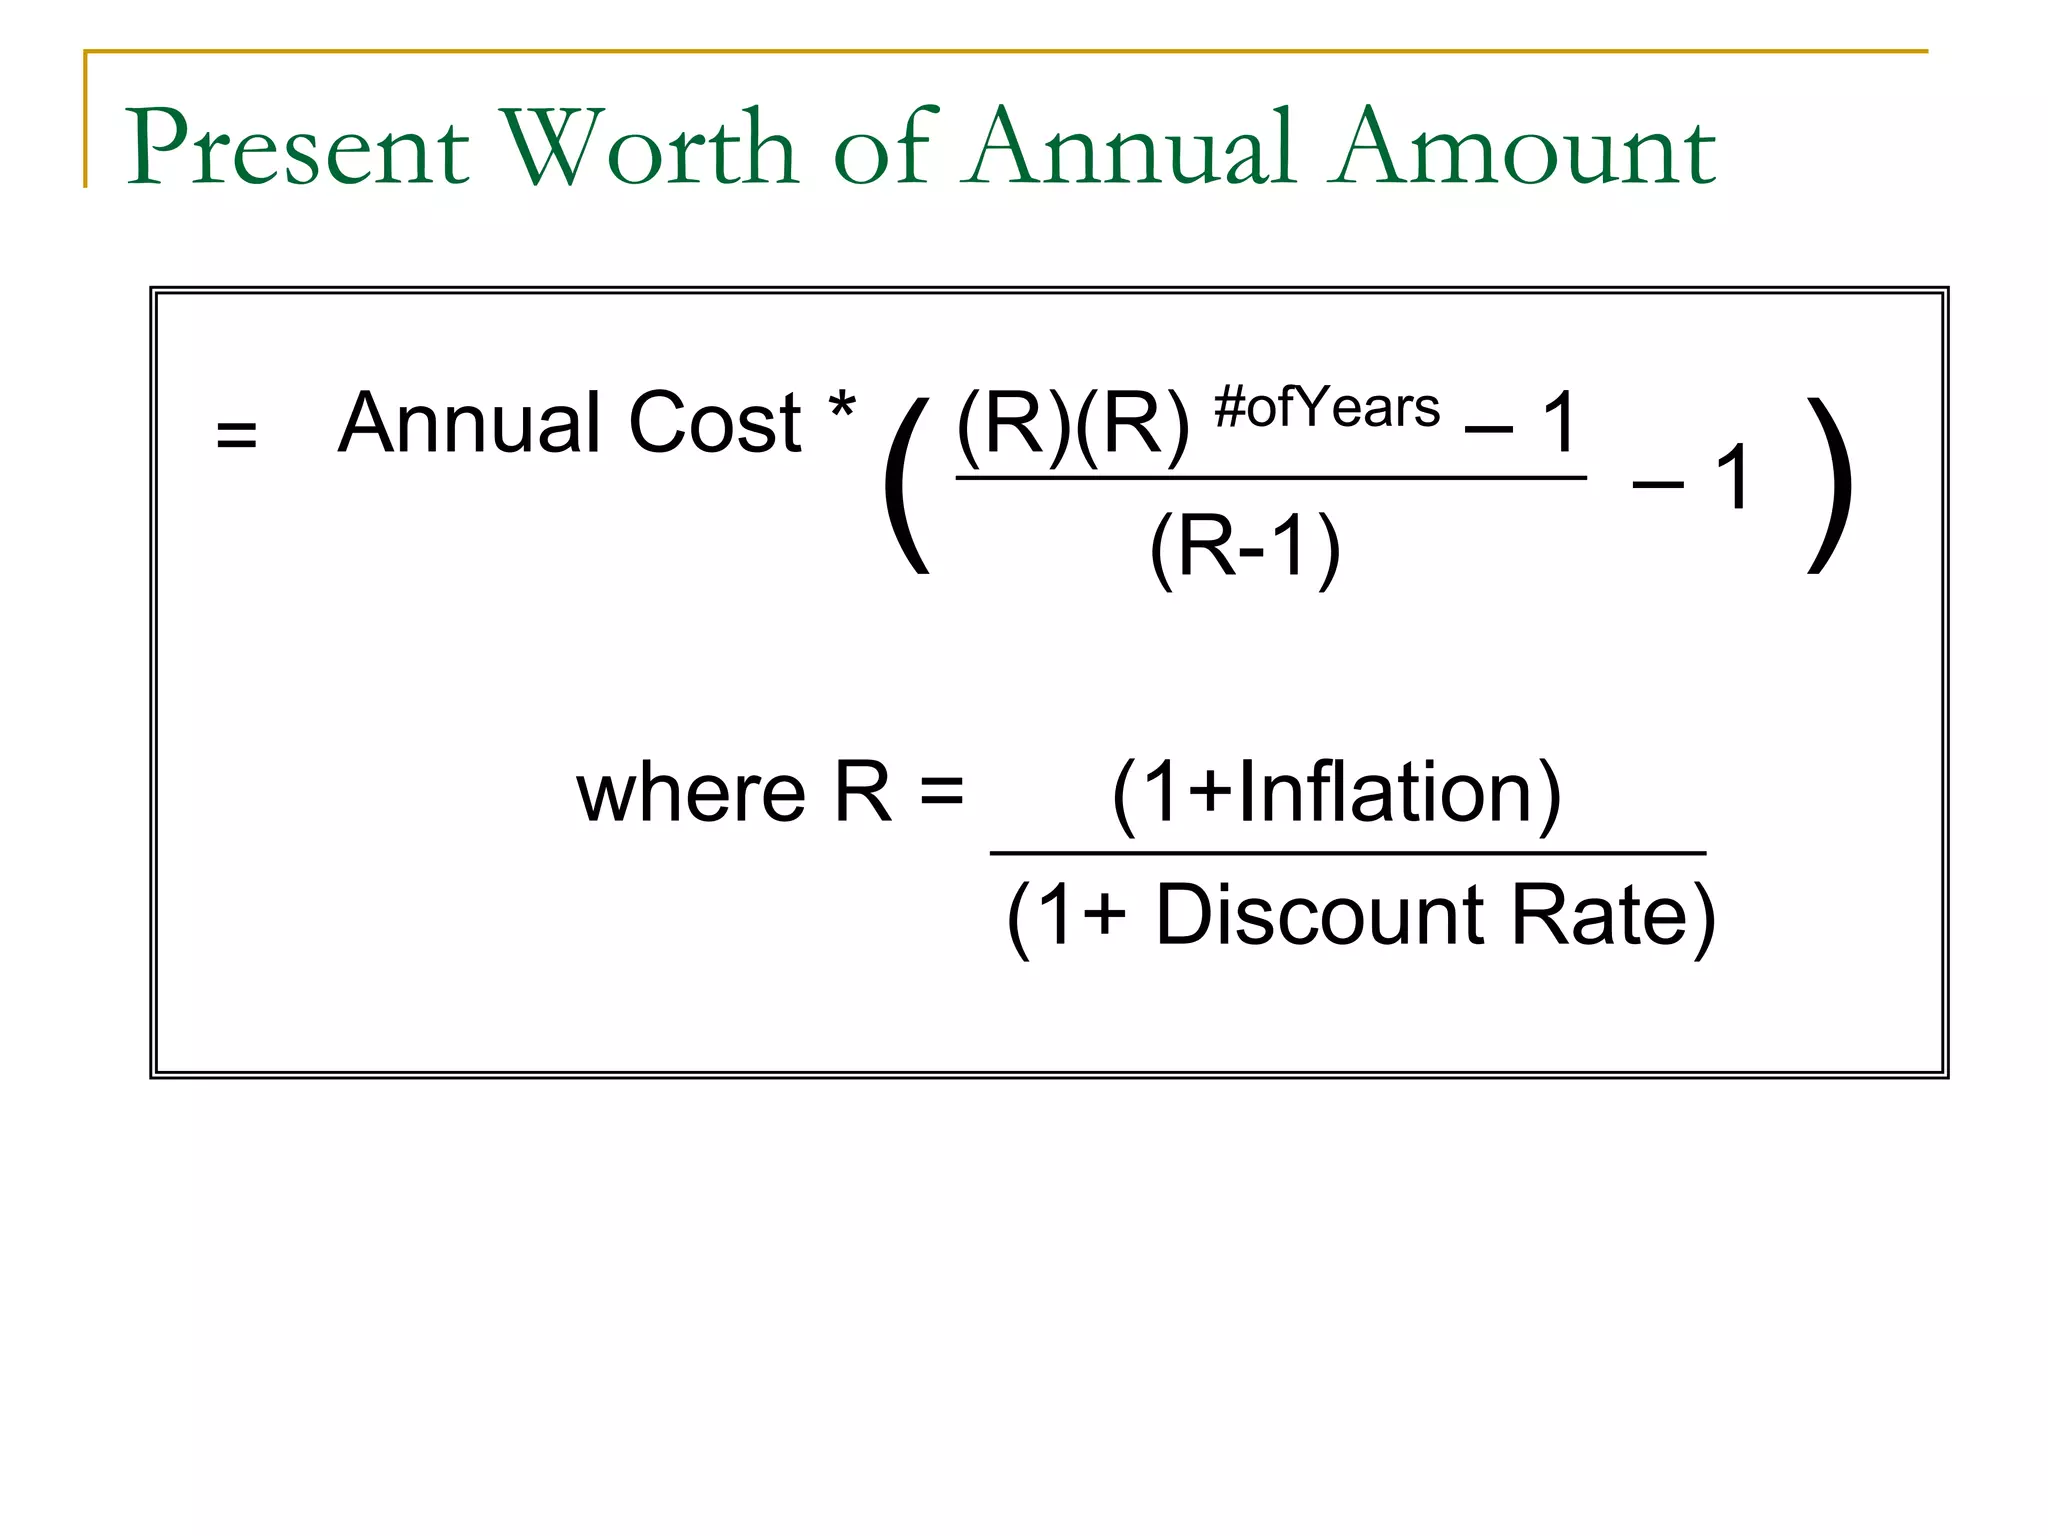
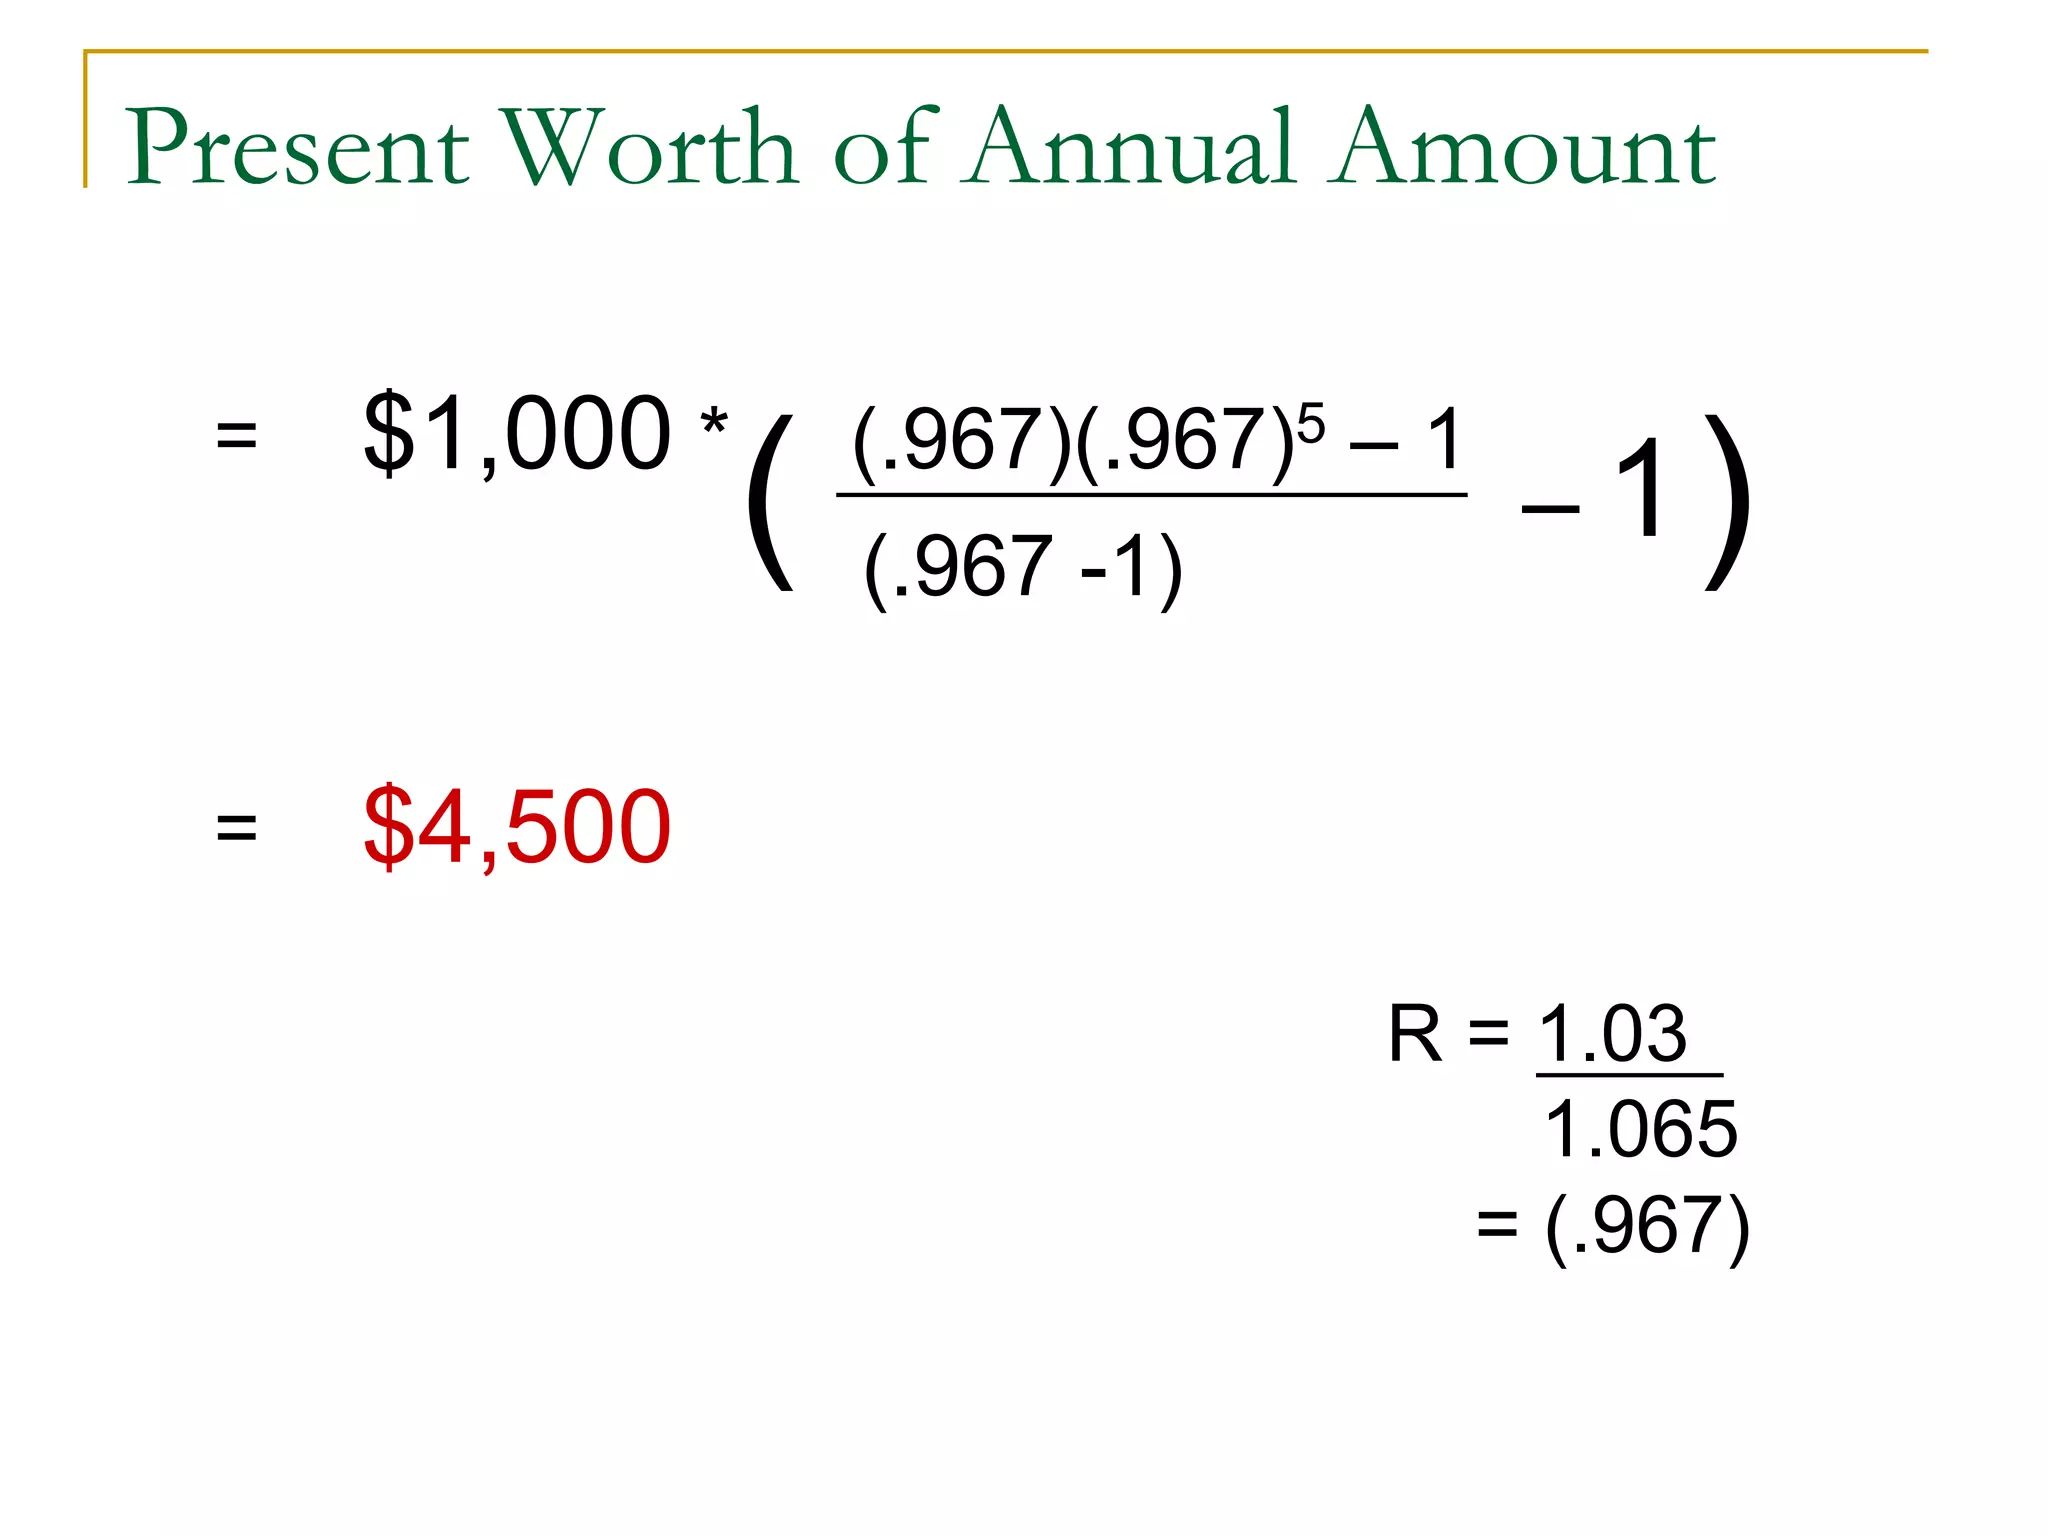
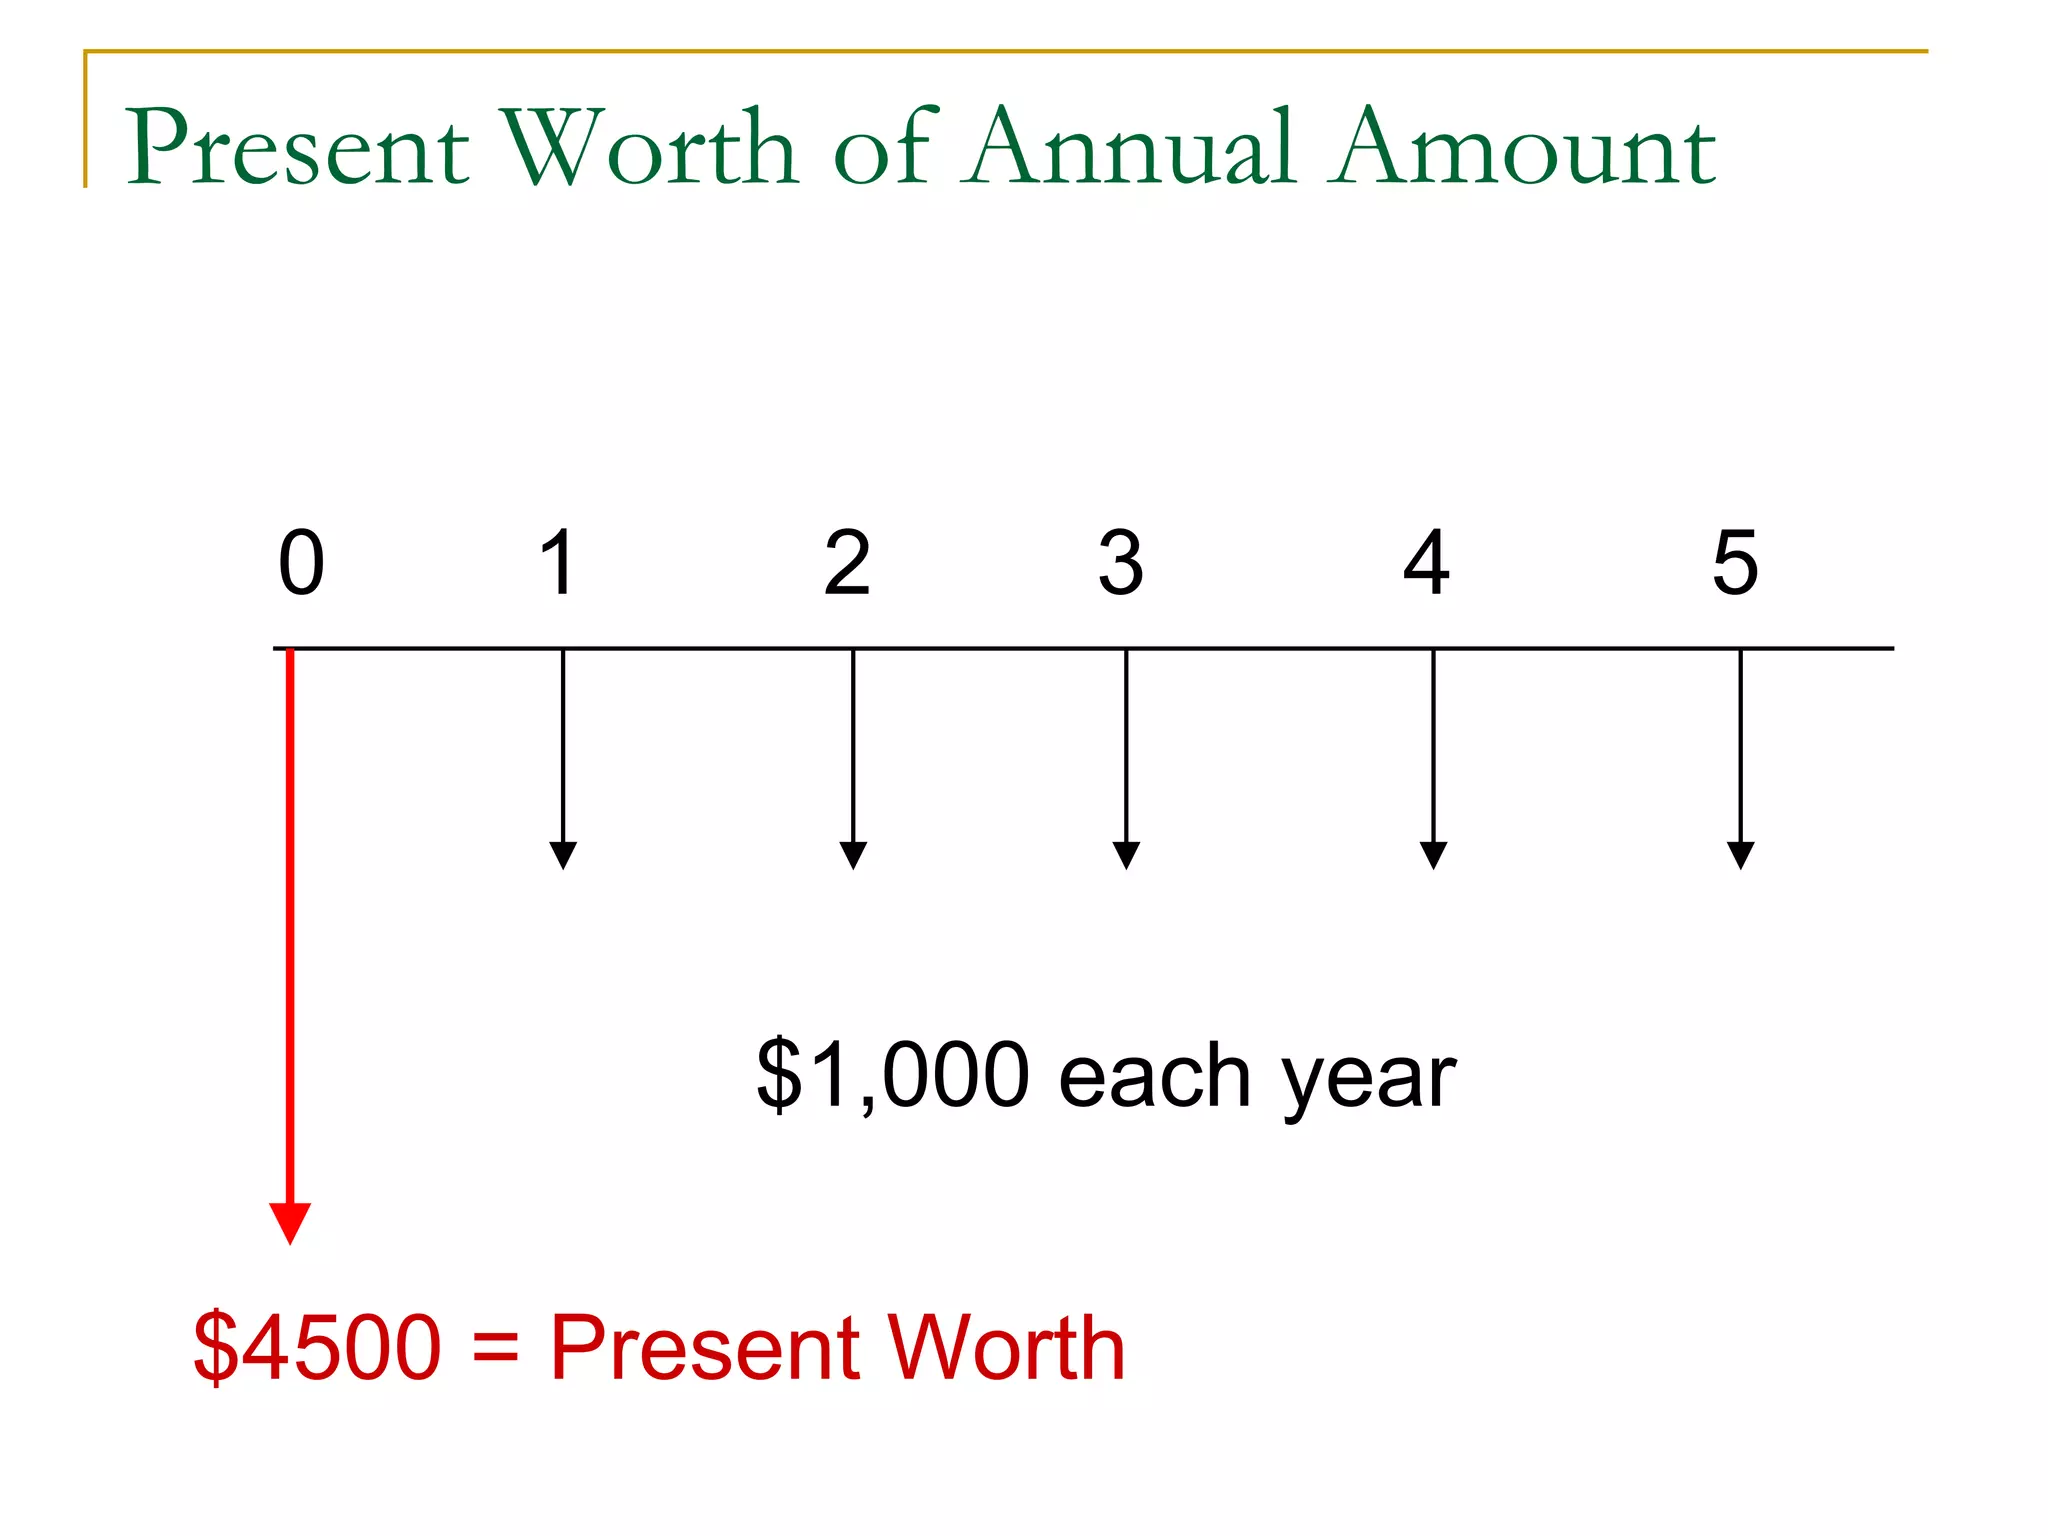
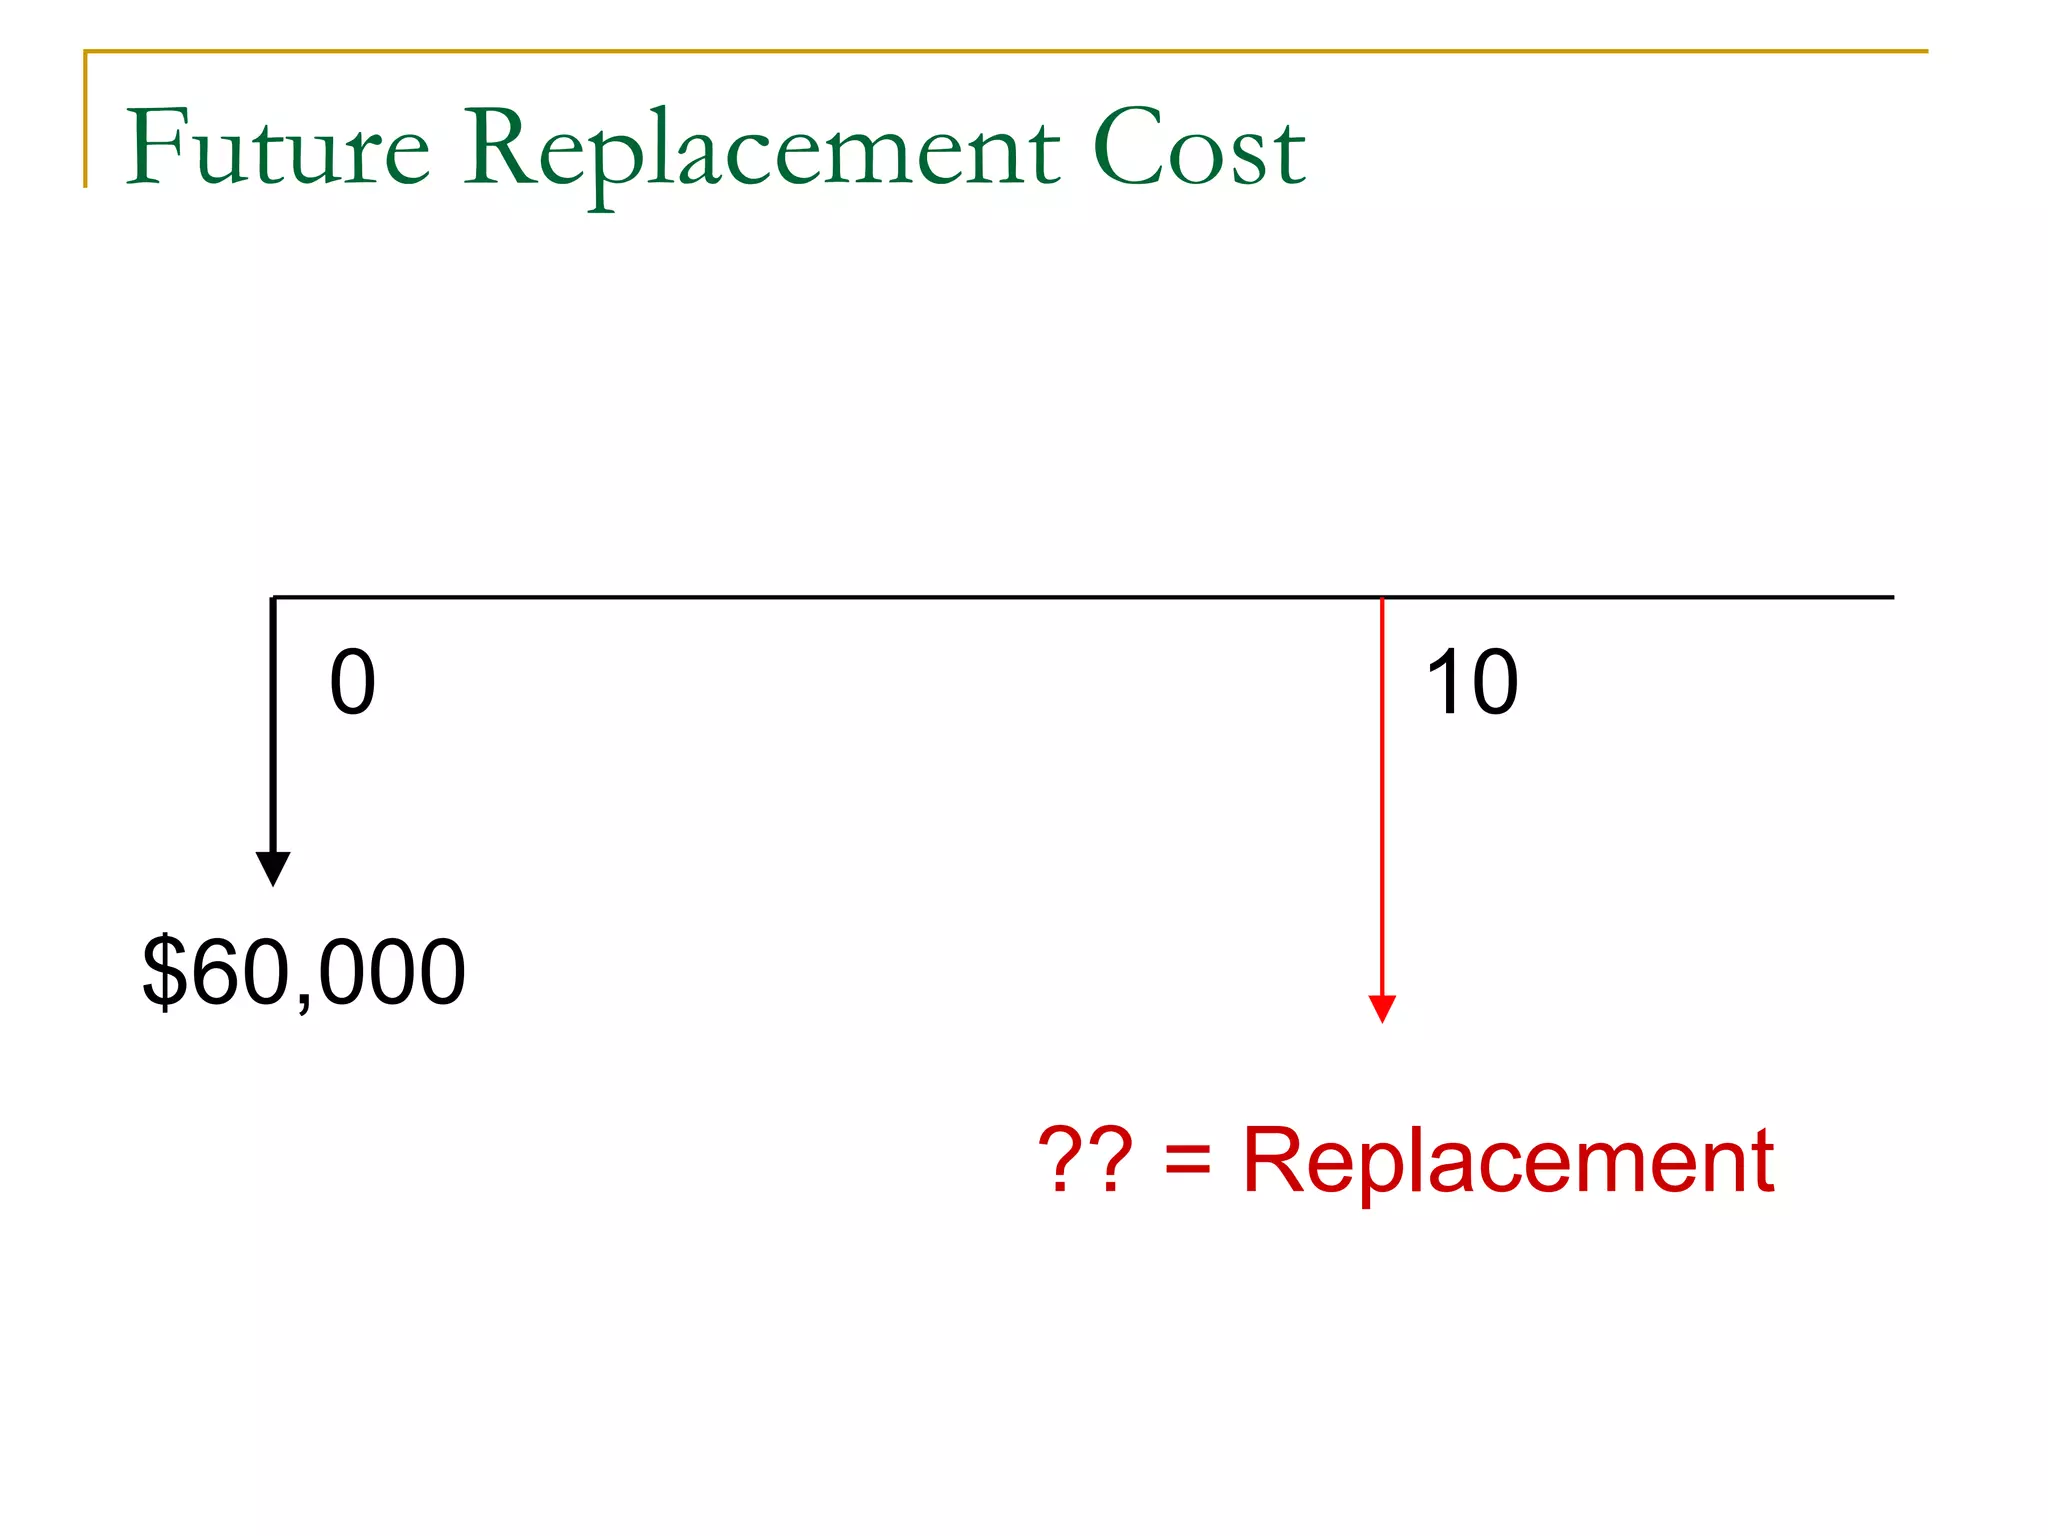
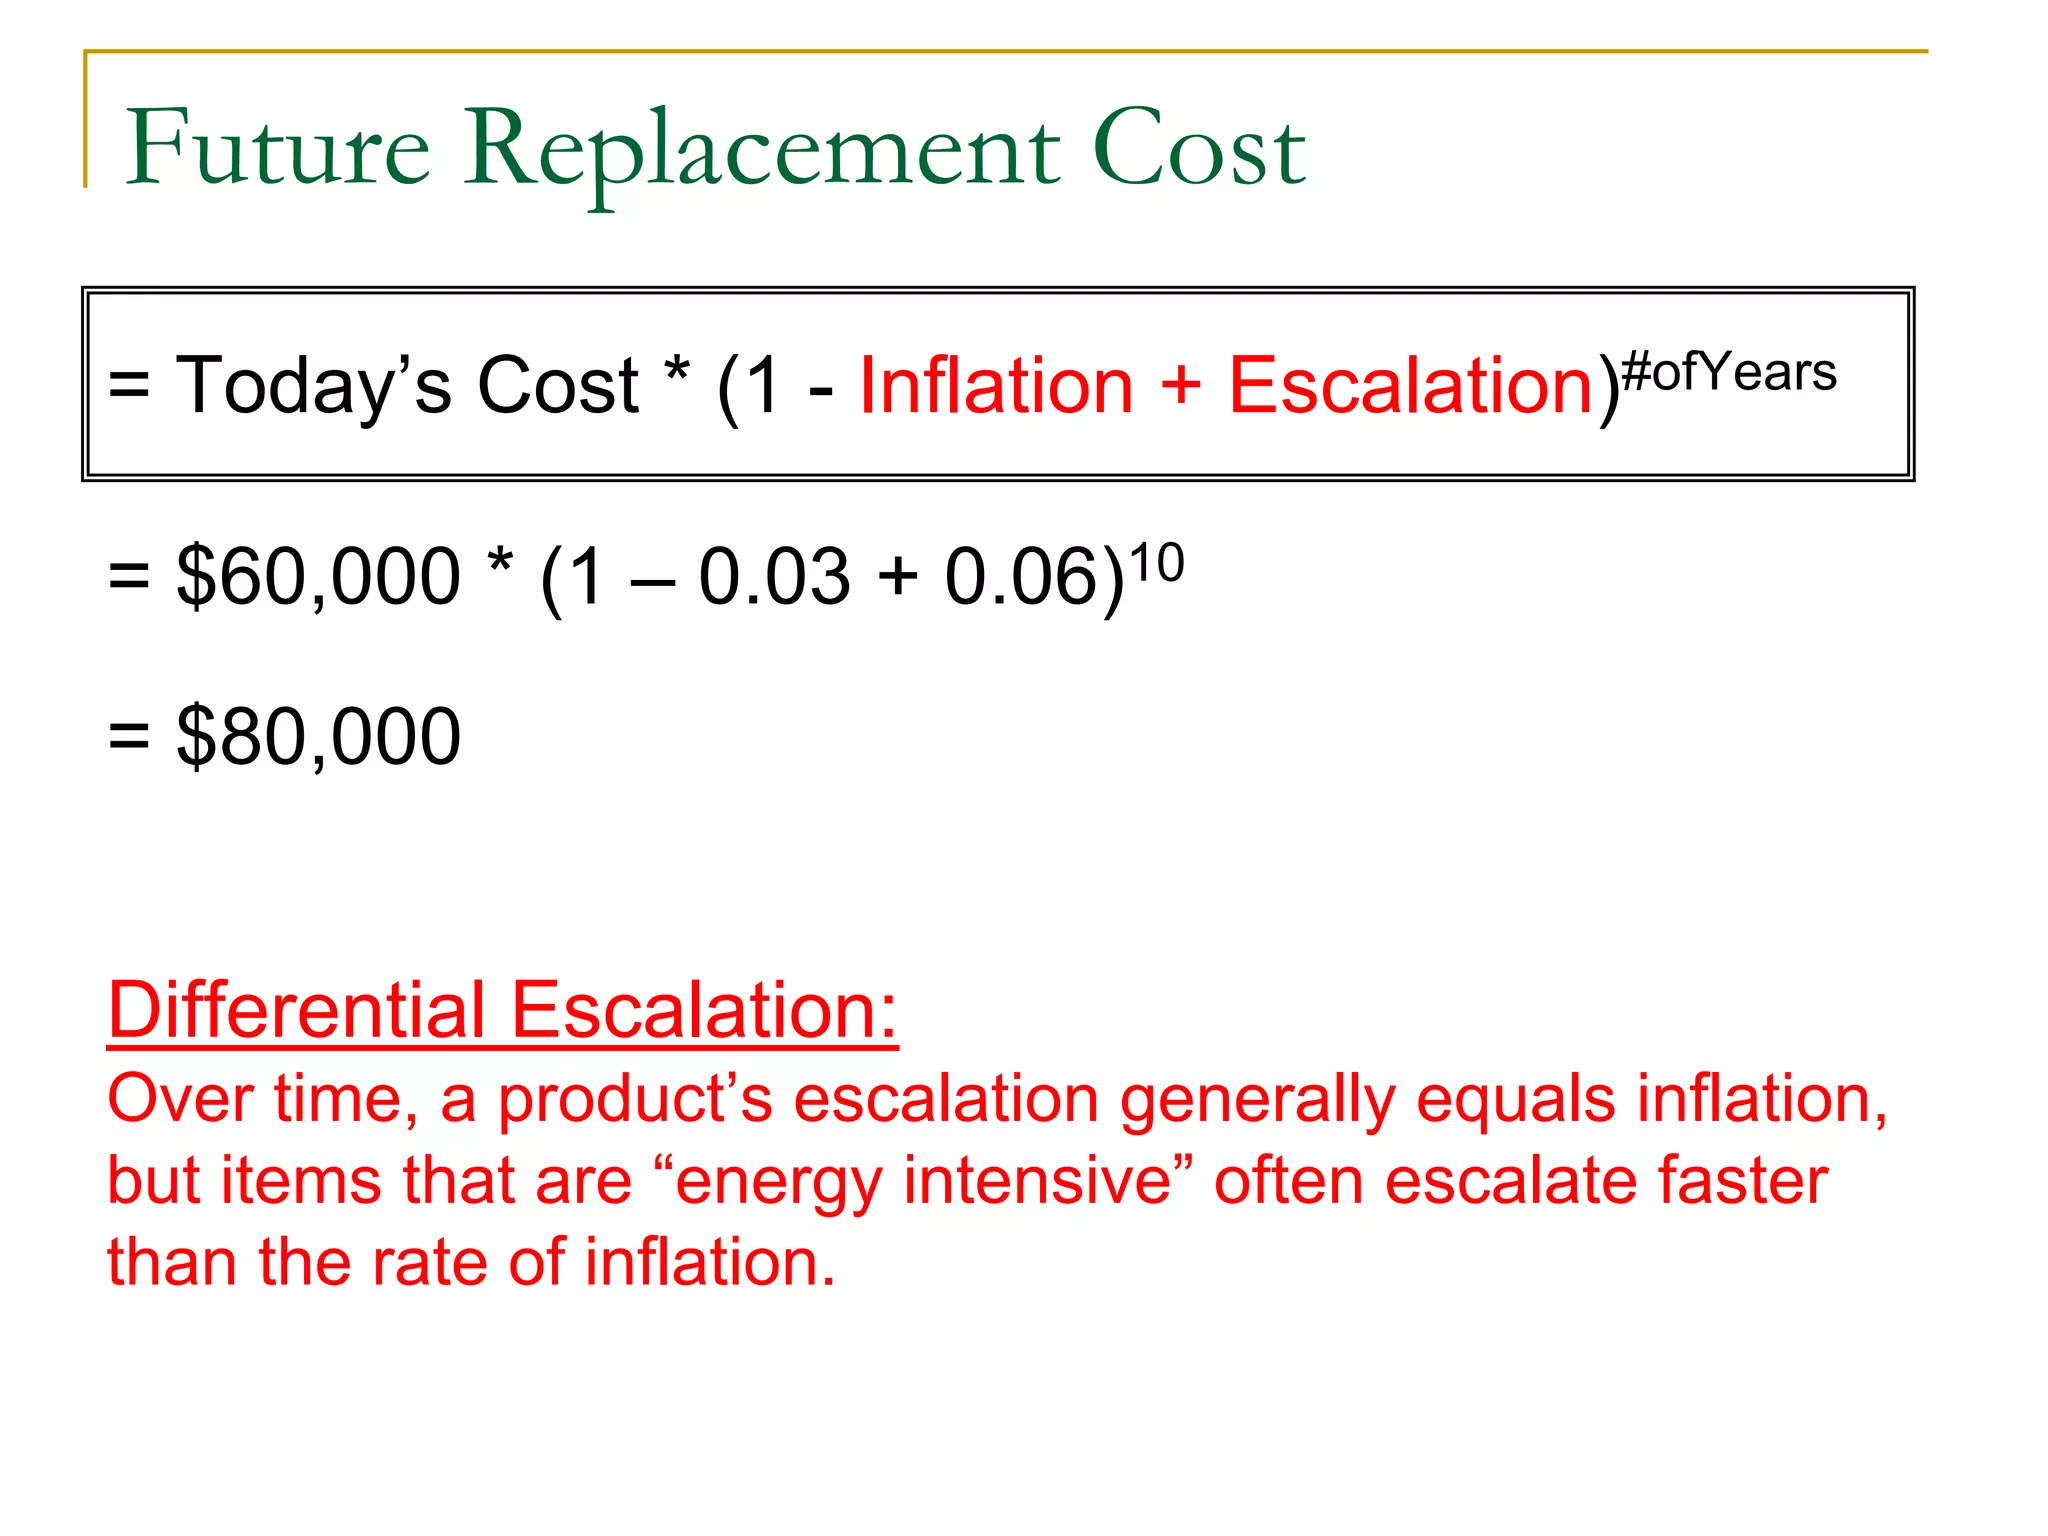
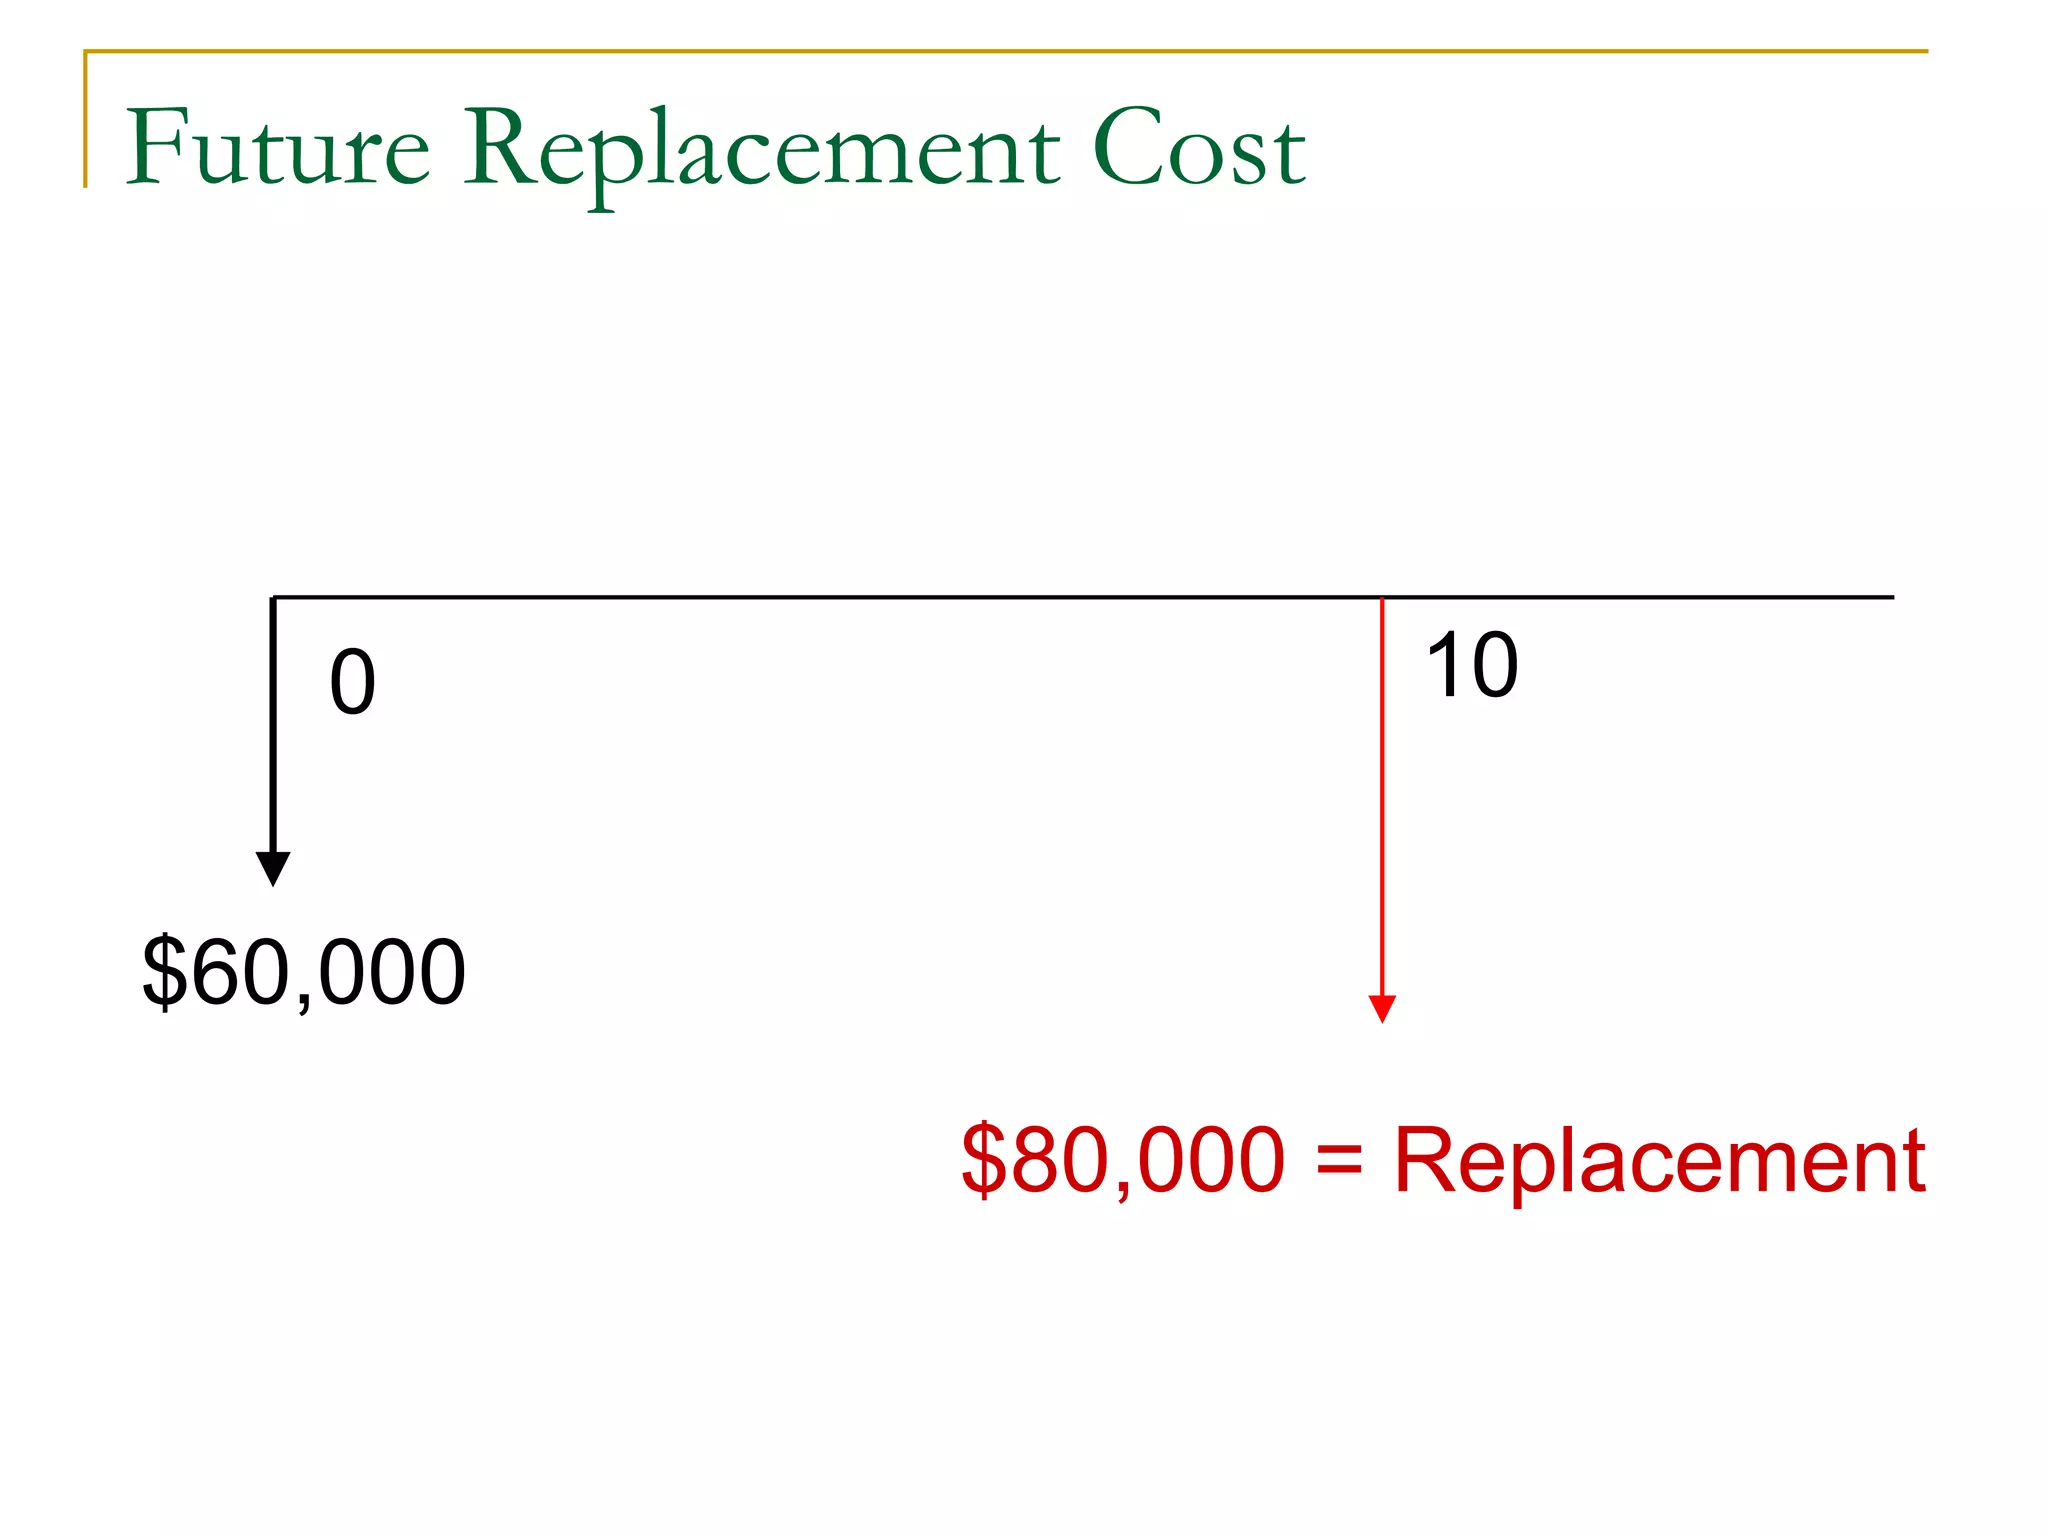
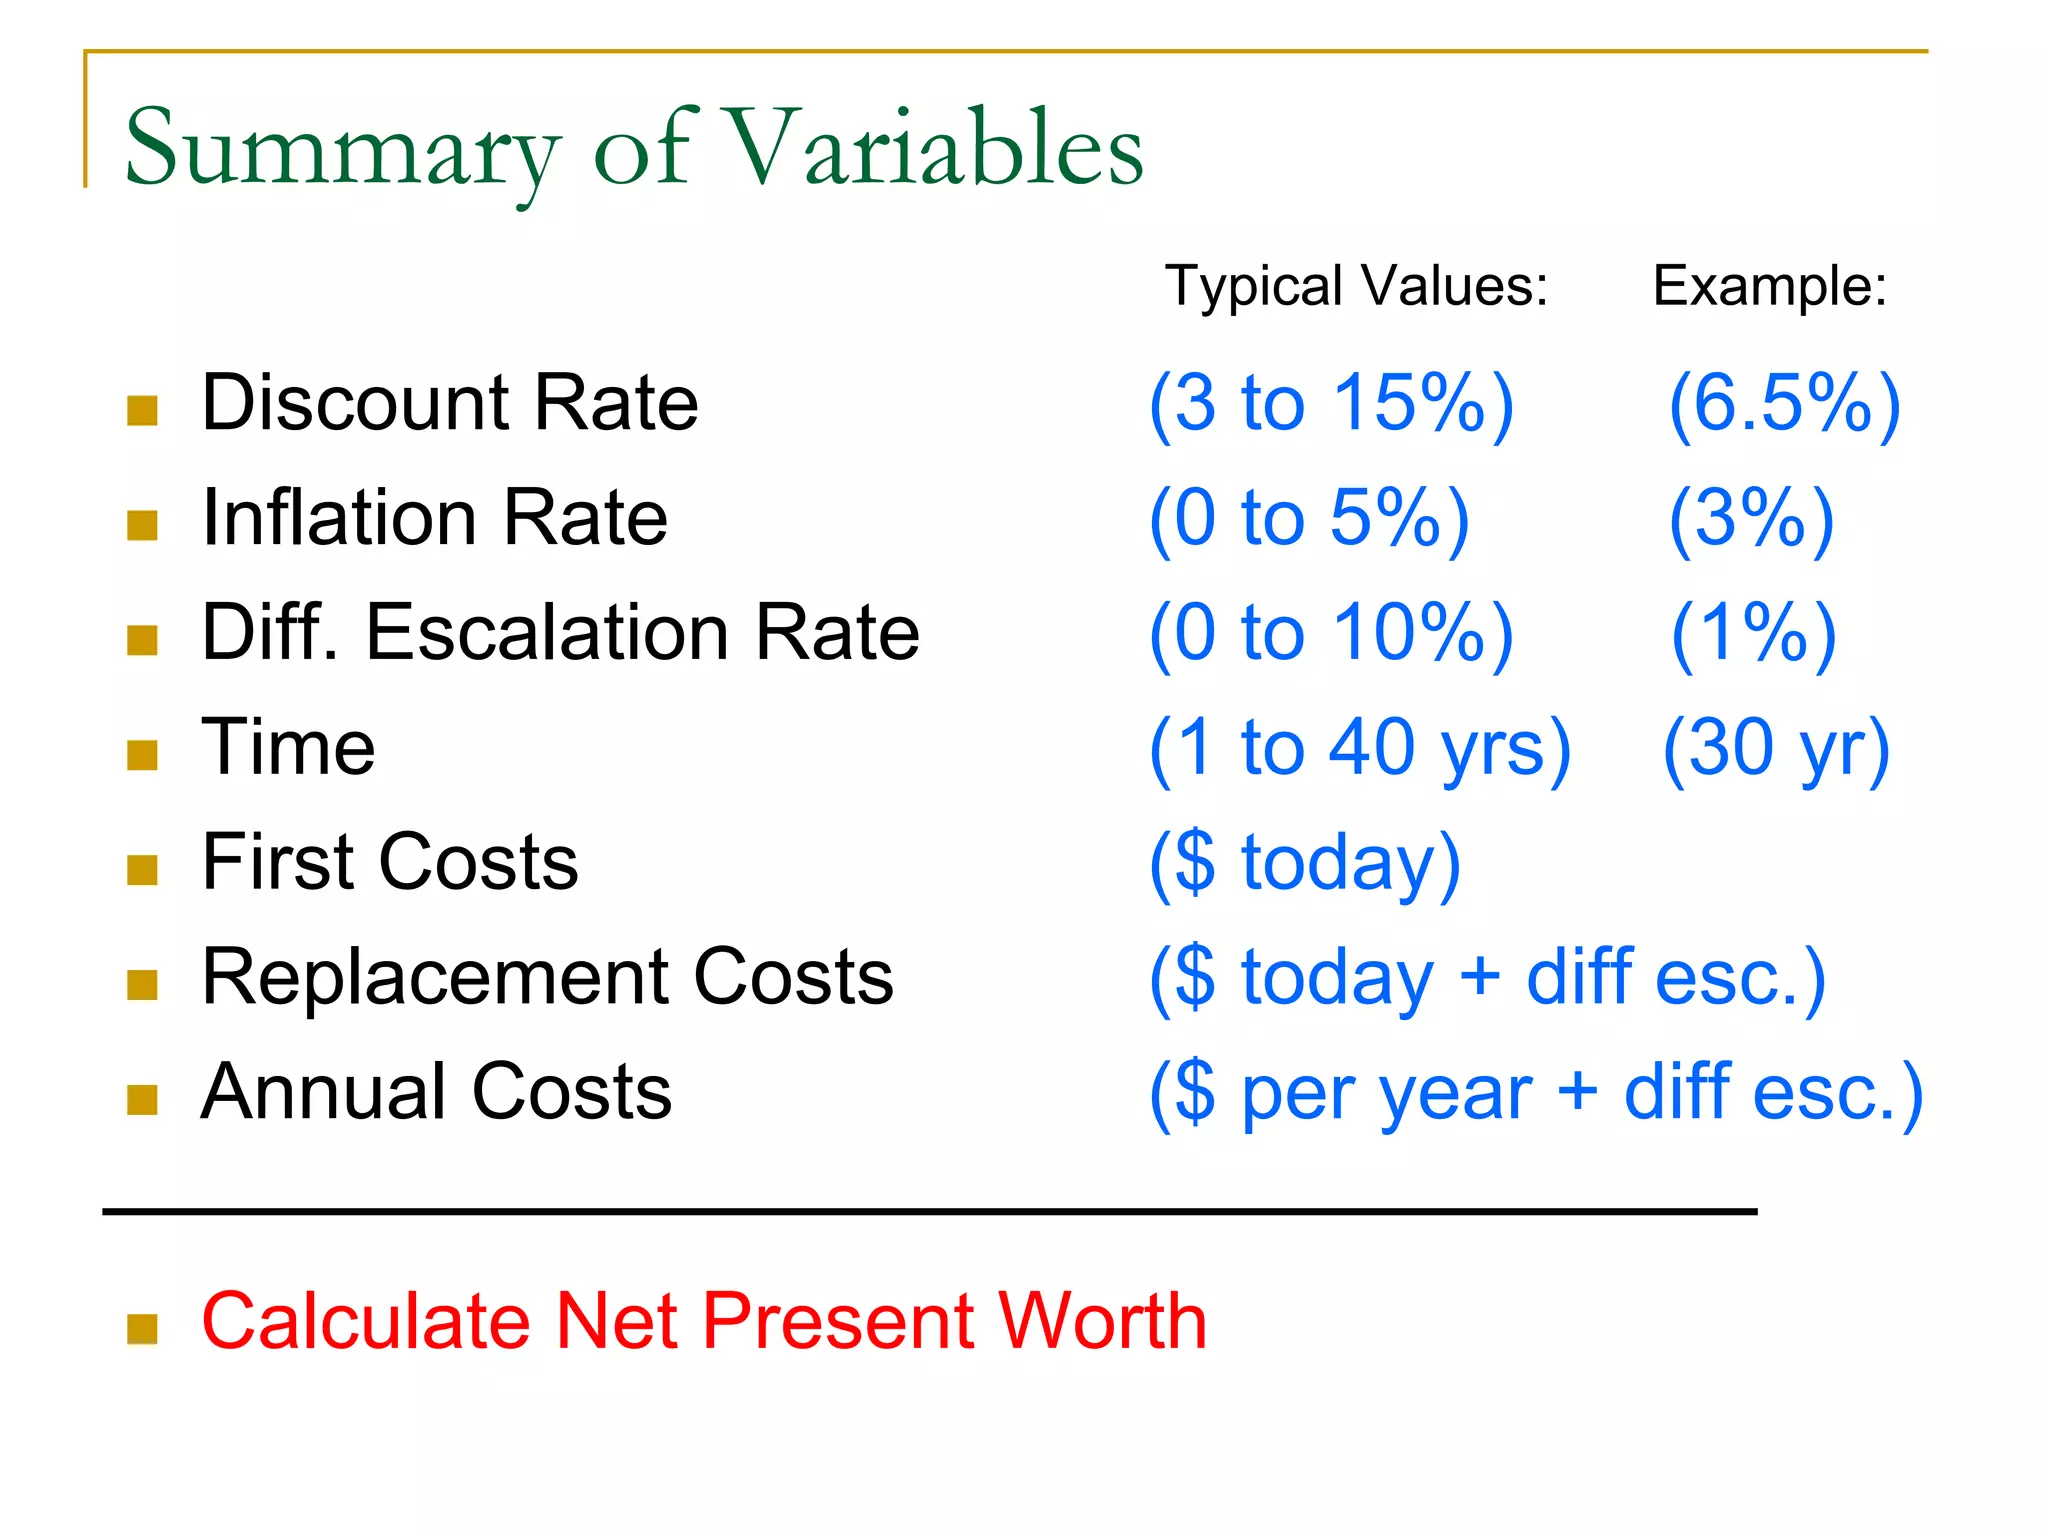
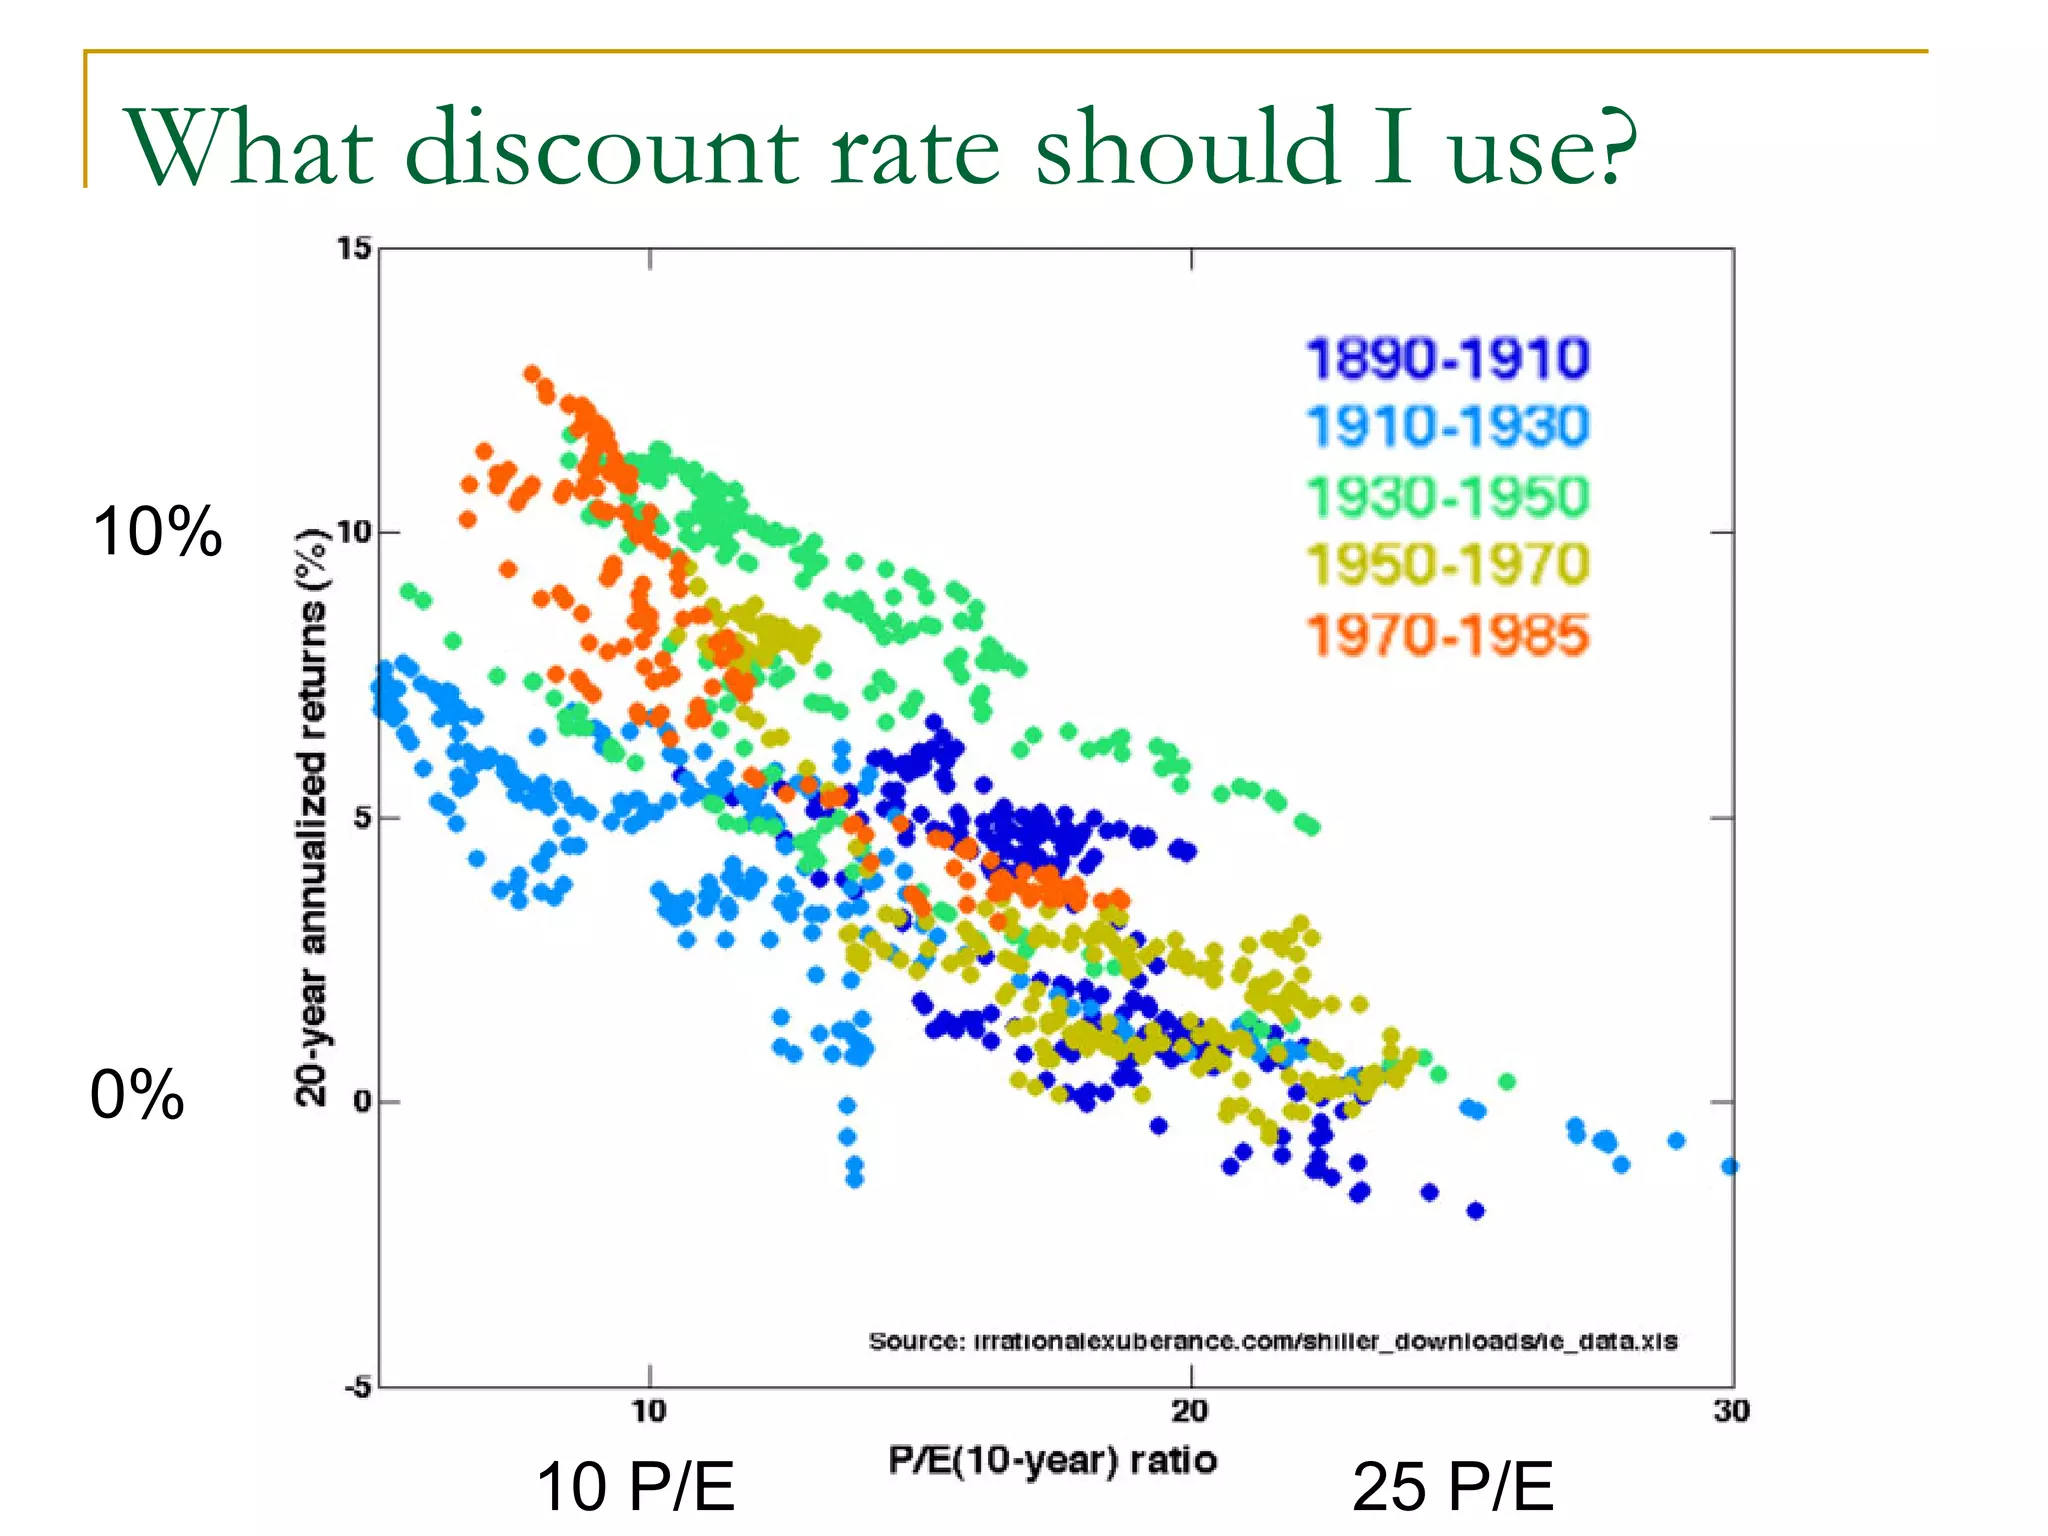
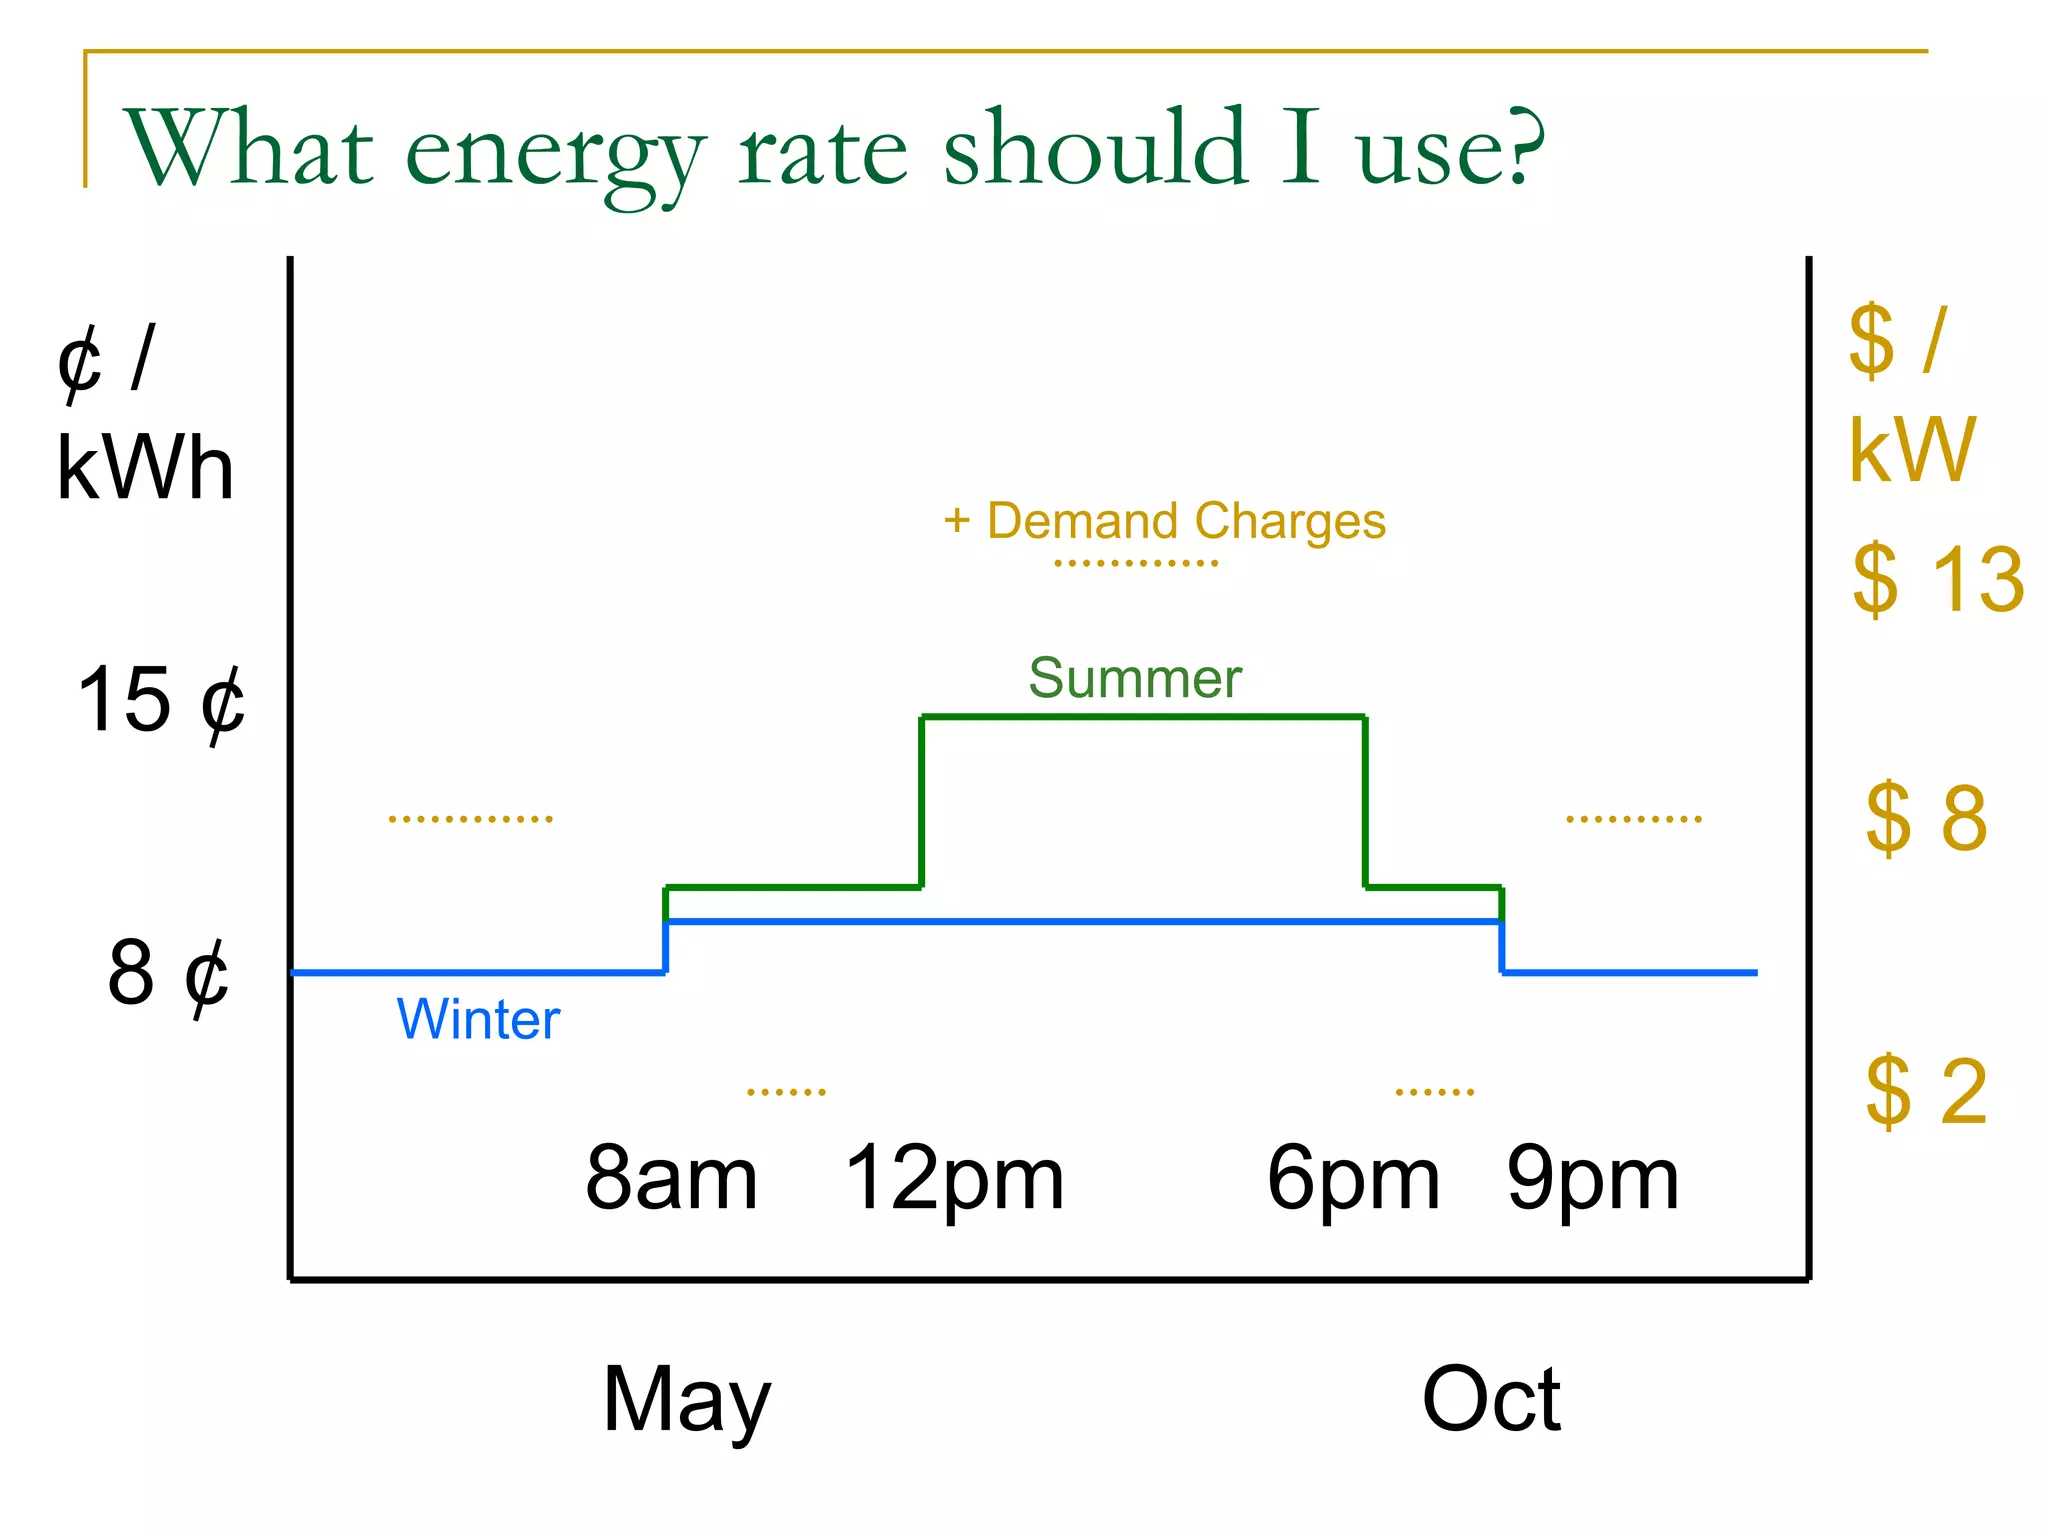
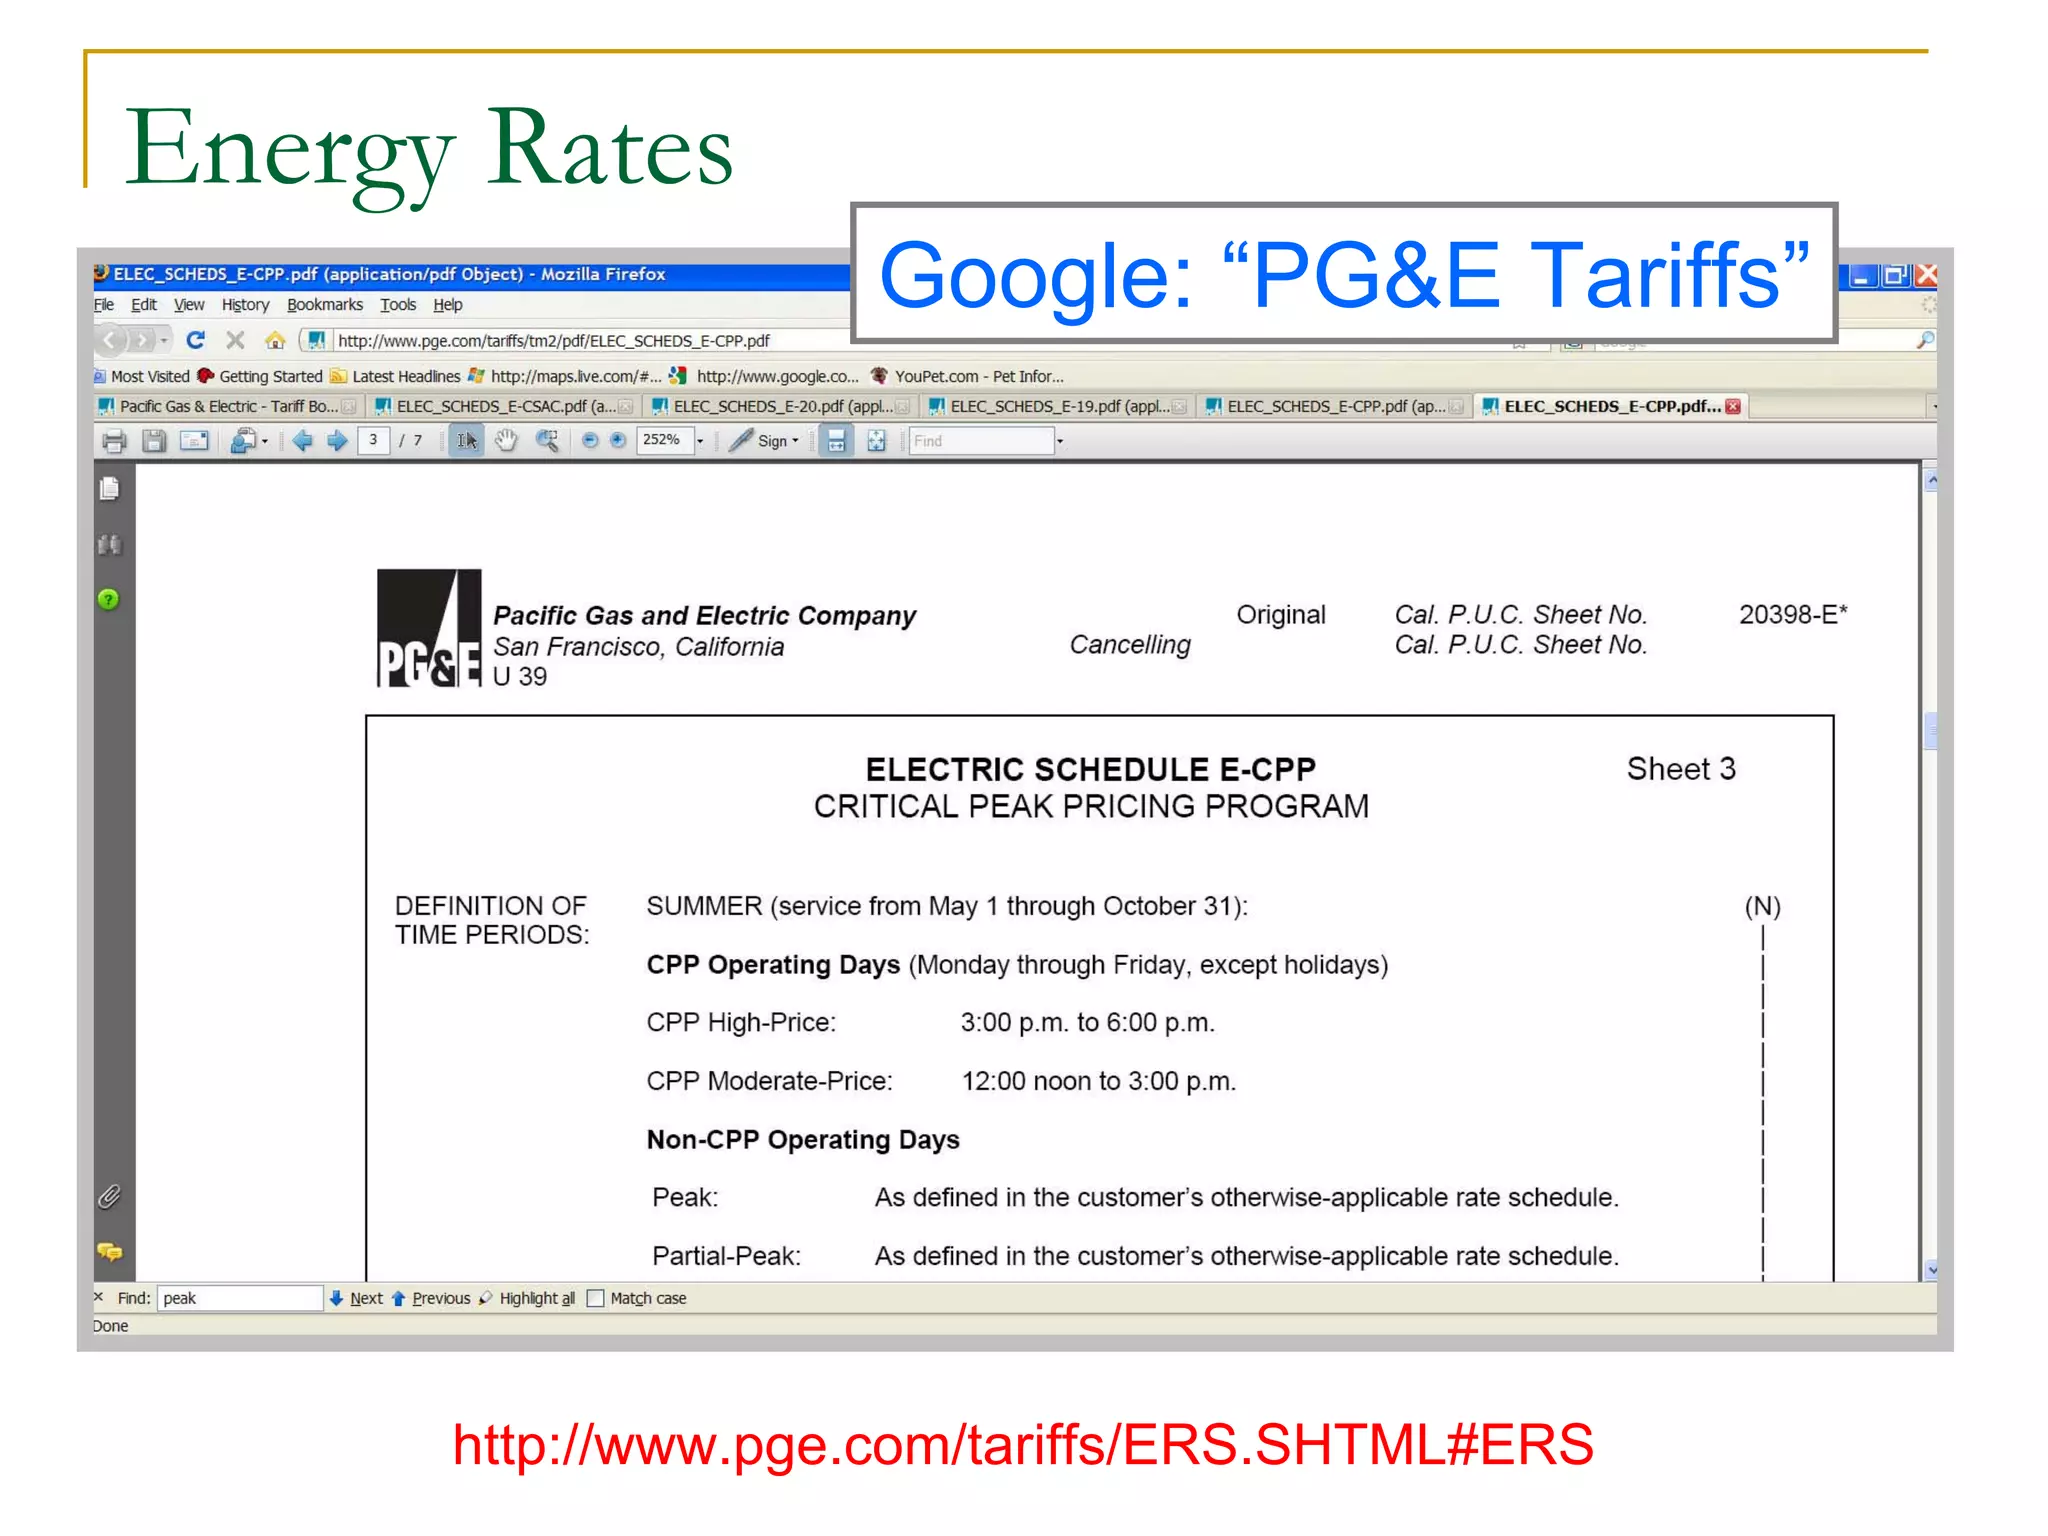
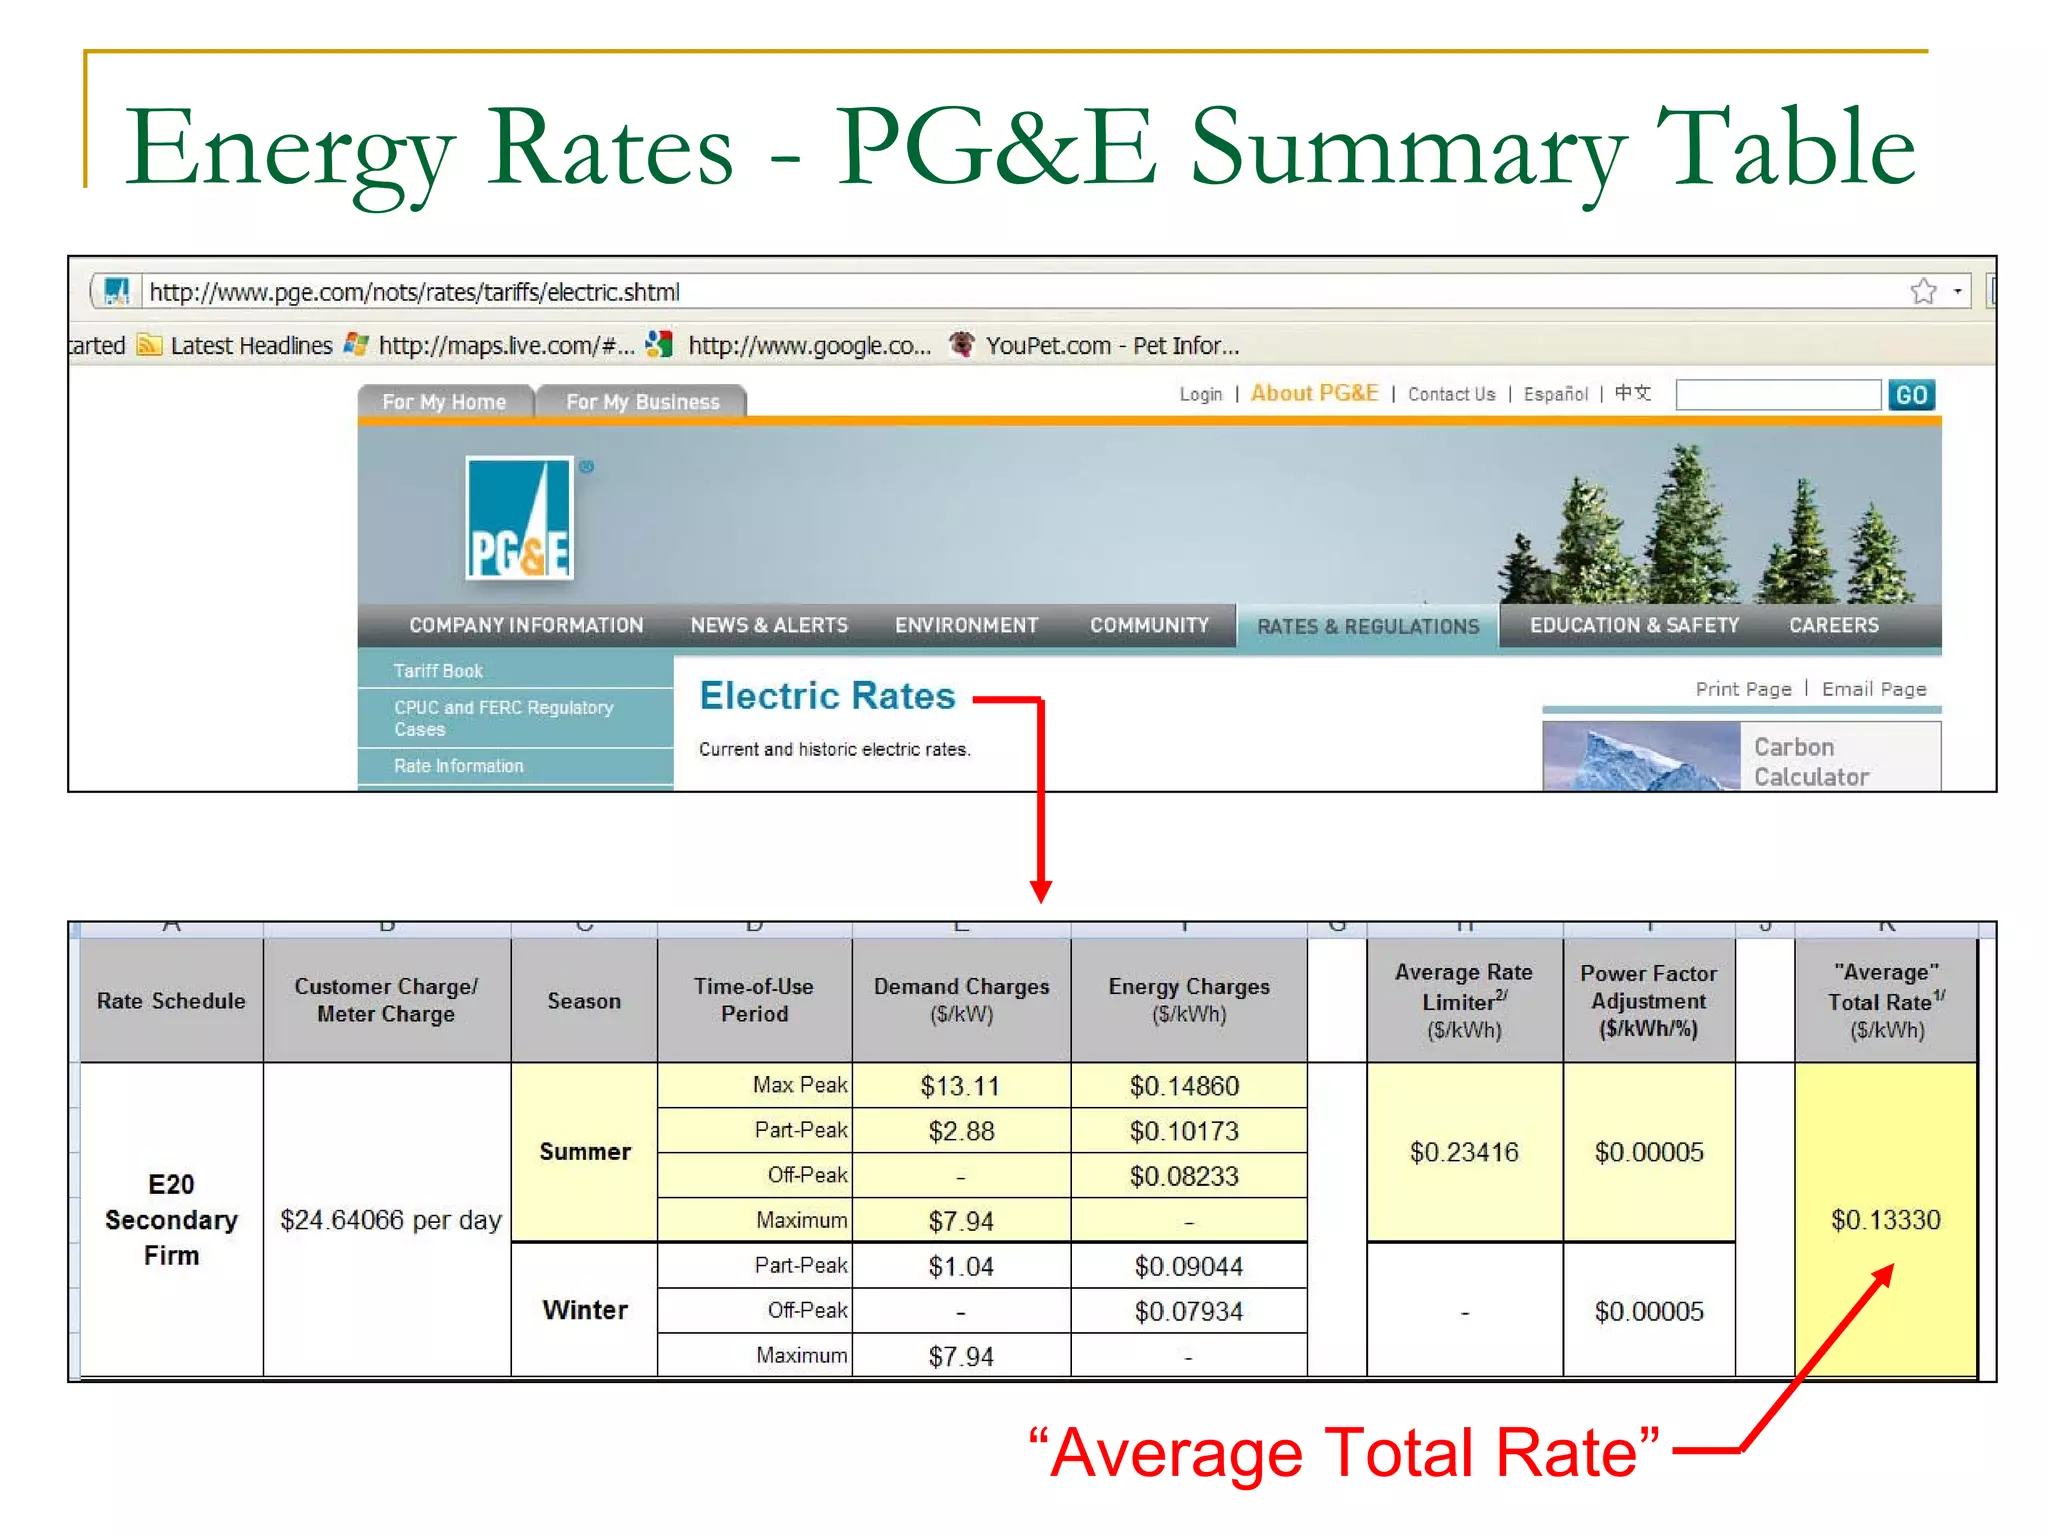
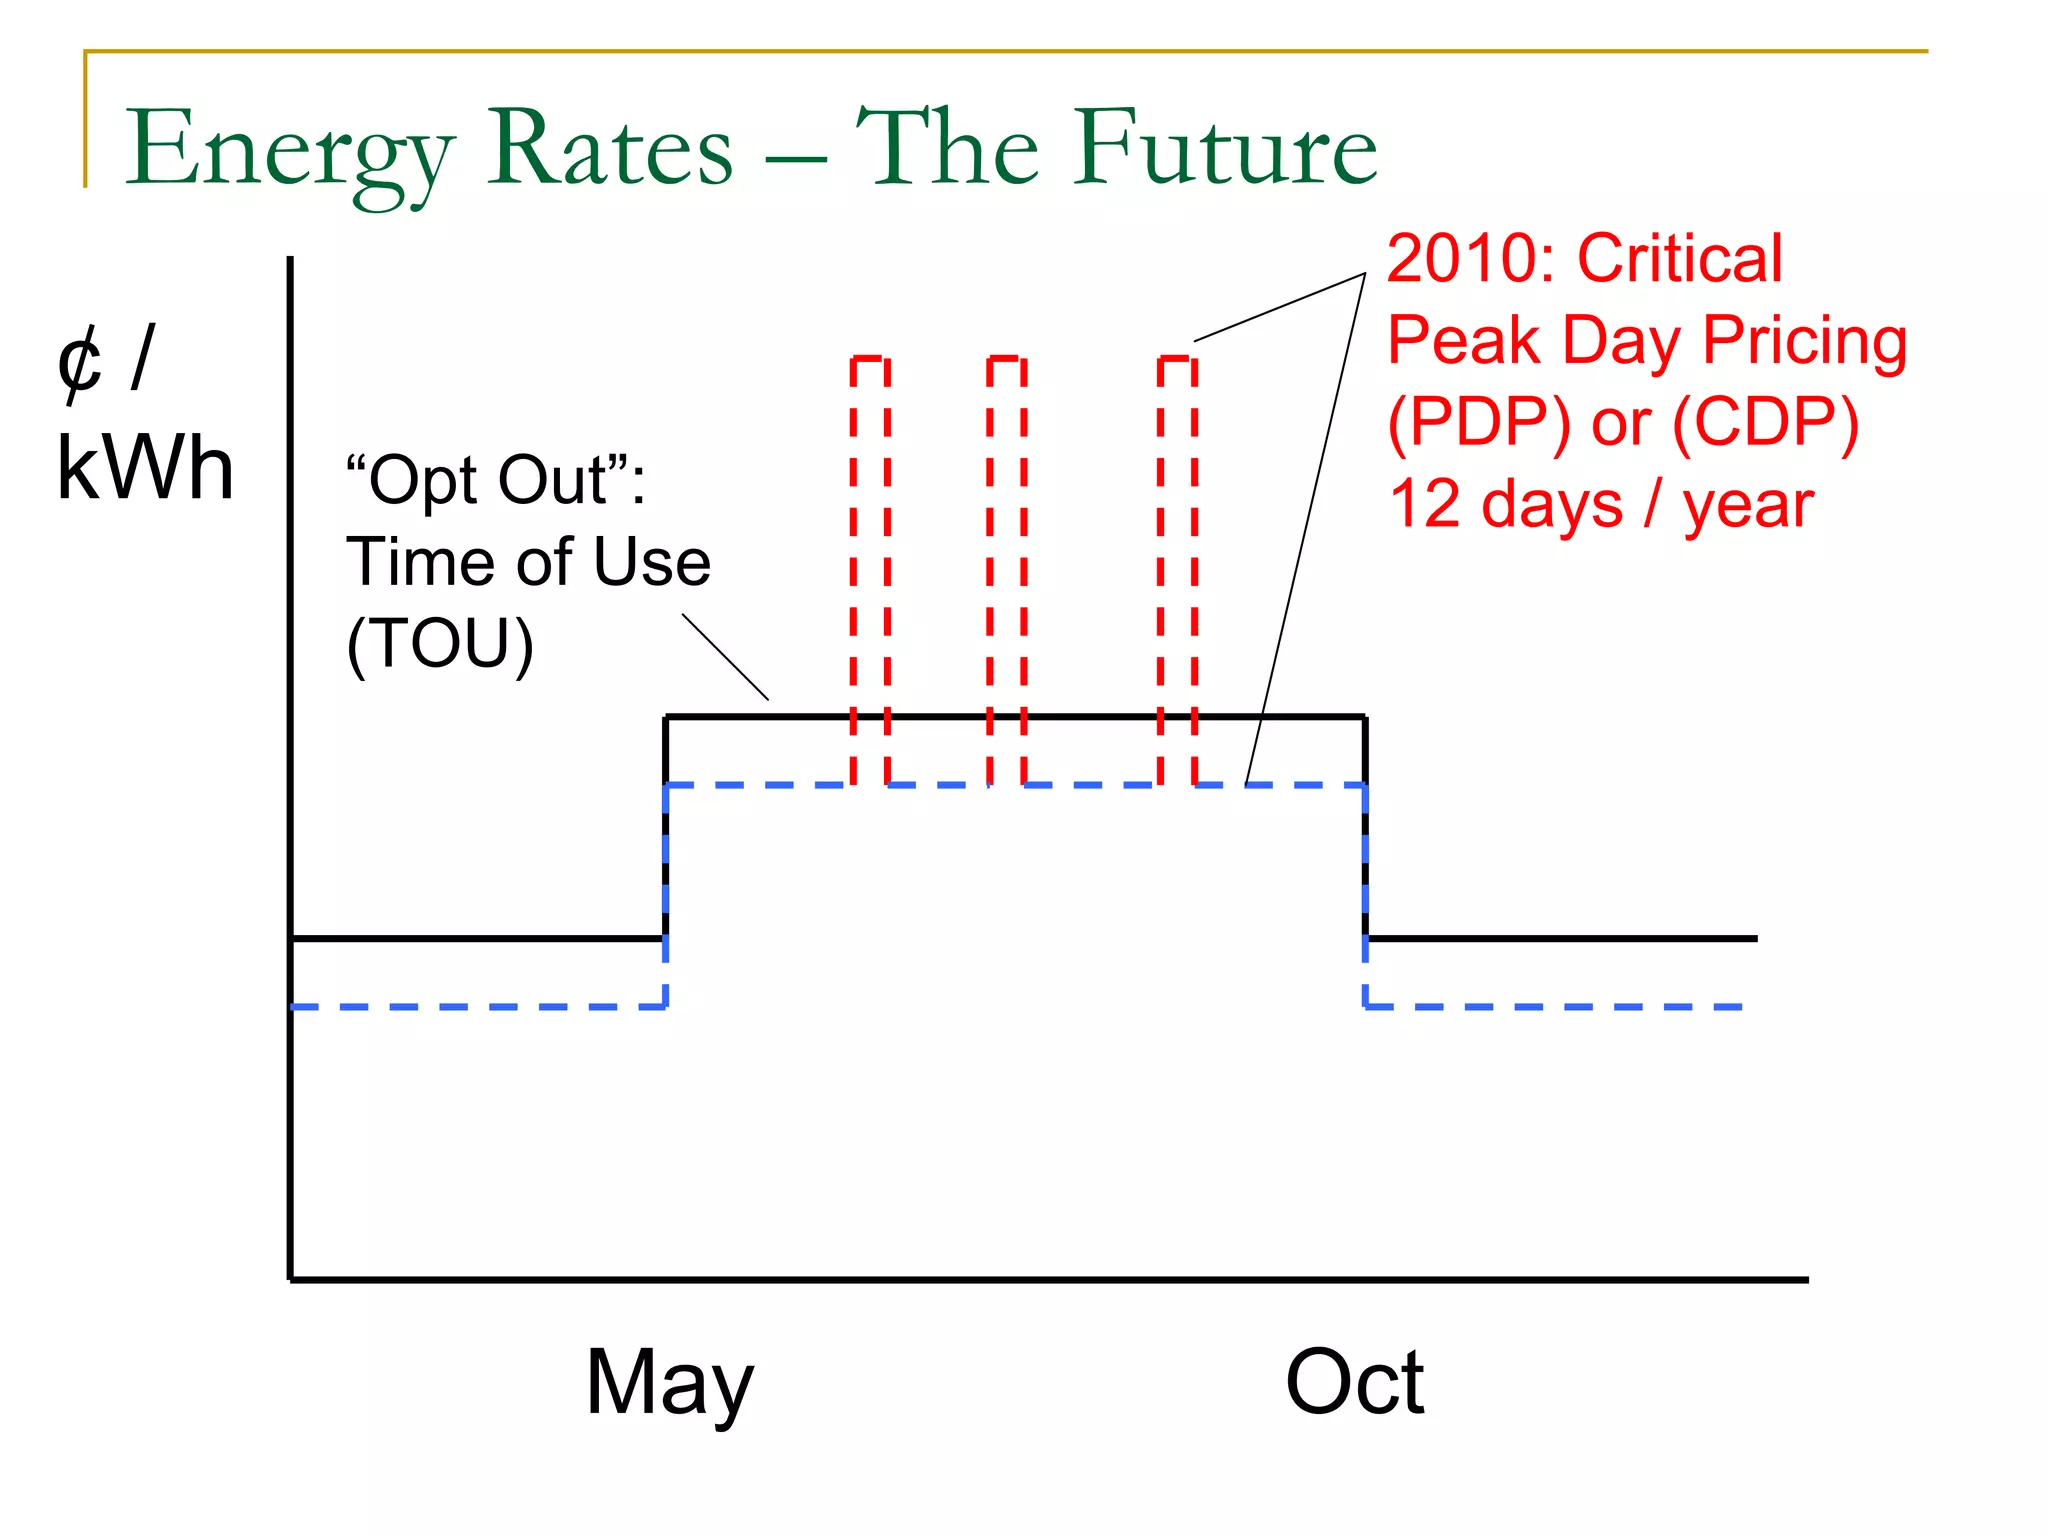
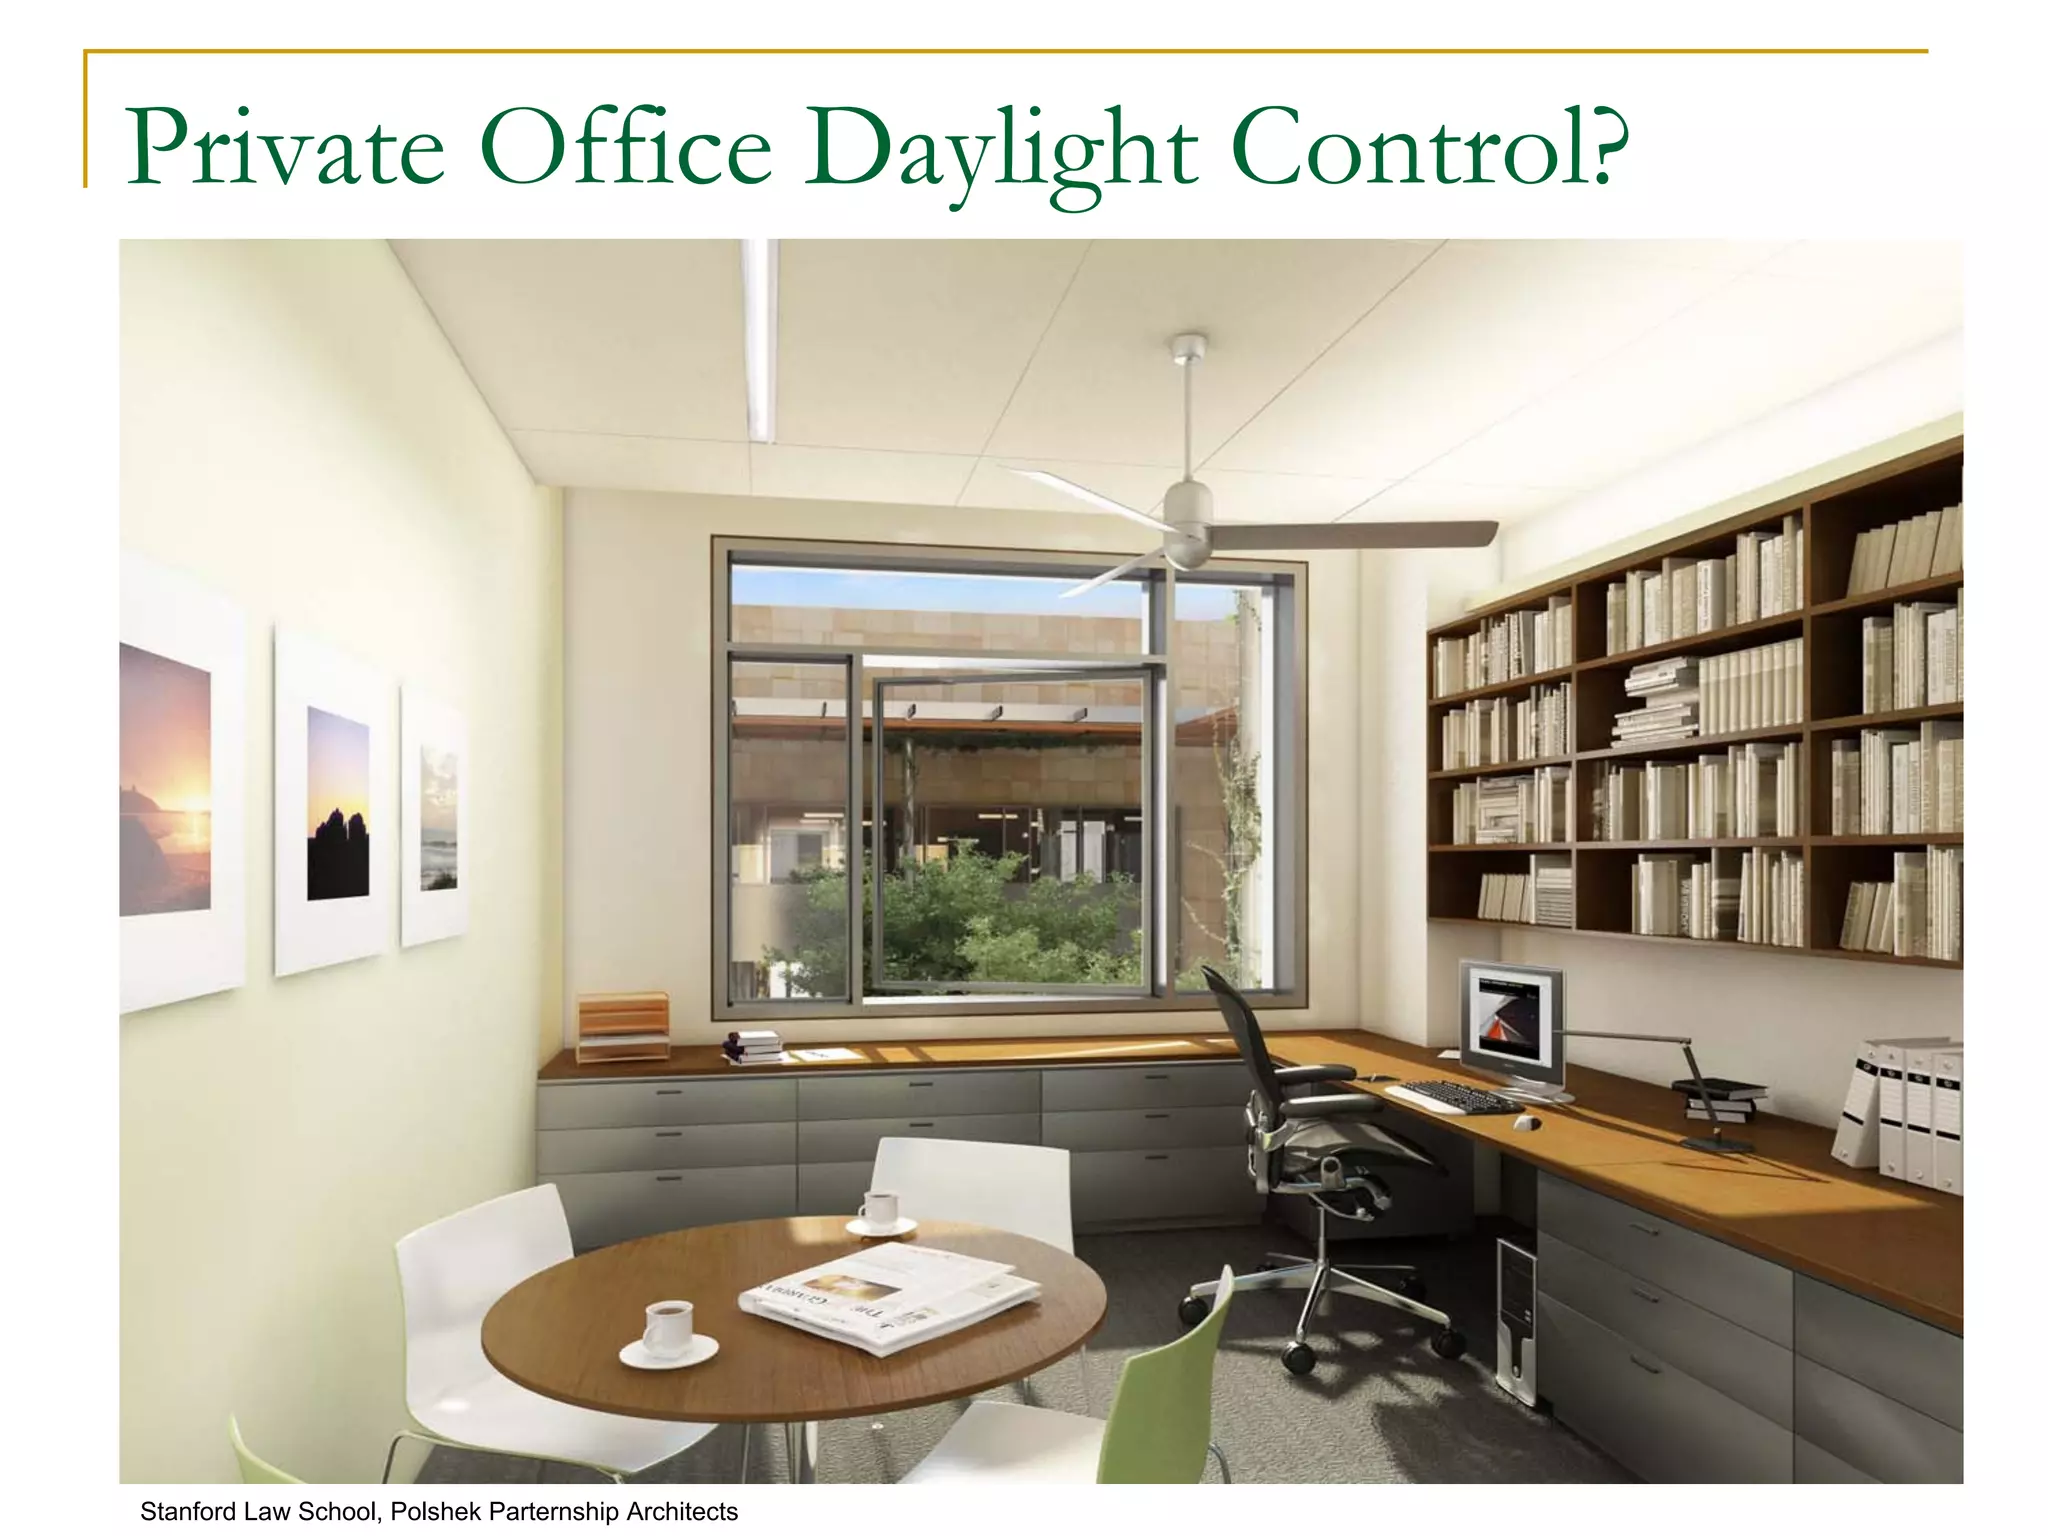
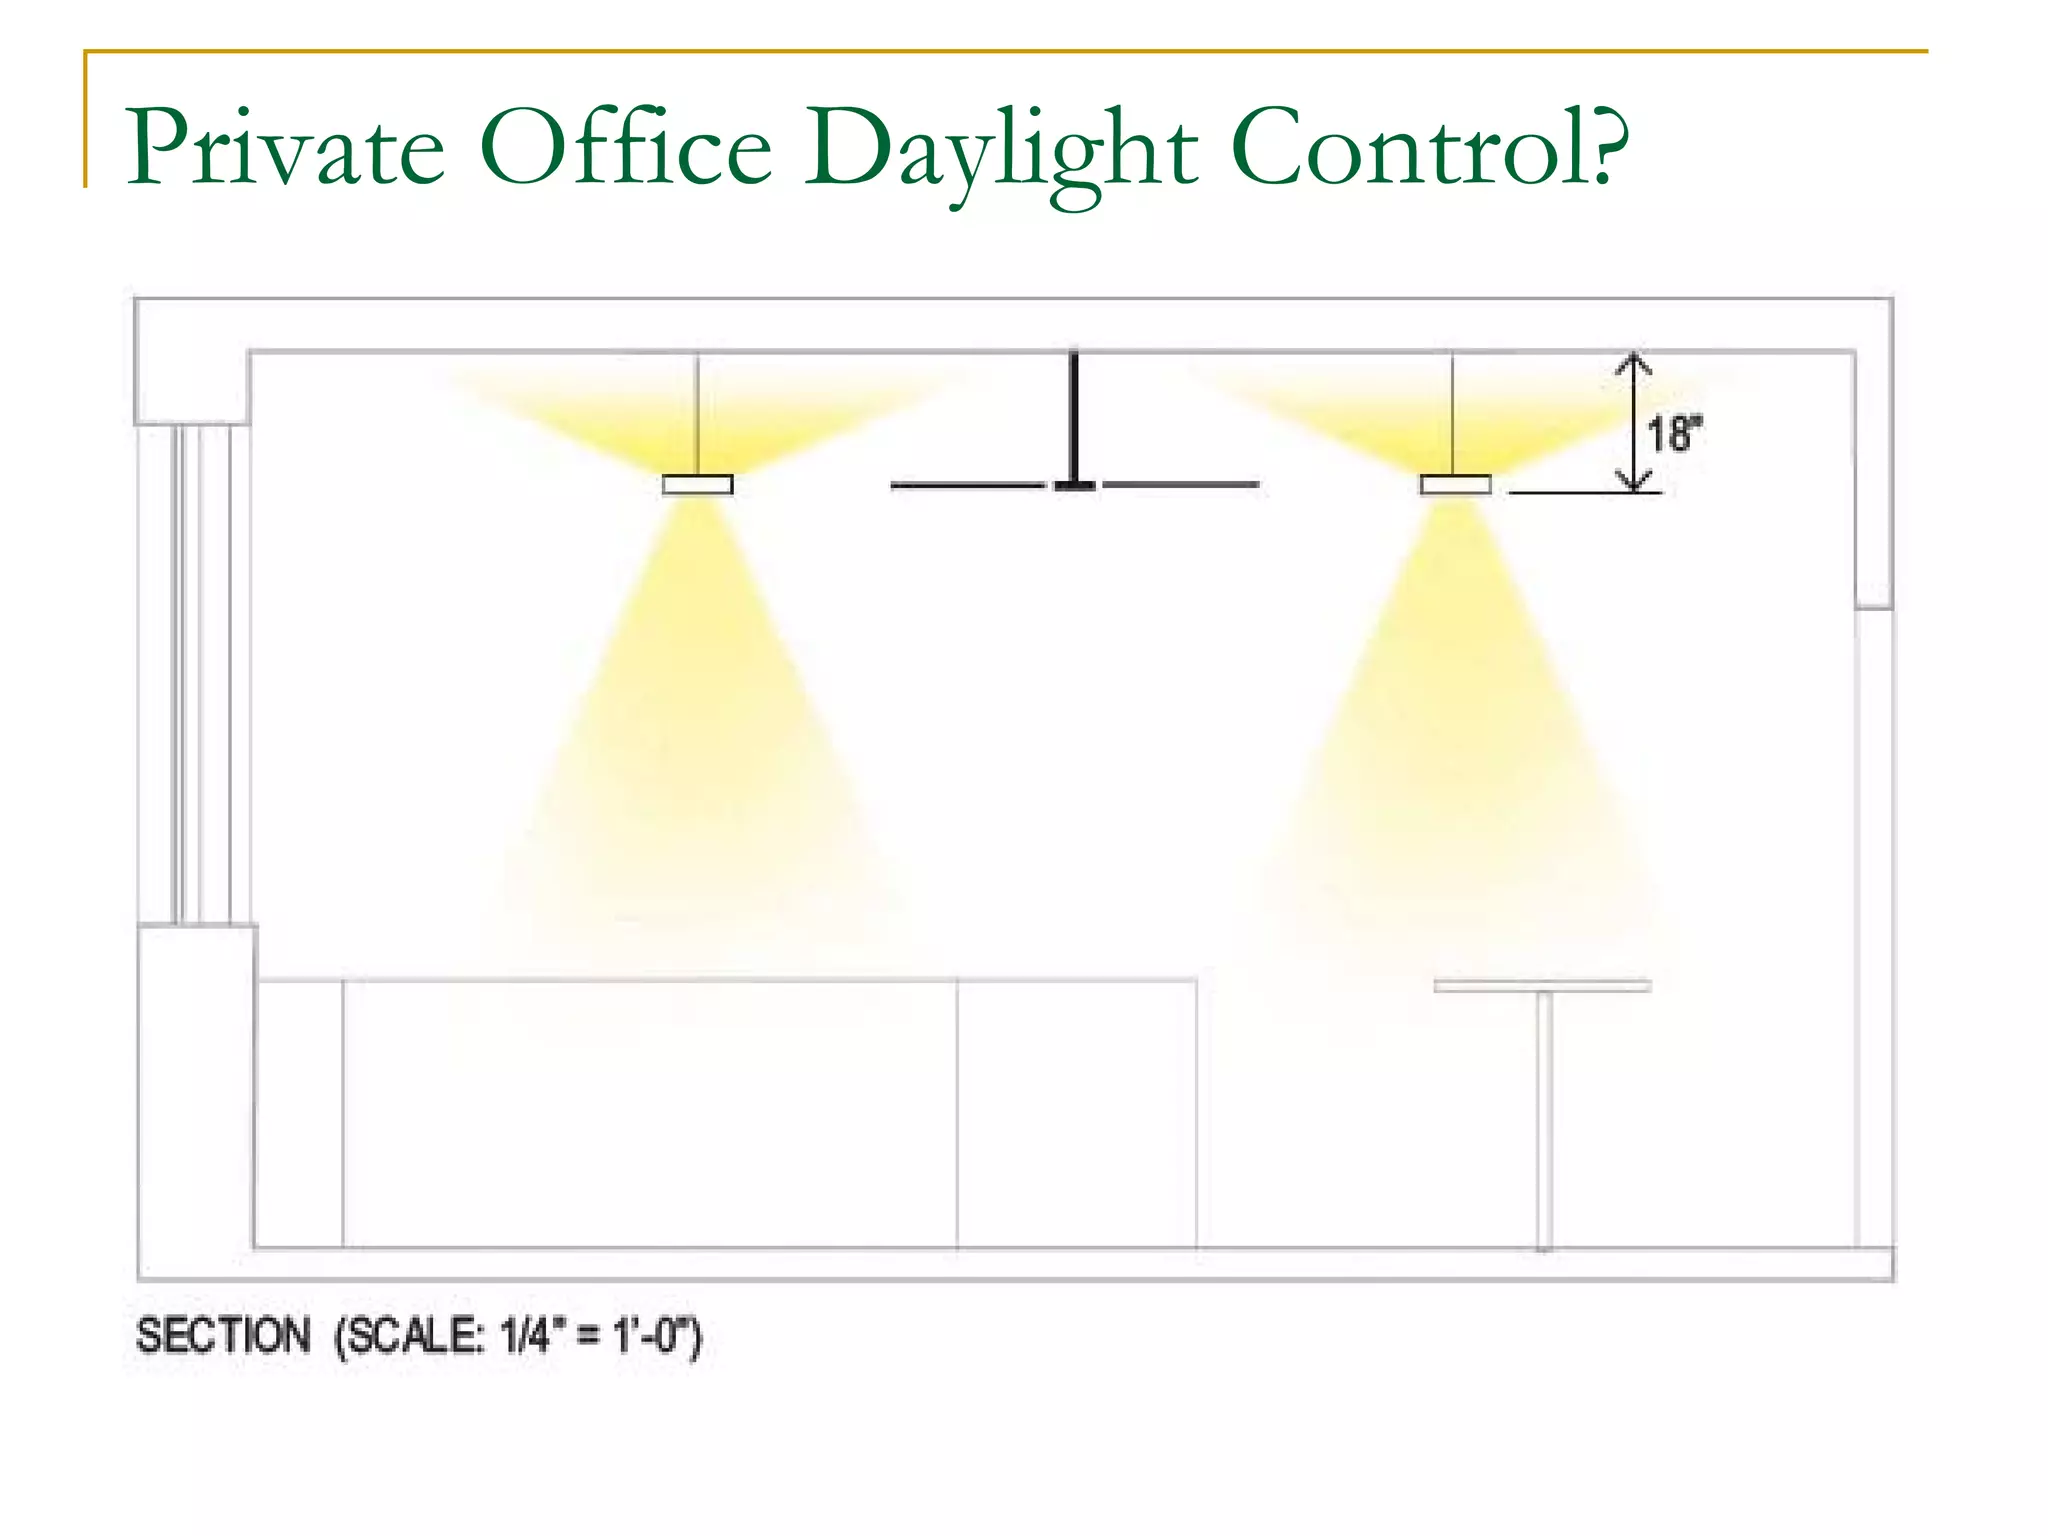
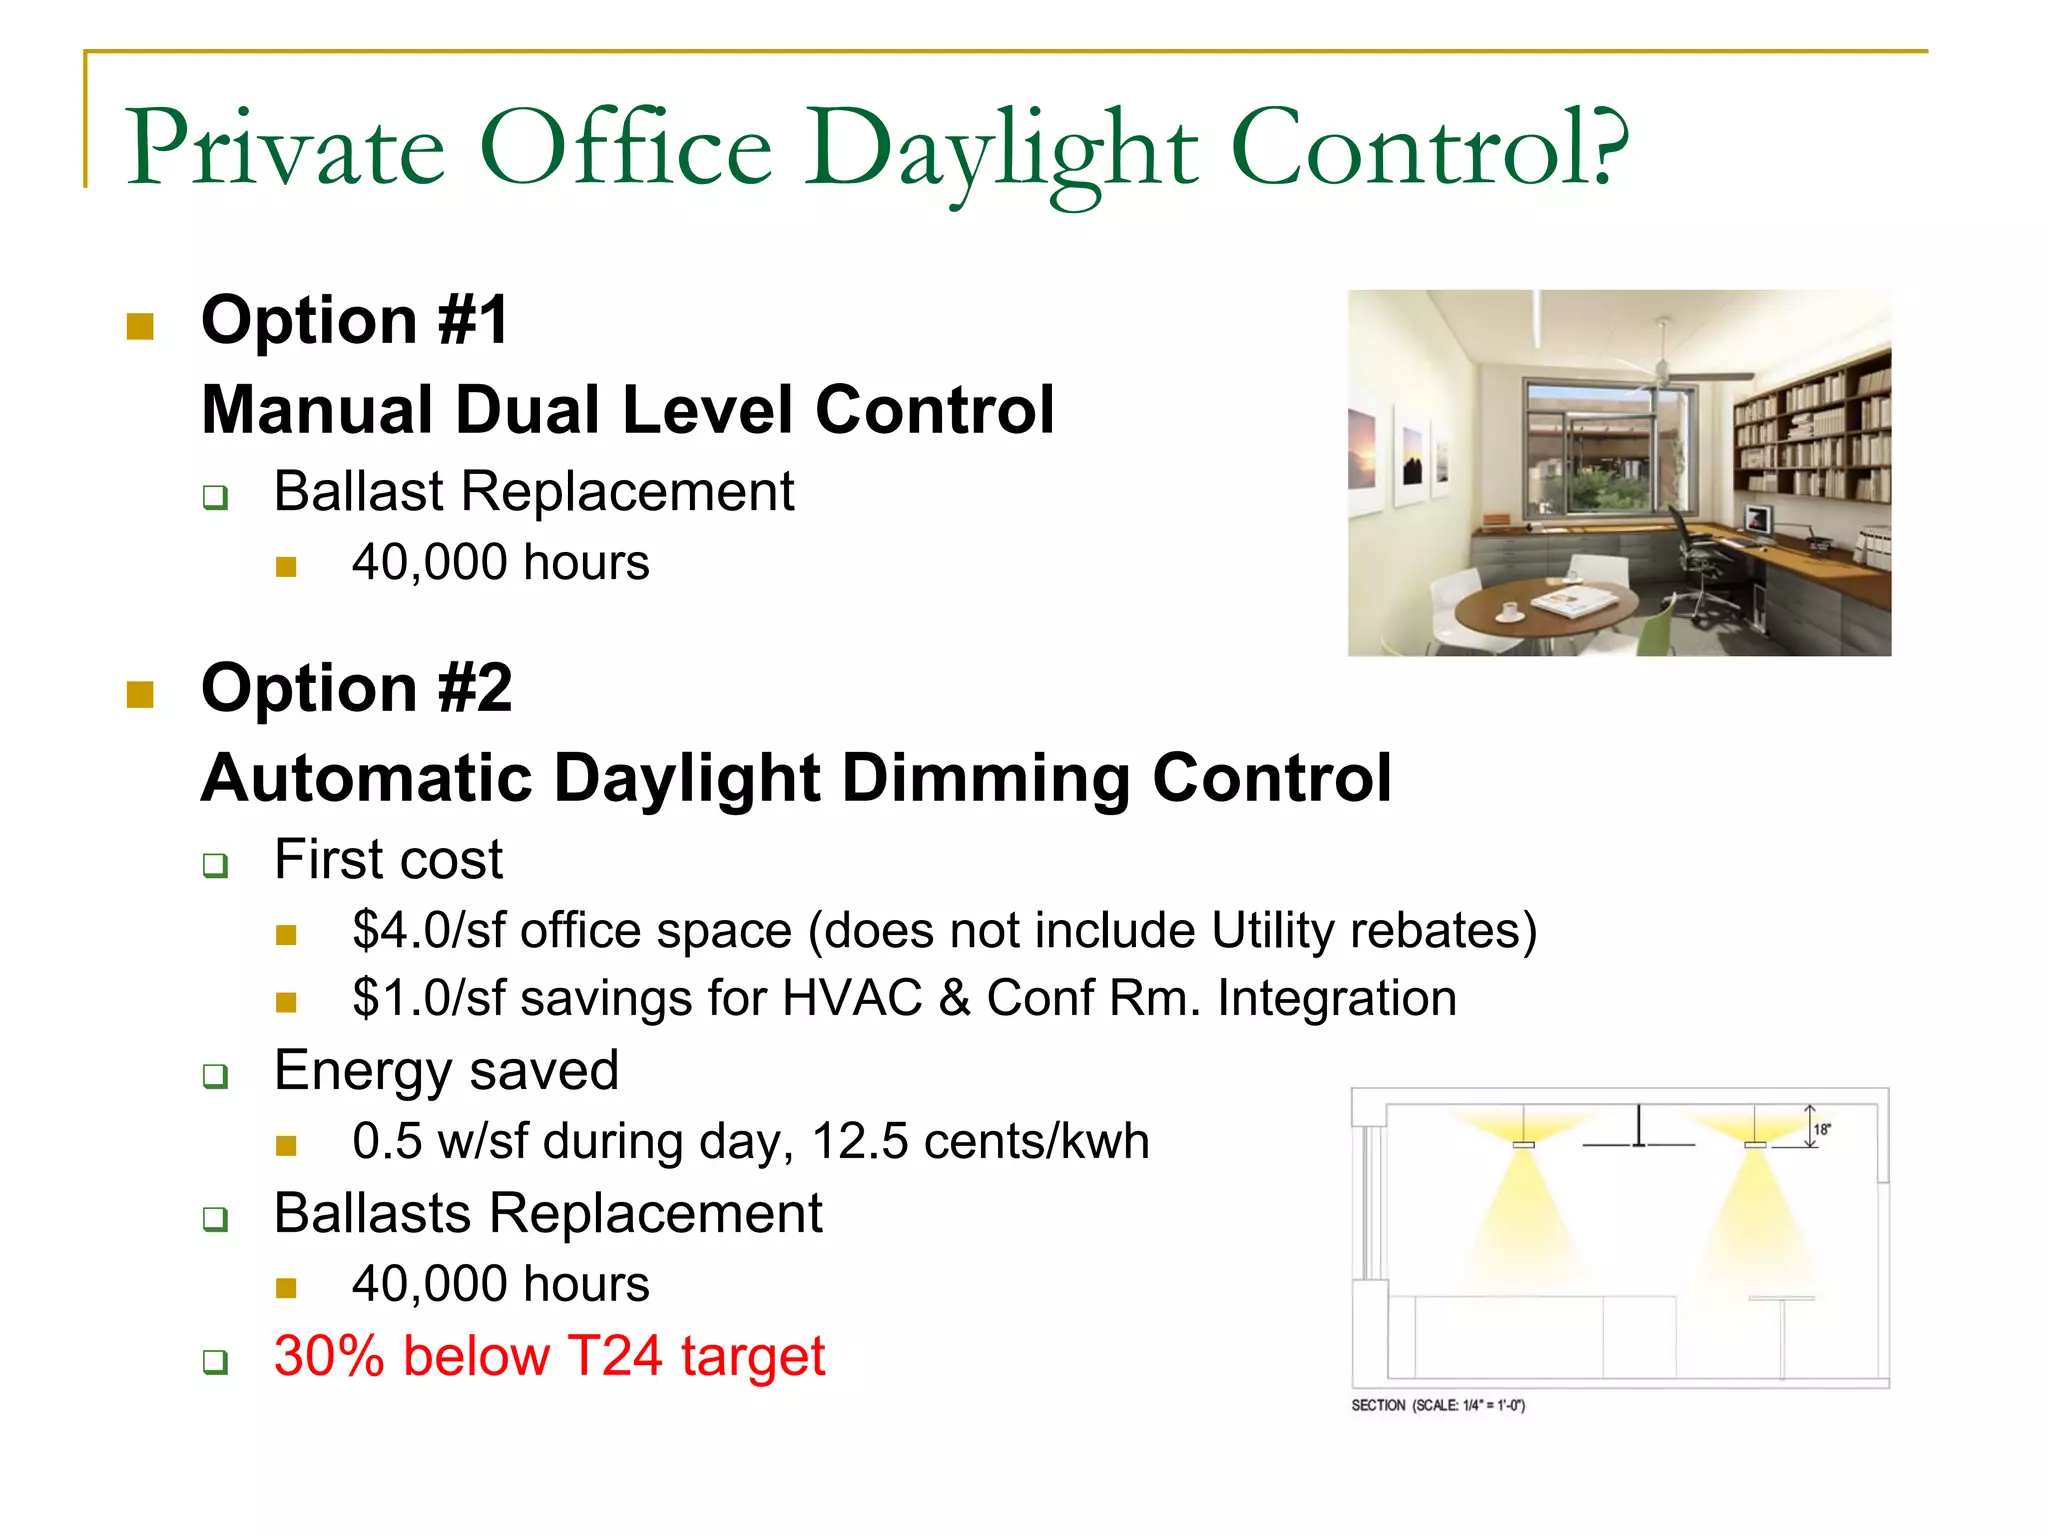
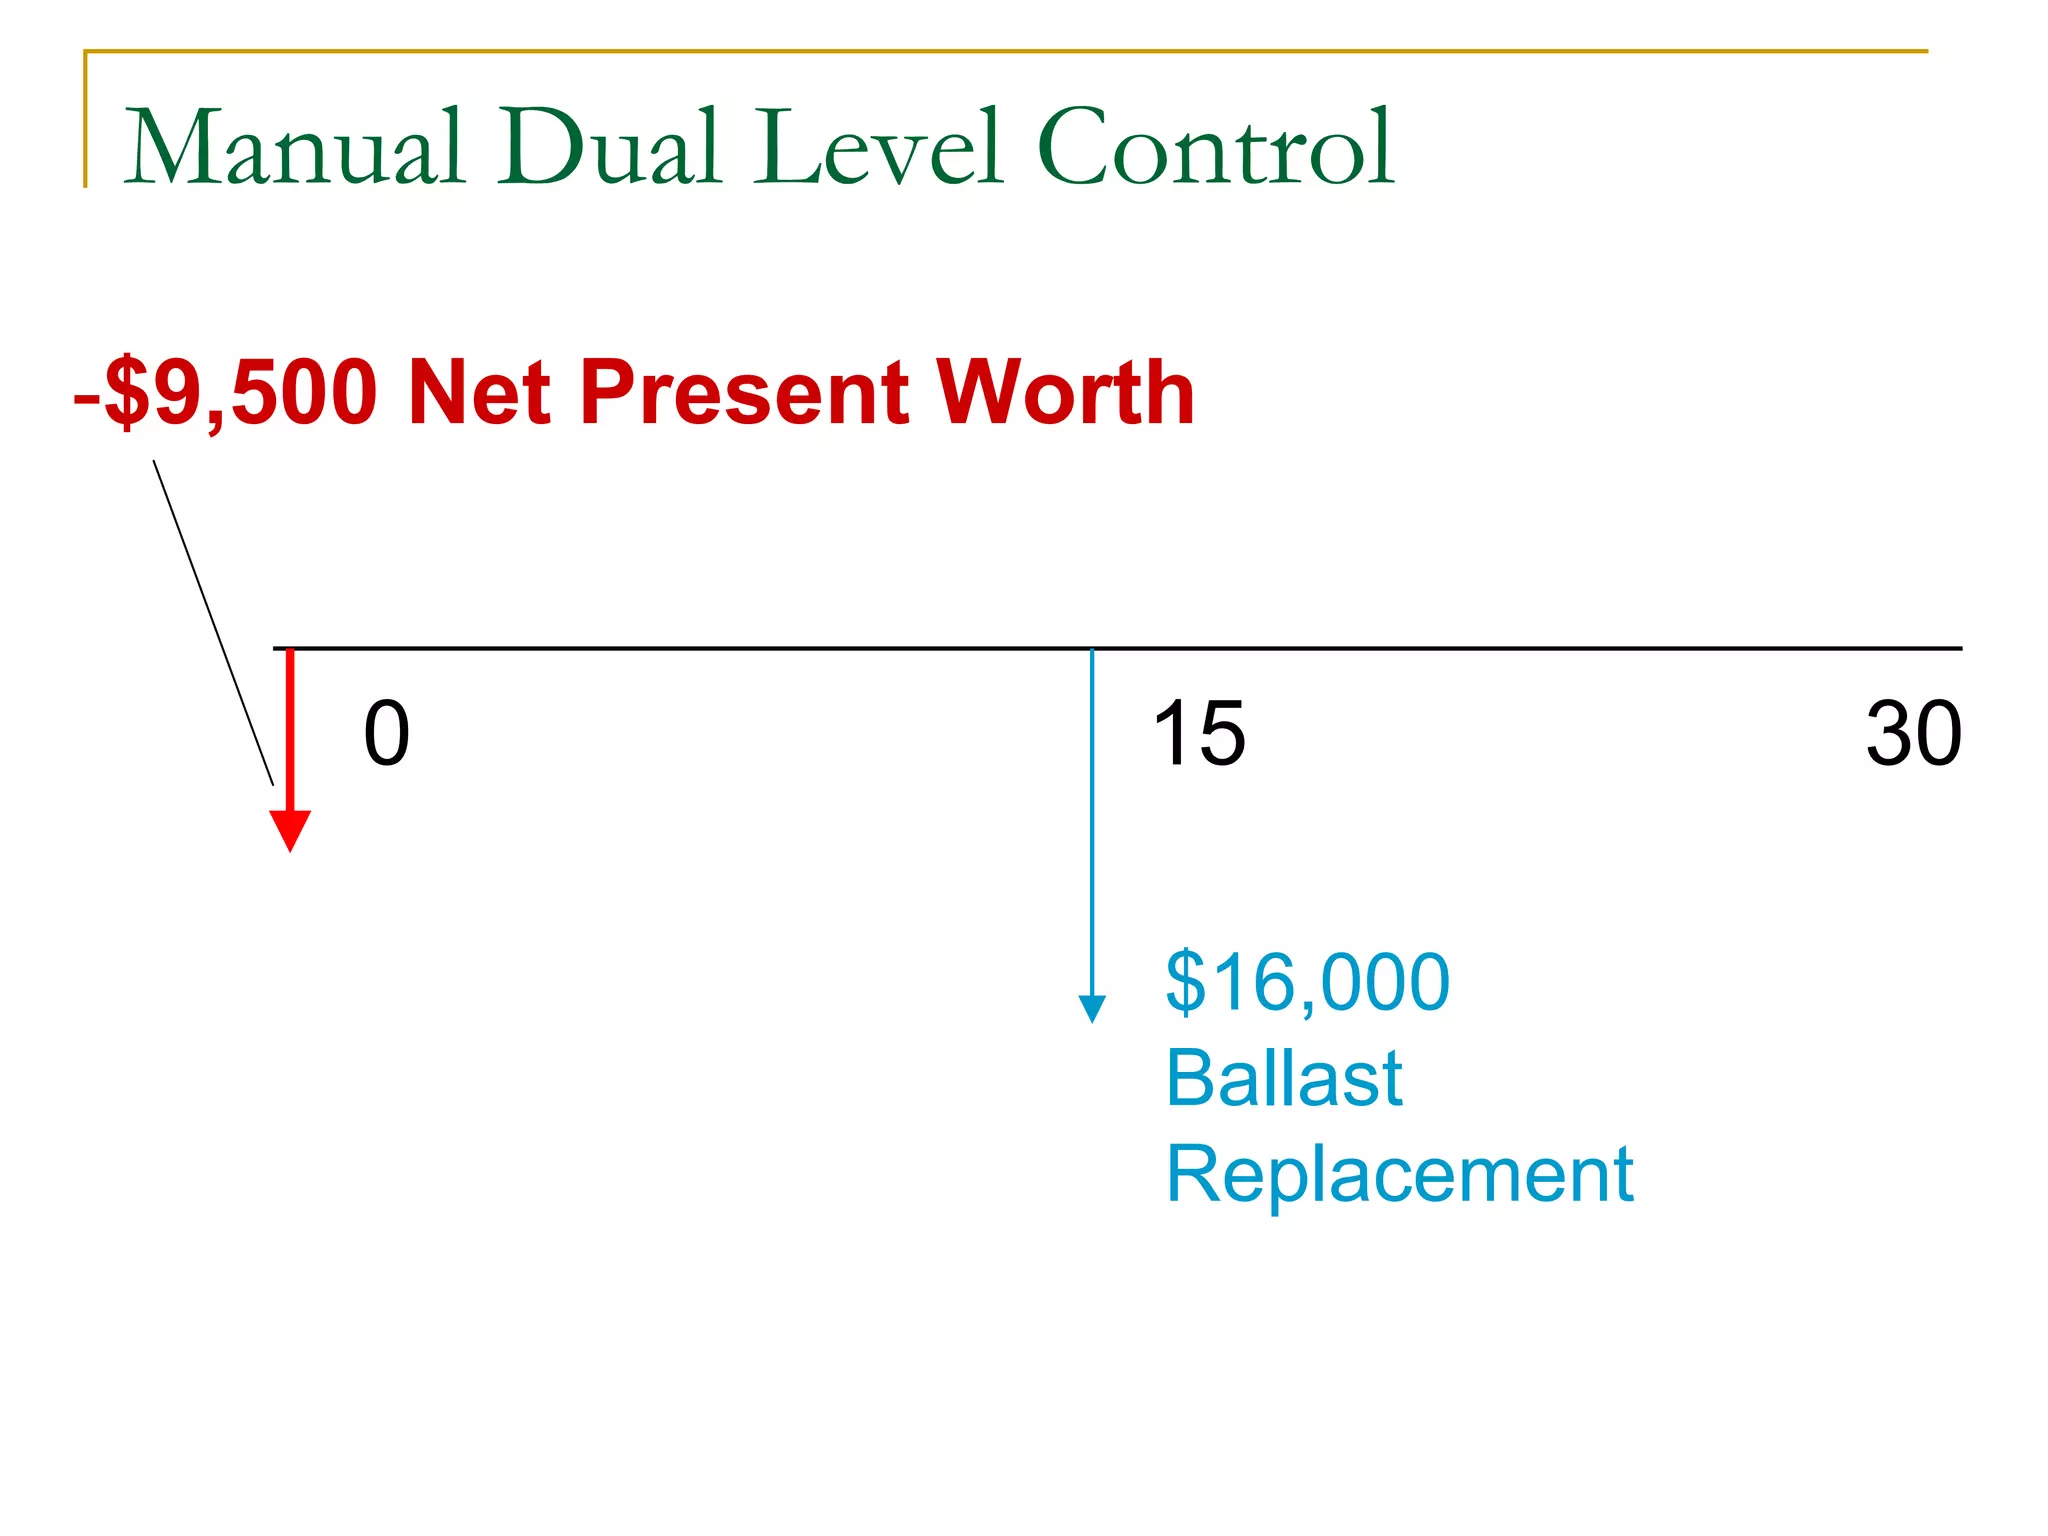
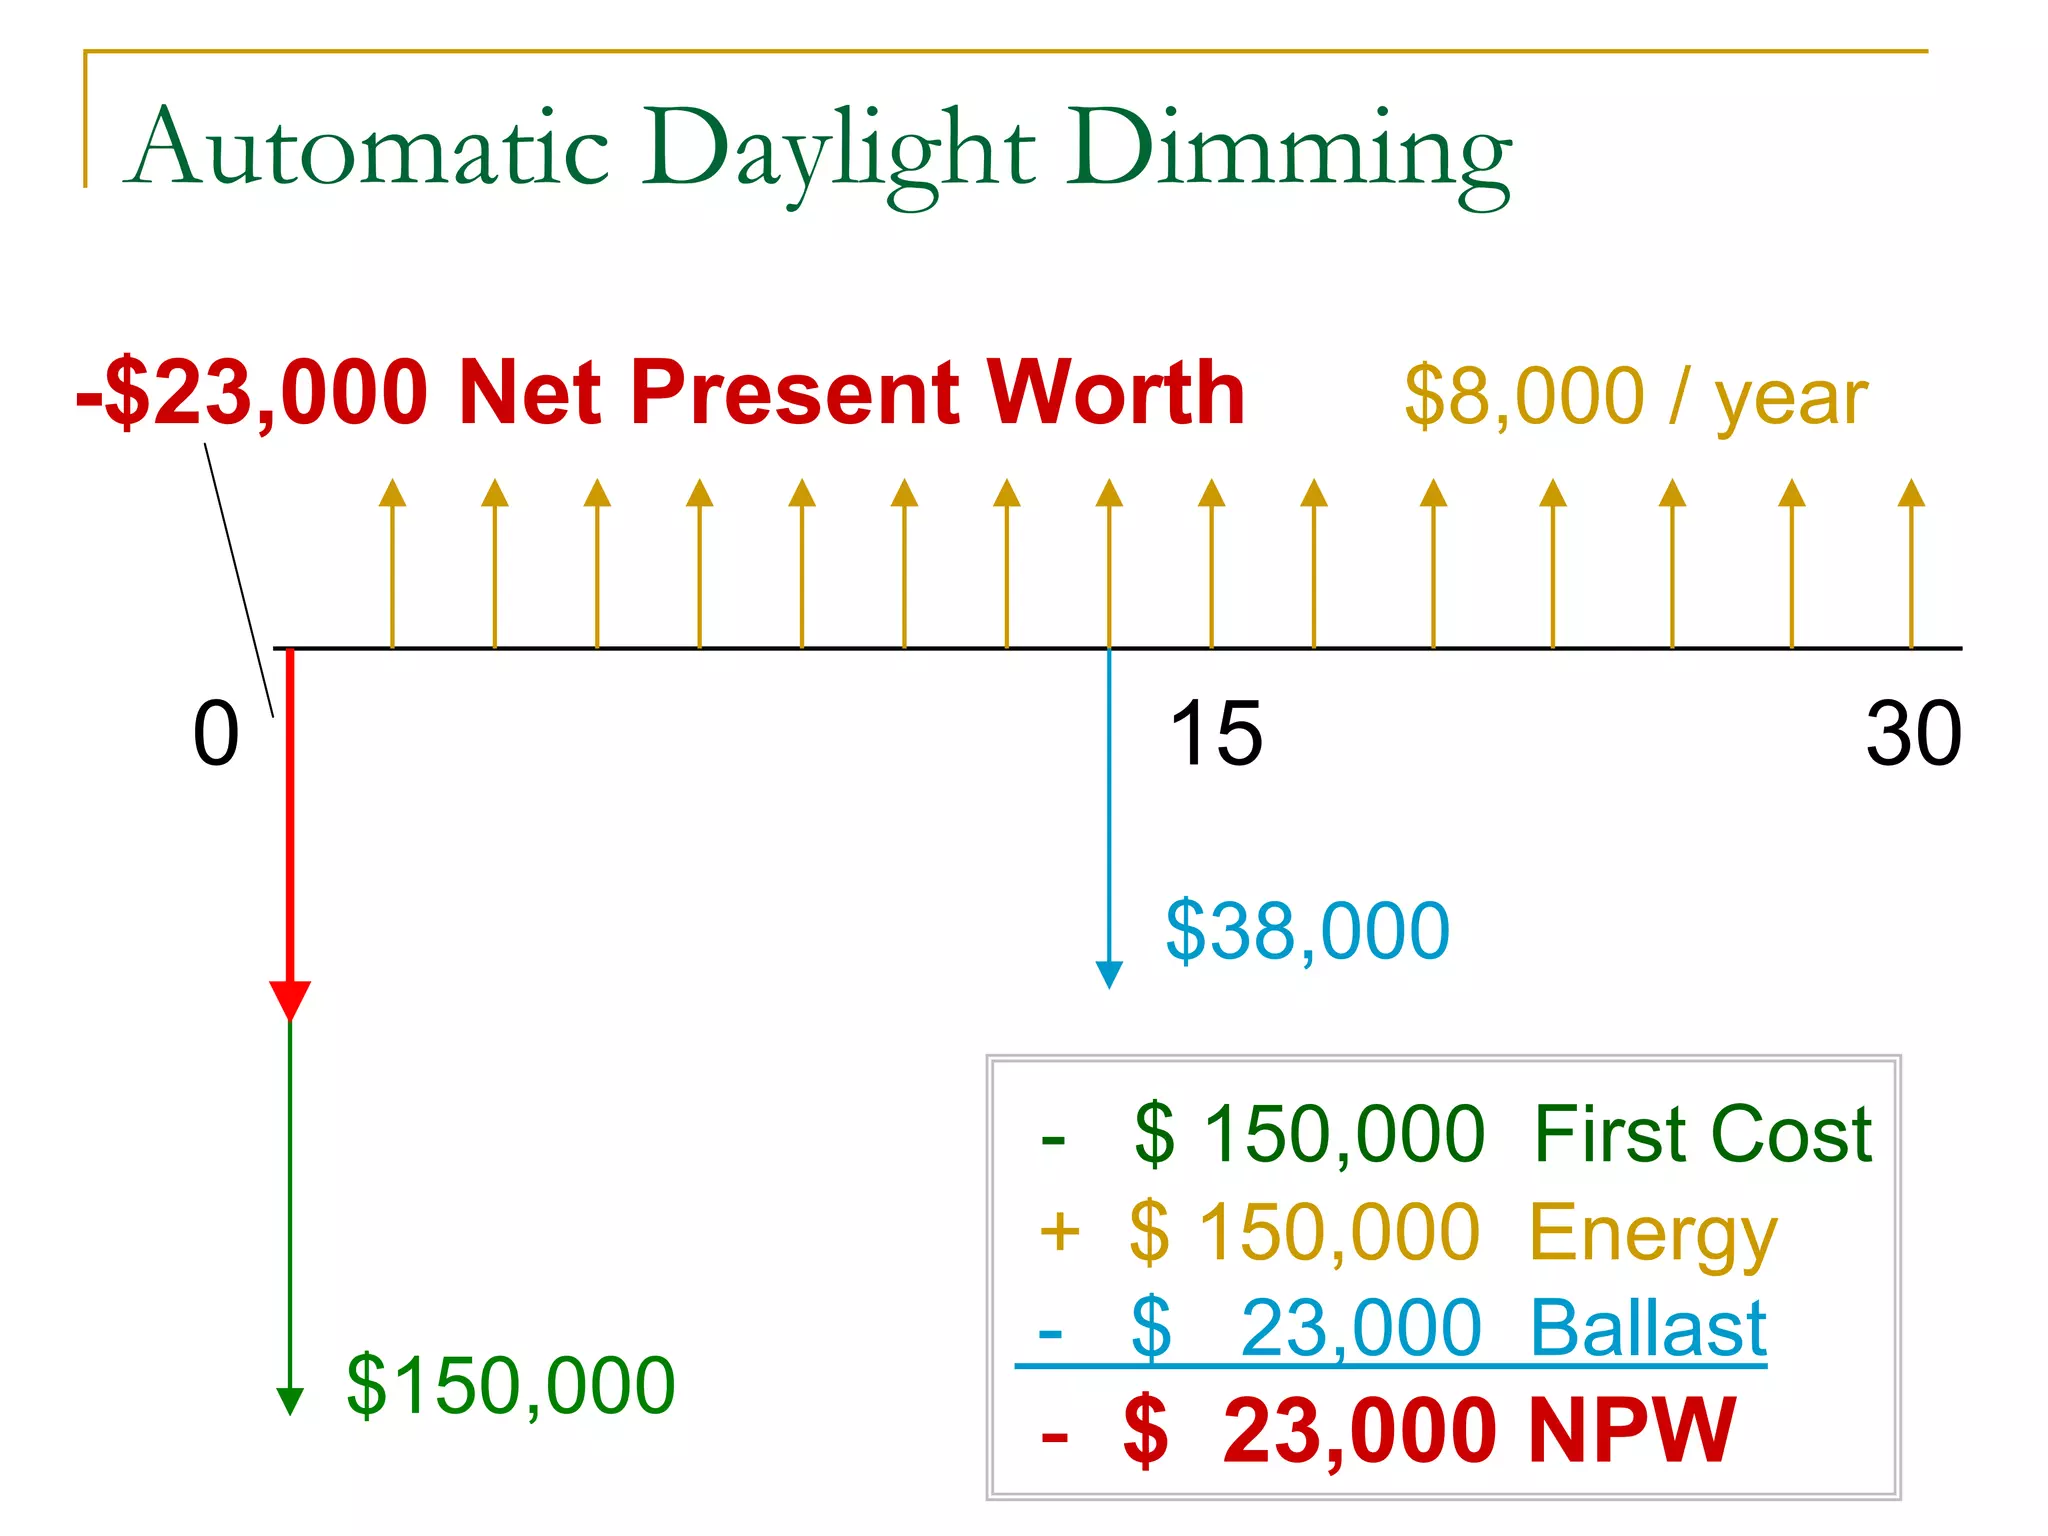
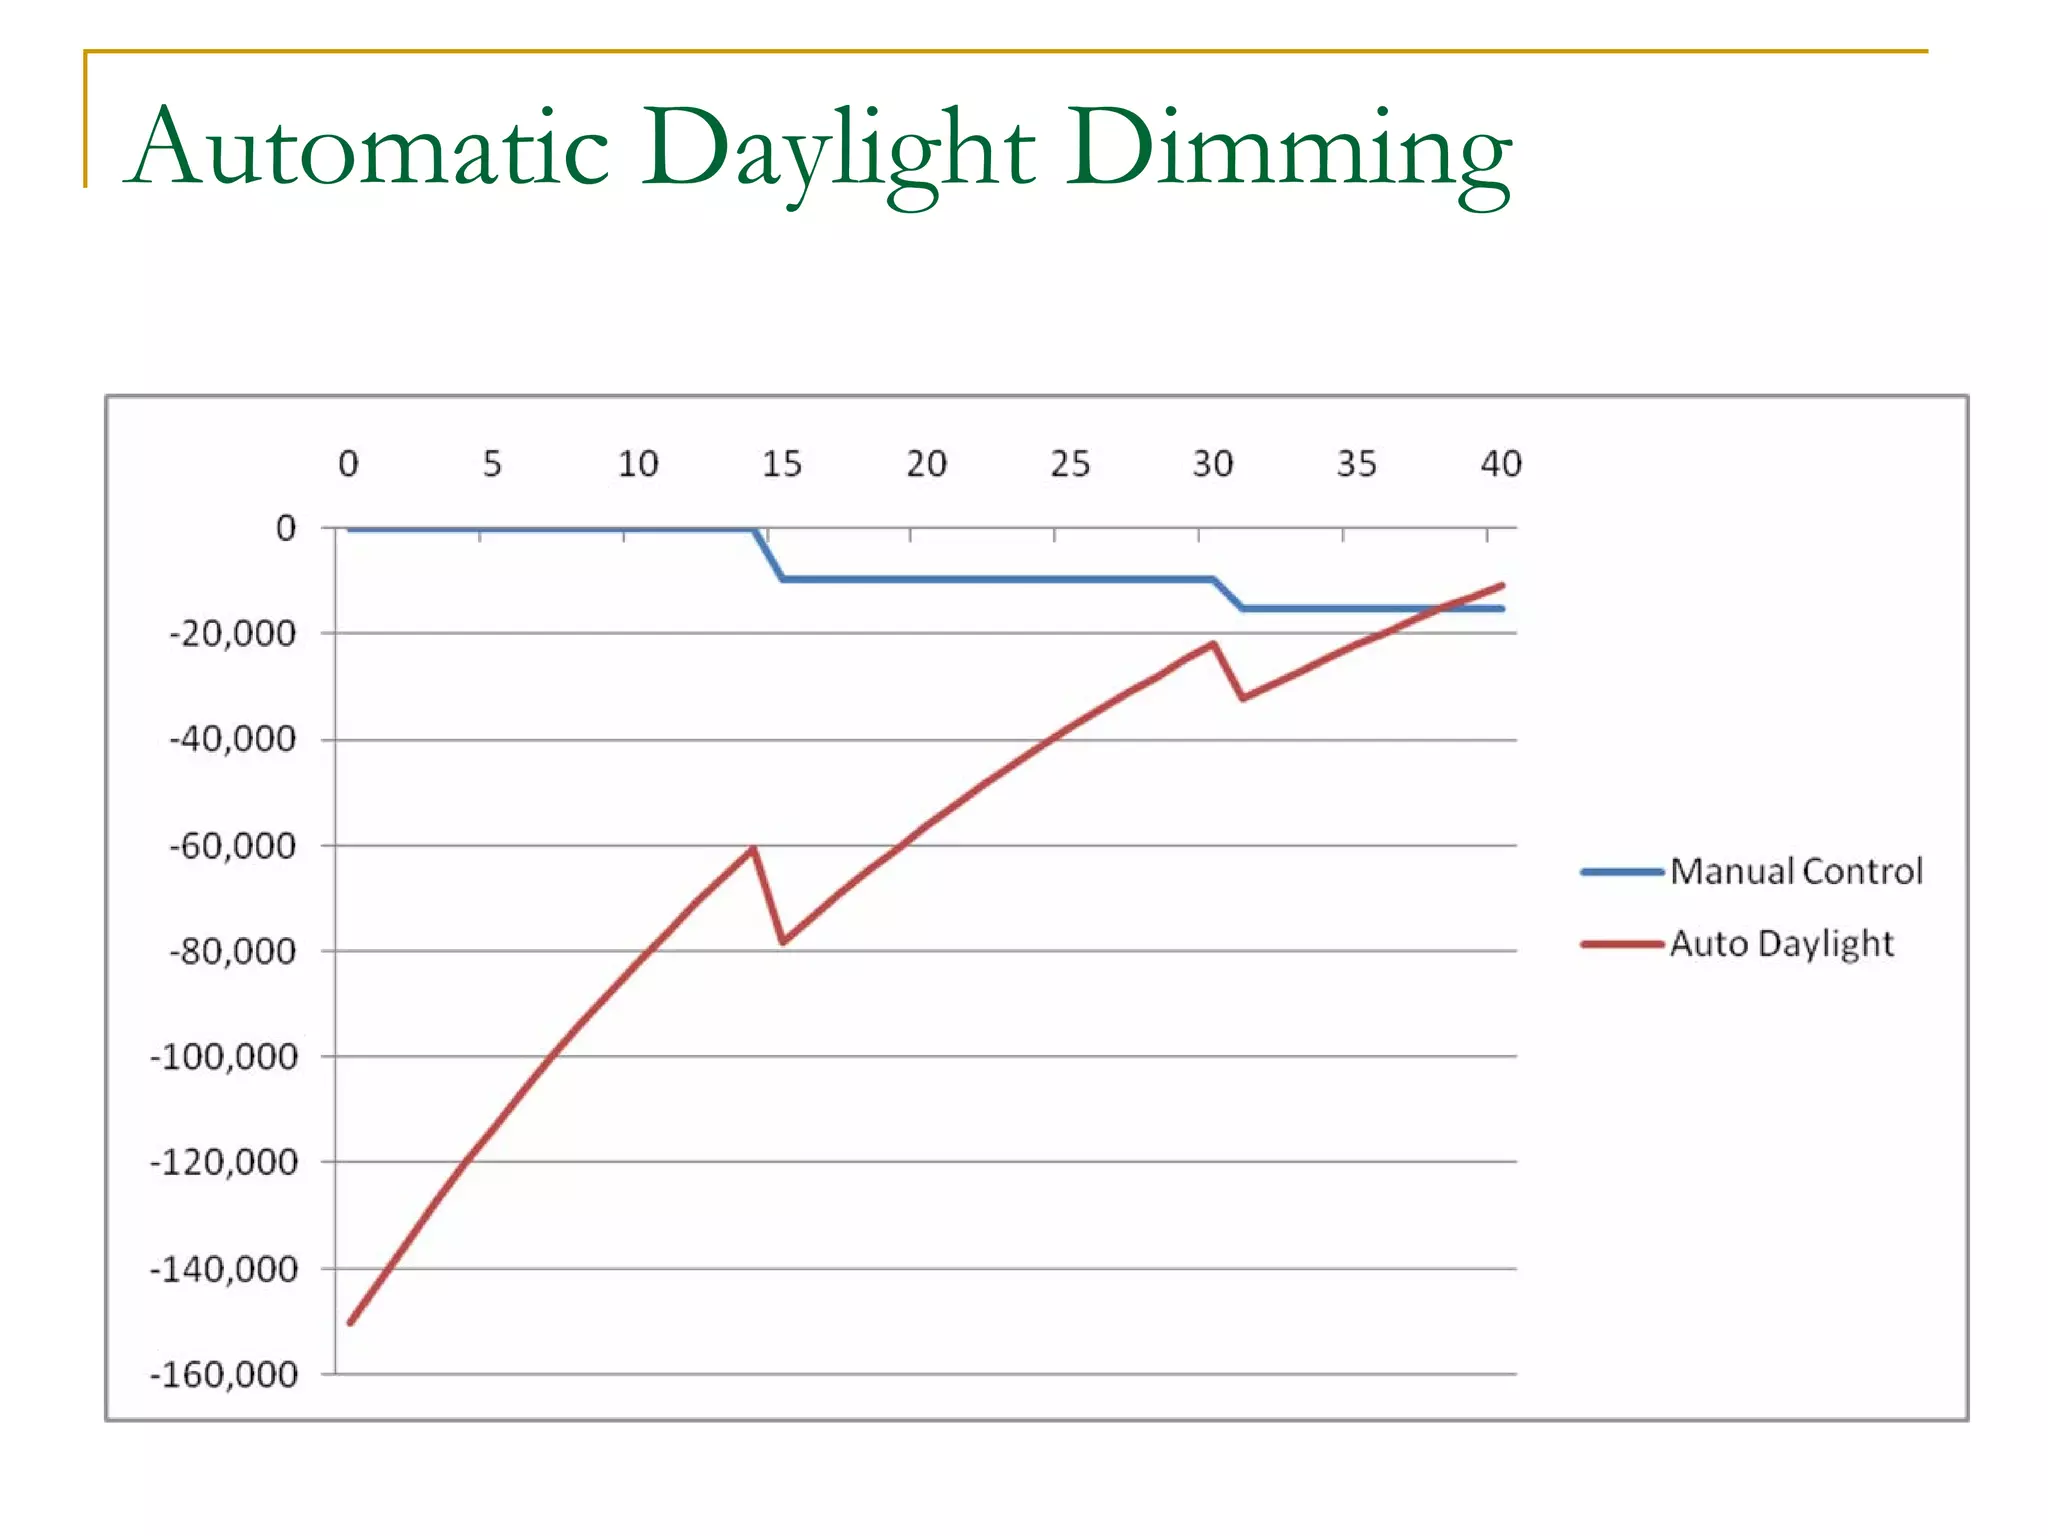
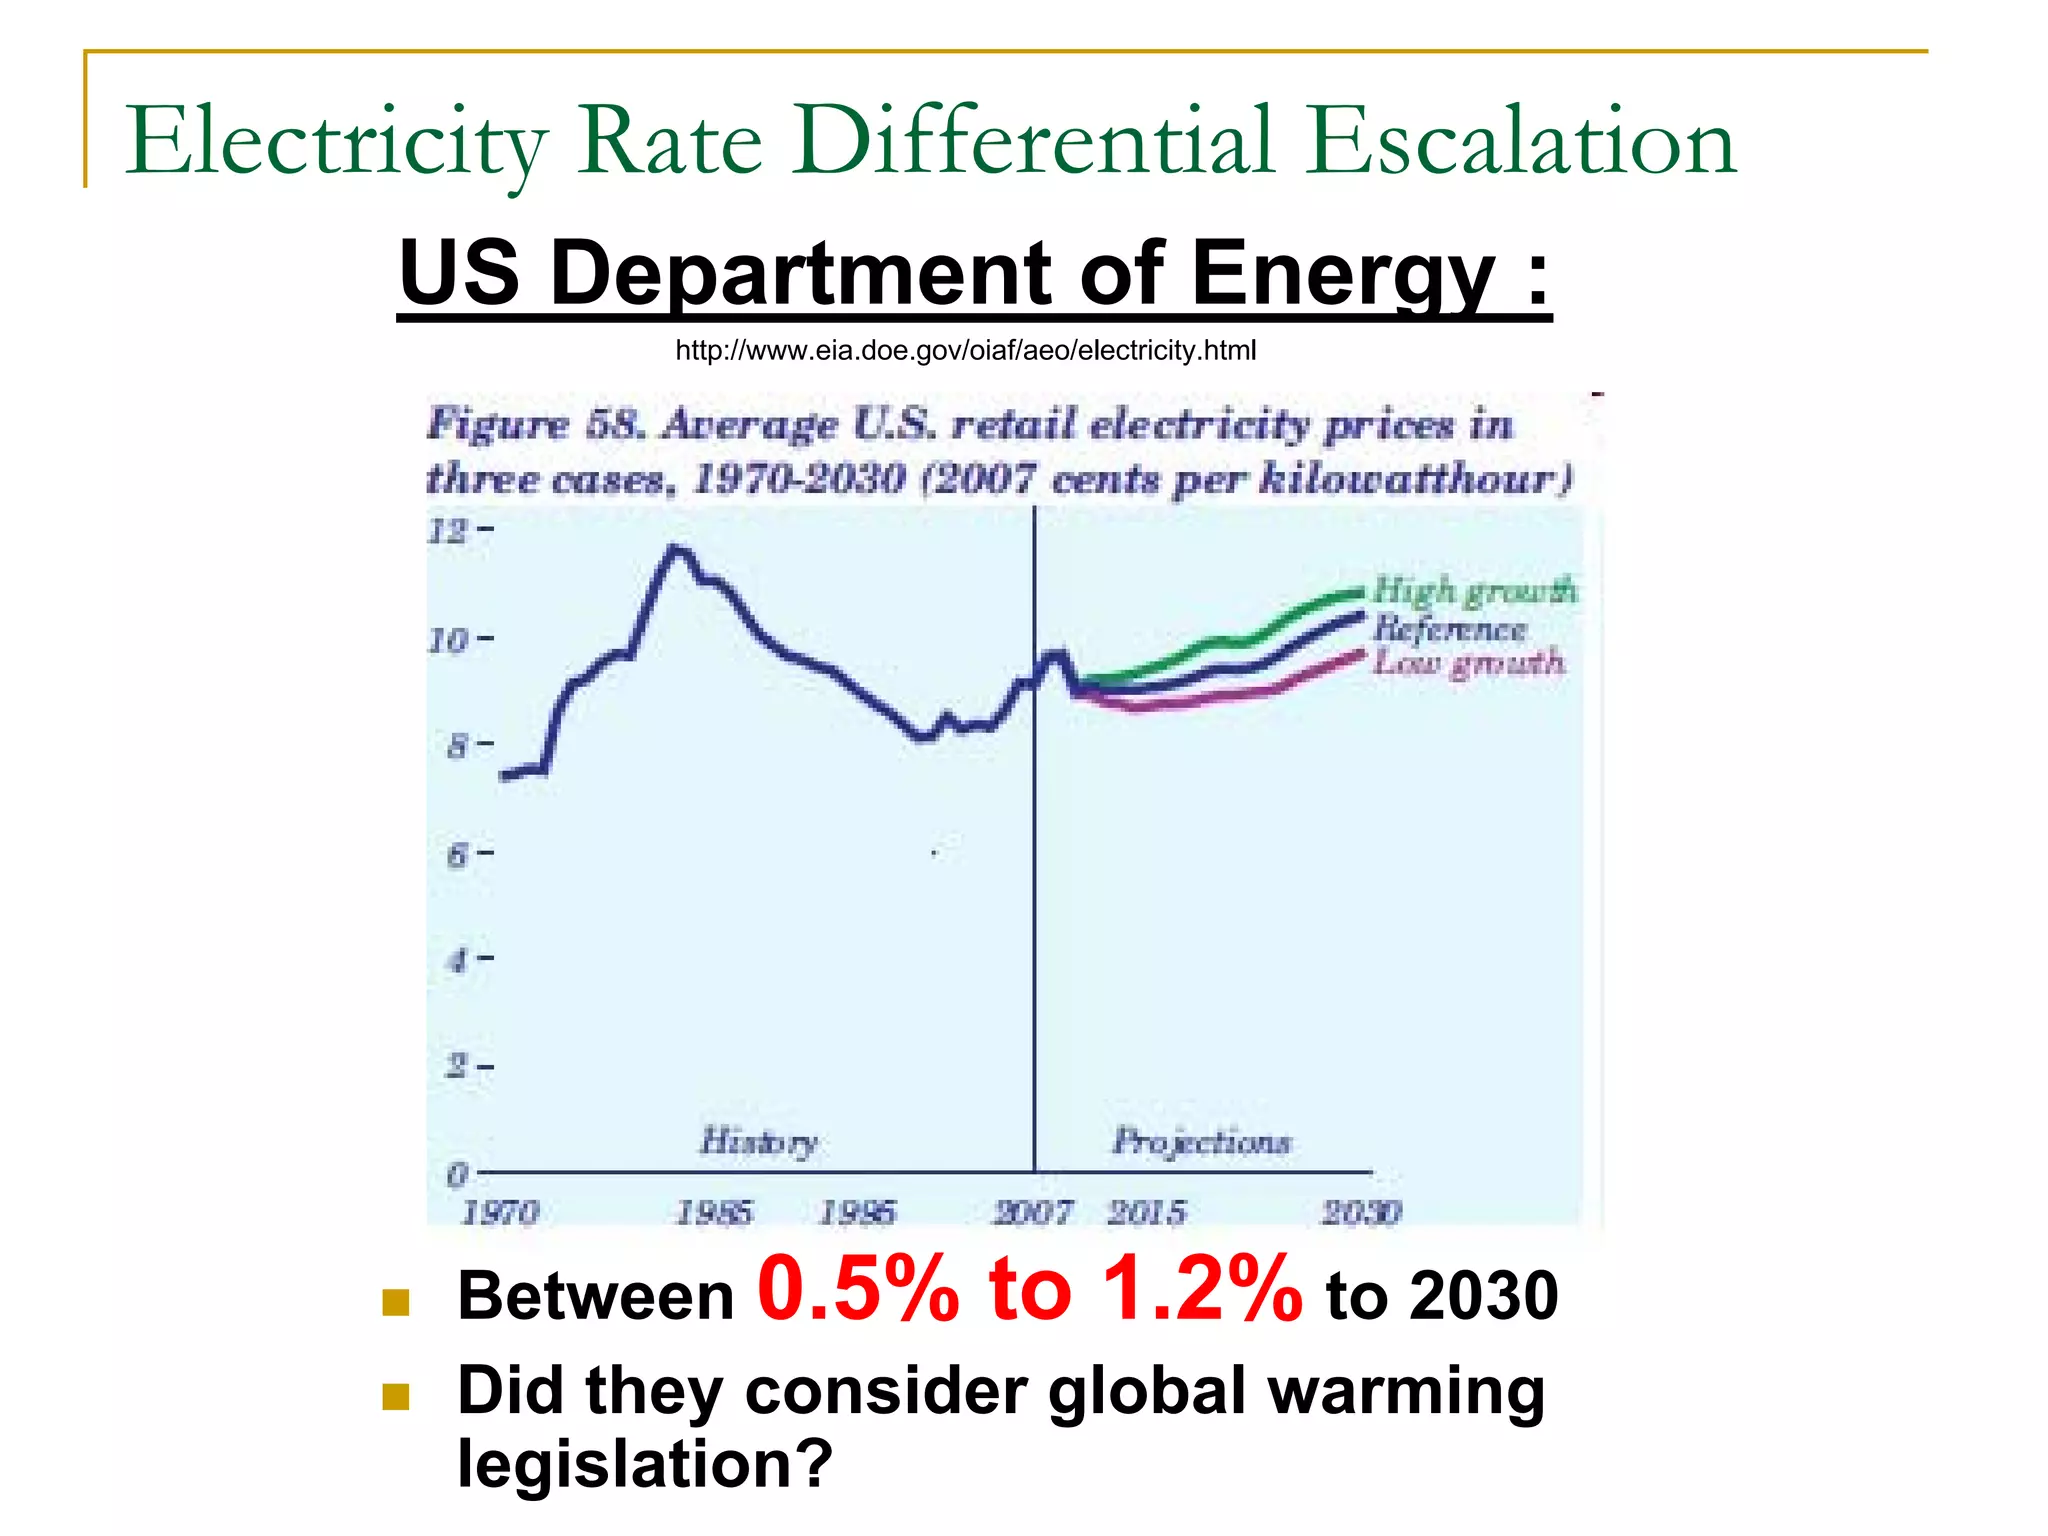
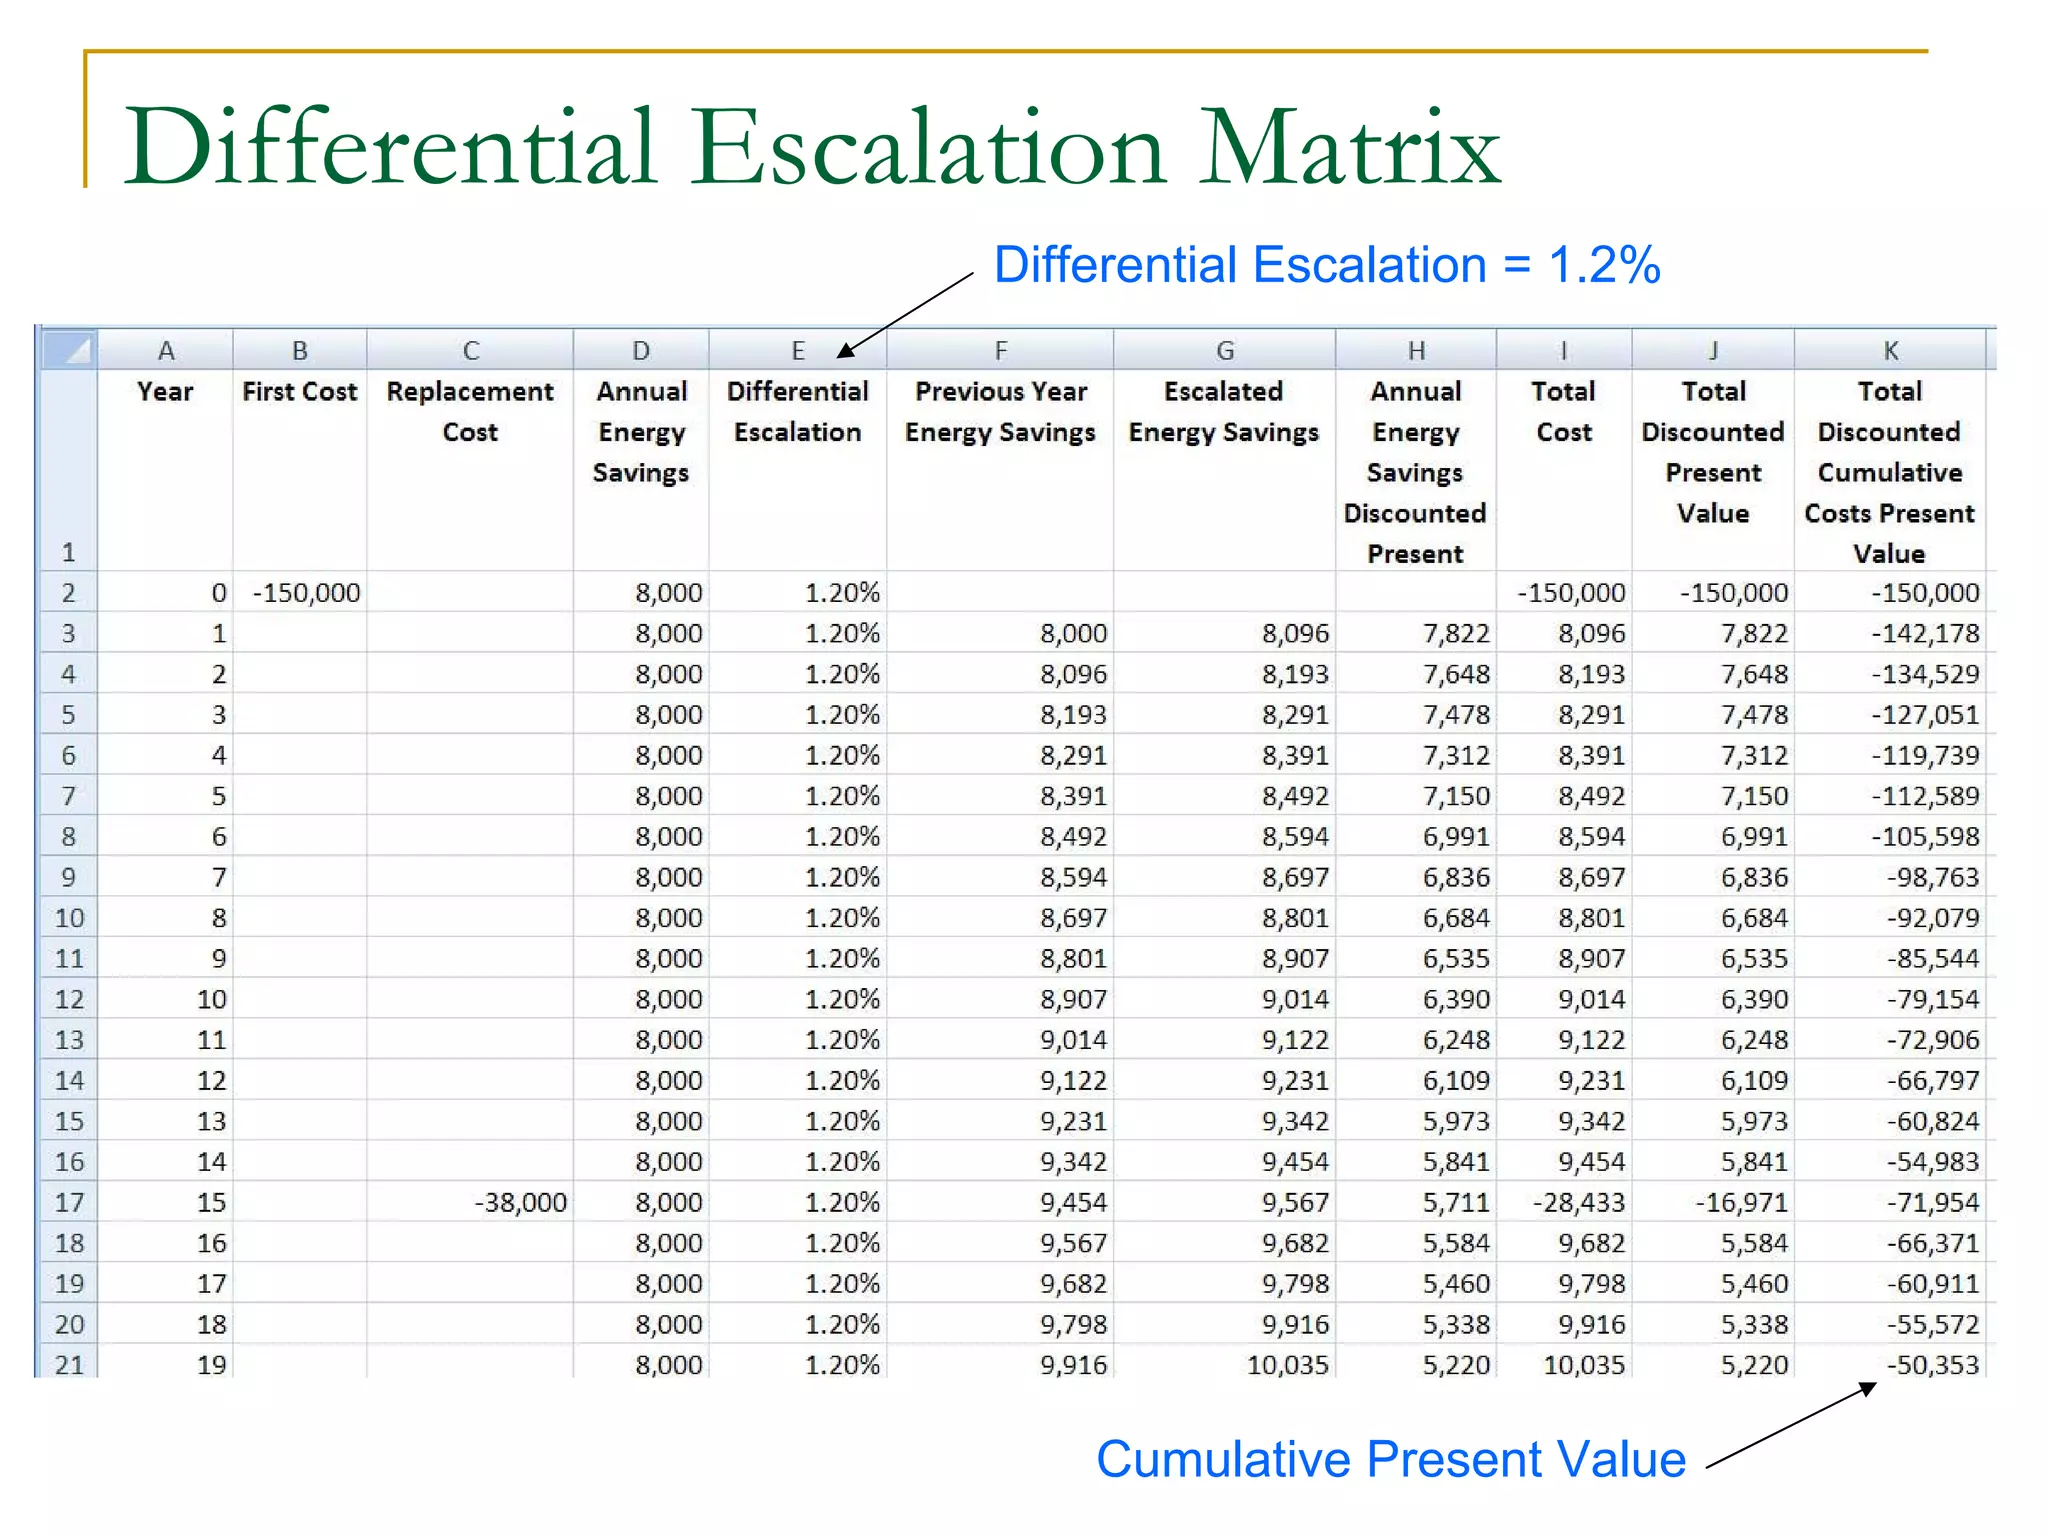
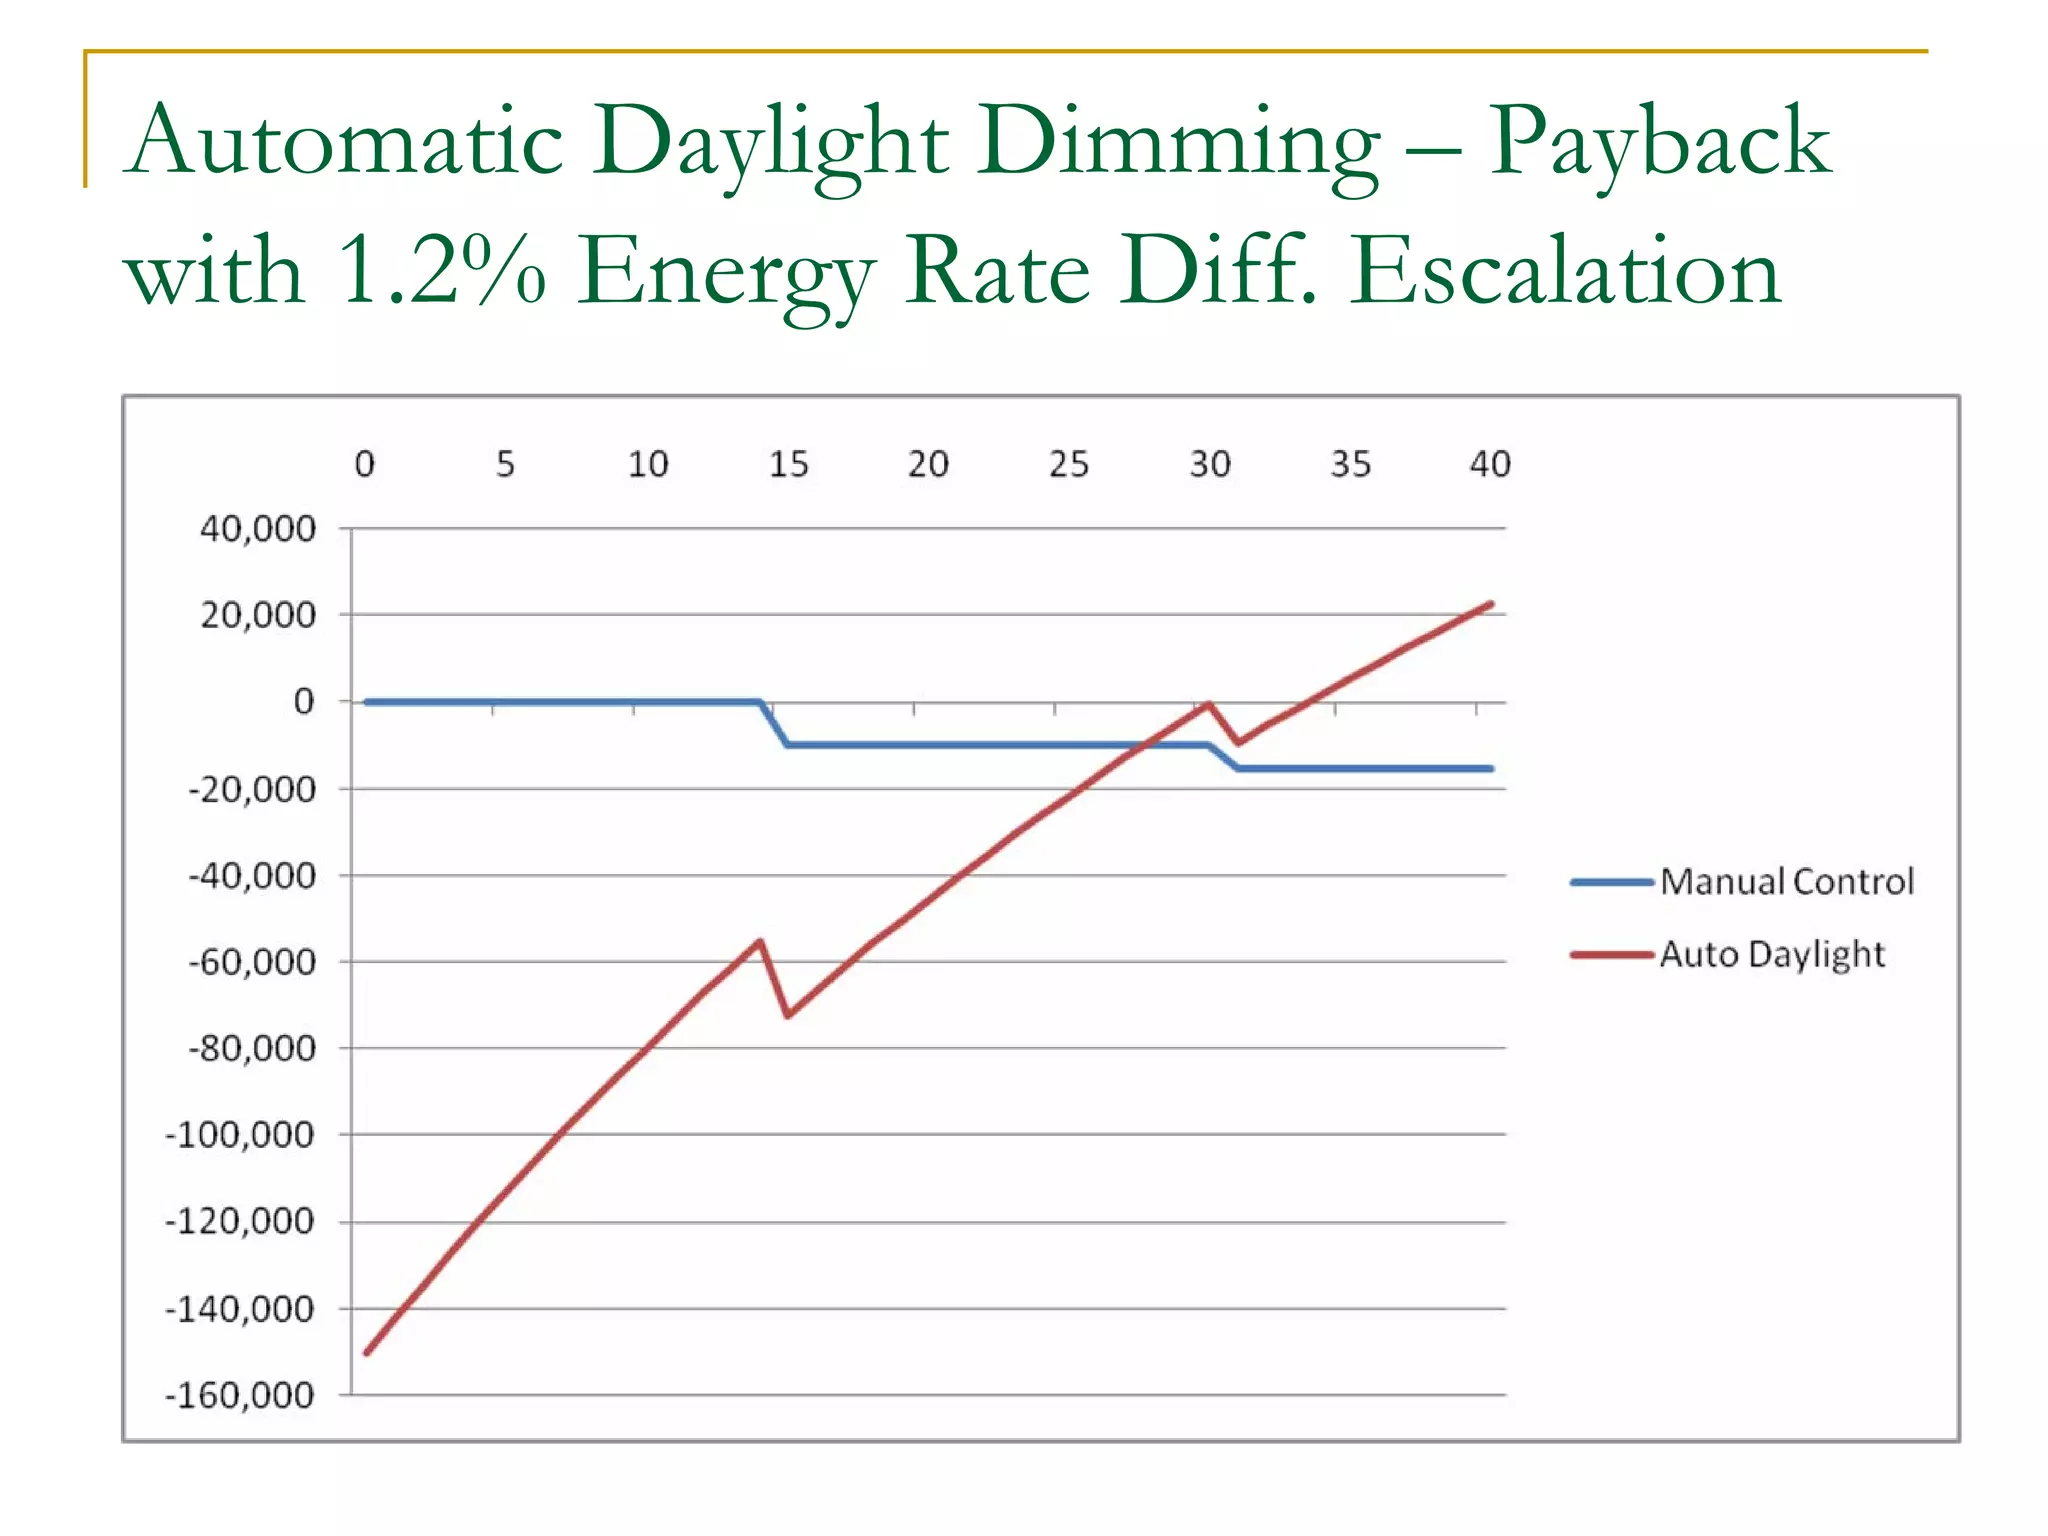
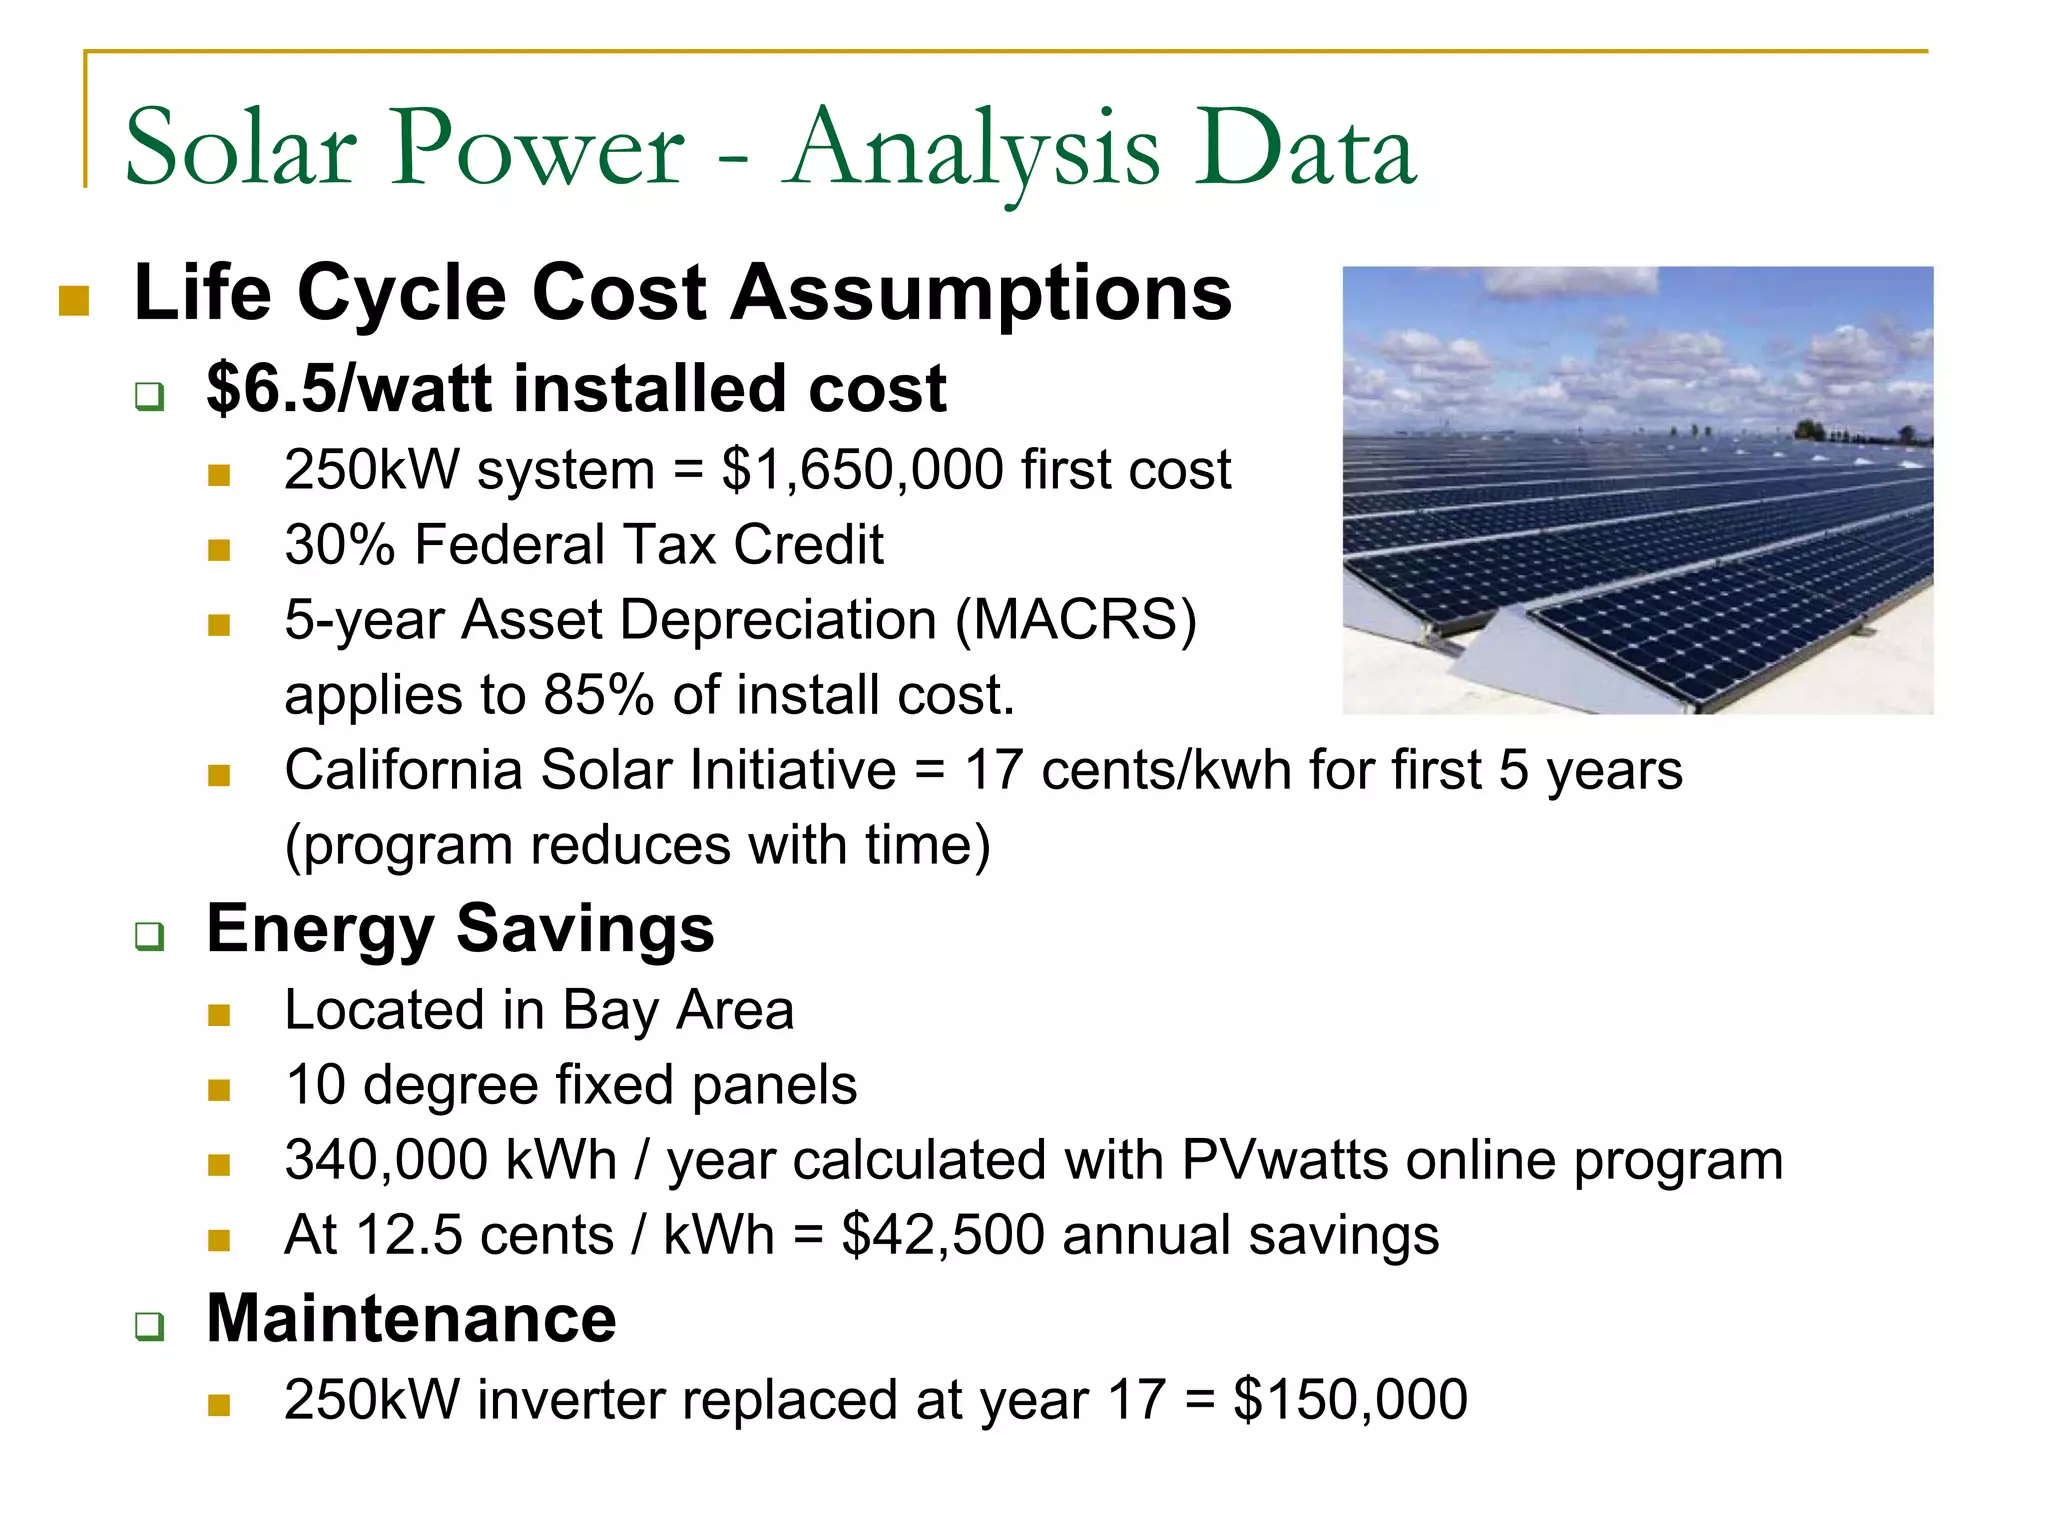
Life Cycle Cost Analysis
Presented by:
Jamie Fox, PE, LEED AP
The Engineering Enterprise
Design Considerations
Sustainability
Human Balance Environment
Design Considerations
Example:
The 5-year investment in a CFL bulb to
replace a high use incandescent will provide a
500% return (ROI), and will outperform the
stock market over 5 years, guaranteed.
Yet, only 1 in 10 California sockets have a CFL bulb.
http://apps1.eere.energy.gov/buildings/publications/pdfs/ssl/cfls_july_lessons.pdf
*** Top Hedge Fund Manger: ***
Jim Simmons: 80% ROI in 2008
Annual Salary: 2.5 billion dollars!!
http://www.iimagazine.com/Alpha/Article.aspx?ArticleID=2165639
Life Cycle Cost Analysis
Presented by:
Jamie Fox, PE, LEED AP
The Engineering Enterprise
The Age of Invention
1909
The Age of Intervention
2009
Occupant Safety Worker Safety Sustainability
Free Markets & Regulation
1776
Free Market:
Consumer is allowed to choose freely
what to buy and each producer is
allowed to choose freely what to sell.
Regulation:
Find the right balance between the
market, government, and non-profit
organizations.
2006
First Costs for Technology
Technology
First
Cost
Code Minimum
30 Year Payback
No Payback
Free Market + Incentives
Research / Development
2009 California Budget Crisis
The “Governator”:
“From each crisis we learn”
“The taxpayers must receive
a return (on investment)”
9/26/08 Commonwealth Club
Return on Investment (with transparency)
“Finally, something everyone
can agree on” - JF
$35,000
Return on Investment $20,000
(Adjusted for Inflation)
Return on Investment
Time Value of Money:
$10,000 = Investment
+ 6.5% = Discount Rate
- 3% = Inflation
20 = Years
$20,000 = 2.0 Growth Factor
Cash Flow Diagram
$10,000
$20,000
0 20
Present Worth of Future Amount
??
$20,000
0 20
Present Worth of Future Amount
Future Amount
(1 + Discount Rate – Inflation)#ofYears
$20,000
(1 + 0.065 - 0.03)20
$10,000=
=
=
Present Worth of Future Amount
Present Worth = $10,000
$20,000
0 20
Present Worth of Annual Amount
$1,000 each year
0 51 2 3 4
??
Present Worth of Annual Amount
Annual Cost * (R)(R) #ofYears – 1
(R-1)
where R = (1+Inflation)
(1+ Discount Rate)
=
– 1 )(
Present Worth of Annual Amount
$1,000 * (.967)(.967)5 – 1
(.967 -1)
$4,500
=
R = 1.03
1.065
= (.967)
– 1
=
( )
Present Worth of Annual Amount
$1,000 each year
0 51 2 3 4
$4500 = Present Worth
Future Replacement Cost
$60,000
0 10
?? = Replacement
Future Replacement Cost
= Today’s Cost * (1 - Inflation + Escalation)#ofYears
= $60,000 * (1 – 0.03 + 0.06)10
= $80,000
Differential Escalation:
Over time, a product’s escalation generally equals inflation,
but items that are “energy intensive” often escalate faster
than the rate of inflation.
Future Replacement Cost
$60,000
0 10
$80,000 = Replacement
Summary of Variables
Discount Rate (3 to 15%) (6.5%)
Inflation Rate (0 to 5%) (3%)
Diff. Escalation Rate (0 to 10%) (1%)
Time (1 to 40 yrs) (30 yr)
First Costs ($ today)
Replacement Costs ($ today + diff esc.)
Annual Costs ($ per year + diff esc.)
Calculate Net Present Worth
Typical Values: Example:
What discount rate should I use?
0%
10%
10 P/E 25 P/E
What energy rate should I use?
15 ¢
8 ¢
¢ /
kWh
12pm
$ /
kW
$ 13
$ 2
6pm
Winter
Summer
$ 8
May Oct
8am 9pm
+ Demand Charges
Energy Rates
http://www.pge.com/tariffs/ERS.SHTML#ERS
Google: “PG&E Tariffs”
Energy Rates - PG&E Summary Table
“Average Total Rate”
Energy Rates – The Future
May Oct
2010: Critical
Peak Day Pricing
(PDP) or (CDP)
12 days / year
¢ /
kWh “Opt Out”:
Time of Use
(TOU)
San Francisco International Airport
Charles de Gaulle Airport - Paris, France
Private Office Daylight Control?
Stanford Law School, Polshek Parternship Architects
Private Office Daylight Control?
Option #1
Manual Dual Level Control
Ballast Replacement
40,000 hours
Option #2
Automatic Daylight Dimming Control
First cost
$4.0/sf office space (does not include Utility rebates)
$1.0/sf savings for HVAC & Conf Rm. Integration
Energy saved
0.5 w/sf during day, 12.5 cents/kwh
Ballasts Replacement
40,000 hours
30% below T24 target
Manual Dual Level Control
0 3015
$16,000
Ballast
Replacement
-$9,500 Net Present Worth
Automatic Daylight Dimming
$8,000 / year
0 3015
$150,000
$38,000
- $ 150,000 First Cost
+ $ 150,000 Energy
- $ 23,000 Ballast
- $ 23,000 NPW
-$23,000 Net Present Worth
Automatic Daylight Dimming
Electricity Rate Differential Escalation
Between 0.5% to 1.2% to 2030
Did they consider global warming
legislation?
http://www.eia.doe.gov/oiaf/aeo/electricity.html
US Department of Energy :
Differential Escalation Matrix
Differential Escalation = 1.2%
Cumulative Present Value
Automatic Daylight Dimming – Payback
with 1.2% Energy Rate Diff. Escalation
Solar Power - Analysis Data
Life Cycle Cost Assumptions
$6.5/watt installed cost
250kW system = $1,650,000 first cost
30% Federal Tax Credit
5-year Asset Depreciation (MACRS)
applies to 85% of install cost.
California Solar Initiative = 17 cents/kwh for first 5 years
(program reduces with time)
Energy Savings
Located in Bay Area
10 degree fixed panels
340,000 kWh / year calculated with PVwatts online program
At 12.5 cents / kWh = $42,500 annual savings
Maintenance
250kW inverter replaced at year 17 = $150,000
Solar Power – Payback Analysis
Payback: 13 to 17 years
Variables:
• 3.5% time value of
money (6.5% - 3%)
• 1.2% Electric Rate
Diff. Escalation
Life Cycle Cost Analysis
Presented by:
Jamie Fox, PE, LEED AP
The Engineering Enterprise
Q&A?

Life Cycle Cost Analysis

  • 1.
    Life Cycle CostAnalysis Presented by: Jamie Fox, PE, LEED AP The Engineering Enterprise
  • 2.
  • 3.
    Design Considerations Example: The 5-yearinvestment in a CFL bulb to replace a high use incandescent will provide a 500% return (ROI), and will outperform the stock market over 5 years, guaranteed. Yet, only 1 in 10 California sockets have a CFL bulb. http://apps1.eere.energy.gov/buildings/publications/pdfs/ssl/cfls_july_lessons.pdf *** Top Hedge Fund Manger: *** Jim Simmons: 80% ROI in 2008 Annual Salary: 2.5 billion dollars!! http://www.iimagazine.com/Alpha/Article.aspx?ArticleID=2165639
  • 4.
    Life Cycle CostAnalysis Presented by: Jamie Fox, PE, LEED AP The Engineering Enterprise
  • 5.
    The Age ofInvention 1909
  • 6.
    The Age ofIntervention 2009 Occupant Safety Worker Safety Sustainability
  • 7.
    Free Markets &Regulation 1776 Free Market: Consumer is allowed to choose freely what to buy and each producer is allowed to choose freely what to sell. Regulation: Find the right balance between the market, government, and non-profit organizations. 2006
  • 8.
    First Costs forTechnology Technology First Cost Code Minimum 30 Year Payback No Payback Free Market + Incentives Research / Development
  • 9.
    2009 California BudgetCrisis The “Governator”: “From each crisis we learn” “The taxpayers must receive a return (on investment)” 9/26/08 Commonwealth Club
  • 10.
    Return on Investment(with transparency) “Finally, something everyone can agree on” - JF $35,000
  • 11.
    Return on Investment$20,000 (Adjusted for Inflation)
  • 12.
    Return on Investment TimeValue of Money: $10,000 = Investment + 6.5% = Discount Rate - 3% = Inflation 20 = Years $20,000 = 2.0 Growth Factor
  • 13.
  • 14.
    Present Worth ofFuture Amount ?? $20,000 0 20
  • 15.
    Present Worth ofFuture Amount Future Amount (1 + Discount Rate – Inflation)#ofYears $20,000 (1 + 0.065 - 0.03)20 $10,000= = =
  • 16.
    Present Worth ofFuture Amount Present Worth = $10,000 $20,000 0 20
  • 17.
    Present Worth ofAnnual Amount $1,000 each year 0 51 2 3 4 ??
  • 18.
    Present Worth ofAnnual Amount Annual Cost * (R)(R) #ofYears – 1 (R-1) where R = (1+Inflation) (1+ Discount Rate) = – 1 )(
  • 19.
    Present Worth ofAnnual Amount $1,000 * (.967)(.967)5 – 1 (.967 -1) $4,500 = R = 1.03 1.065 = (.967) – 1 = ( )
  • 20.
    Present Worth ofAnnual Amount $1,000 each year 0 51 2 3 4 $4500 = Present Worth
  • 21.
  • 22.
    Future Replacement Cost =Today’s Cost * (1 - Inflation + Escalation)#ofYears = $60,000 * (1 – 0.03 + 0.06)10 = $80,000 Differential Escalation: Over time, a product’s escalation generally equals inflation, but items that are “energy intensive” often escalate faster than the rate of inflation.
  • 23.
    Future Replacement Cost $60,000 010 $80,000 = Replacement
  • 24.
    Summary of Variables DiscountRate (3 to 15%) (6.5%) Inflation Rate (0 to 5%) (3%) Diff. Escalation Rate (0 to 10%) (1%) Time (1 to 40 yrs) (30 yr) First Costs ($ today) Replacement Costs ($ today + diff esc.) Annual Costs ($ per year + diff esc.) Calculate Net Present Worth Typical Values: Example:
  • 25.
    What discount rateshould I use? 0% 10% 10 P/E 25 P/E
  • 26.
    What energy rateshould I use? 15 ¢ 8 ¢ ¢ / kWh 12pm $ / kW $ 13 $ 2 6pm Winter Summer $ 8 May Oct 8am 9pm + Demand Charges
  • 27.
  • 28.
    Energy Rates -PG&E Summary Table “Average Total Rate”
  • 29.
    Energy Rates –The Future May Oct 2010: Critical Peak Day Pricing (PDP) or (CDP) 12 days / year ¢ / kWh “Opt Out”: Time of Use (TOU)
  • 30.
  • 31.
    Charles de GaulleAirport - Paris, France
  • 32.
    Private Office DaylightControl? Stanford Law School, Polshek Parternship Architects
  • 33.
  • 34.
    Private Office DaylightControl? Option #1 Manual Dual Level Control Ballast Replacement 40,000 hours Option #2 Automatic Daylight Dimming Control First cost $4.0/sf office space (does not include Utility rebates) $1.0/sf savings for HVAC & Conf Rm. Integration Energy saved 0.5 w/sf during day, 12.5 cents/kwh Ballasts Replacement 40,000 hours 30% below T24 target
  • 35.
    Manual Dual LevelControl 0 3015 $16,000 Ballast Replacement -$9,500 Net Present Worth
  • 36.
    Automatic Daylight Dimming $8,000/ year 0 3015 $150,000 $38,000 - $ 150,000 First Cost + $ 150,000 Energy - $ 23,000 Ballast - $ 23,000 NPW -$23,000 Net Present Worth
  • 37.
  • 38.
    Electricity Rate DifferentialEscalation Between 0.5% to 1.2% to 2030 Did they consider global warming legislation? http://www.eia.doe.gov/oiaf/aeo/electricity.html US Department of Energy :
  • 39.
    Differential Escalation Matrix DifferentialEscalation = 1.2% Cumulative Present Value
  • 40.
    Automatic Daylight Dimming– Payback with 1.2% Energy Rate Diff. Escalation
  • 41.
    Solar Power -Analysis Data Life Cycle Cost Assumptions $6.5/watt installed cost 250kW system = $1,650,000 first cost 30% Federal Tax Credit 5-year Asset Depreciation (MACRS) applies to 85% of install cost. California Solar Initiative = 17 cents/kwh for first 5 years (program reduces with time) Energy Savings Located in Bay Area 10 degree fixed panels 340,000 kWh / year calculated with PVwatts online program At 12.5 cents / kWh = $42,500 annual savings Maintenance 250kW inverter replaced at year 17 = $150,000
  • 42.
    Solar Power –Payback Analysis Payback: 13 to 17 years Variables: • 3.5% time value of money (6.5% - 3%) • 1.2% Electric Rate Diff. Escalation
  • 43.
    Life Cycle CostAnalysis Presented by: Jamie Fox, PE, LEED AP The Engineering Enterprise Q&A?