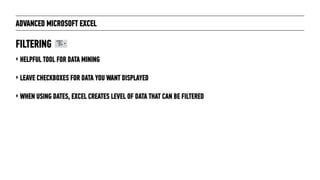
Downloaded 1,425 times


![ADVANCED MICROSOFT EXCEL
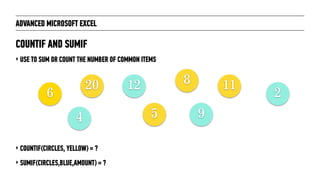
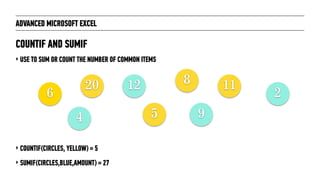
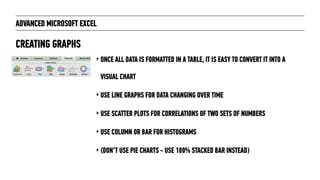
‣ =COUNTIF(RANGE,CRITERIA)
‣ =SUMIF(RANGE,CRITERIA,[SUM_RANGE])
COUNTIF AND SUMIF - SYNTAX](https://image.slidesharecdn.com/advancedmicrosoftexcel-150907190512-lva1-app6891/85/Advanced-Microsoft-Excel-16-320.jpg)
![ADVANCED MICROSOFT EXCEL
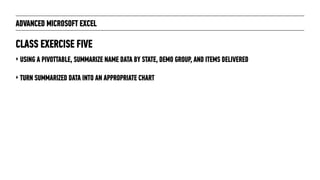
‣ =COUNTIF(RANGE,CRITERIA)
‣ =SUMIF(RANGE,CRITERIA,[SUM_RANGE])
‣ SUPER ADVANCED MICROSOFT EXCEL: COUNTIFS AND SUMIFS
COUNTIF AND SUMIF - SYNTAX](https://image.slidesharecdn.com/advancedmicrosoftexcel-150907190512-lva1-app6891/85/Advanced-Microsoft-Excel-17-320.jpg)
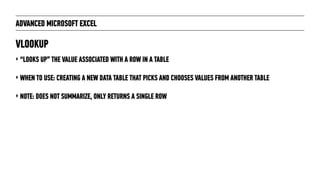
![ADVANCED MICROSOFT EXCEL
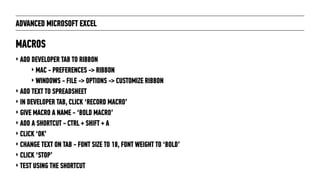
‣ =VLOOKUP(LOOKUP_VALUE,TABLE_ARRAY,COL_INDEX_NUMBER,[RANGE_LOOKUP])
‣ NOTES:
‣ TABLE_ARRAY - THIS IS A RANGE. MAKE SURE TO ANCHOR CELLS!
‣ COL_INDEX_NUMBER - FIRST COLUMN IS 0.
‣ RANGE_LOOKUP - TRUE = APPROXIMATE MATCH. FALSE = EXACT MATCH. ALMOST ALWAYS USE FALSE!
VLOOKUP - SYNTAX](https://image.slidesharecdn.com/advancedmicrosoftexcel-150907190512-lva1-app6891/85/Advanced-Microsoft-Excel-19-320.jpg)
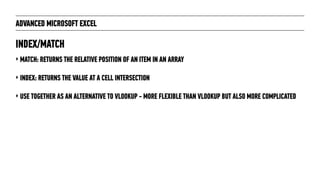
![ADVANCED MICROSOFT EXCEL
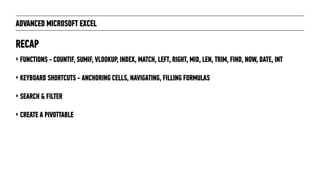
‣ =MATCH(LOOKUP_VALUE,TABLE_ARRAY,[MATCH_TYPE])
‣ NOTES:
‣ TABLE ARRAY IS A SINGLE COLUMN
‣ MATCH_TYPE IS -1, 0, OR 1
‣ IF 1, FINDS THE LARGEST VALUE <= TO LOOKUP VALUE
‣ IF 0, FINDS THE FIRST EXACT MATCH
‣ IF -1, FINDS THE SMALLEST VALUE >= TO LOOKUP VALUE
MATCH - SYNTAX](https://image.slidesharecdn.com/advancedmicrosoftexcel-150907190512-lva1-app6891/85/Advanced-Microsoft-Excel-21-320.jpg)
![ADVANCED MICROSOFT EXCEL
‣ =INDEX(ARRAY,ROW_NUM,[COLUMN_NUM])
‣ NOTES:
‣ ARRAY IS A SINGLE COLUMN
‣ ROW_NUM - FIRST COLUMN IS 0.
‣ COLUMN_NUM - OPTIONAL AND USUALLY NOT NECESSARY
INDEX - SYNTAX](https://image.slidesharecdn.com/advancedmicrosoftexcel-150907190512-lva1-app6891/85/Advanced-Microsoft-Excel-22-320.jpg)
![ADVANCED MICROSOFT EXCEL
‣ =INDEX(ARRAY,MATCH(LOOKUP_VALUE,TABLE_ARRAY,[MATCH_TYPE]))
‣ MATCH ACTS AS THE ROW NUMBER
‣ SAME NUMBER OF ARGUMENTS AS VLOOKUP!
INDEX/MATCH - SYNTAX](https://image.slidesharecdn.com/advancedmicrosoftexcel-150907190512-lva1-app6891/85/Advanced-Microsoft-Excel-23-320.jpg)


![ADVANCED MICROSOFT EXCEL
‣ LEFT(TEXT,[NUM_CHARS])
‣ SAME FOR RIGHT
‣ WHEN TO USE - WHEN YOU ONLY WANT CHARACTERS THAT BEGIN OR END TEXT IN A CELL
‣ I.E. THE ZIP CODE AT THE END OF AN ADDRESS
LEFT RIGHT](https://image.slidesharecdn.com/advancedmicrosoftexcel-150907190512-lva1-app6891/85/Advanced-Microsoft-Excel-31-320.jpg)
![ADVANCED MICROSOFT EXCEL
‣ TRIM(TEXT)
‣ REMOVE BLANK SPACES AT THE BEGINNING OR END OF A STRING
‣ COMMON PROBLEM WHEN TRANSFERRING DATA FROM ONE
PROGRAM TO ANOTHER
TRIM
FIND
‣ FIND(FIND_TEXT,WITHIN_TEXT,[START_NUM])
‣ HELPFUL WHEN NEEDED DATA IS EMBEDDED WITHIN A COMPLETE
STRING E.G. ZIP CODE WITHIN AN ADDRESS](https://image.slidesharecdn.com/advancedmicrosoftexcel-150907190512-lva1-app6891/85/Advanced-Microsoft-Excel-33-320.jpg)
![ADVANCED MICROSOFT EXCEL
‣ DATE(YEAR,MONTH,DAY)
‣ ALLOWS CONVERSION OF DATES SHOWN AS TEXT TO
NUMBER
DATE
INT
‣ FIND(FIND_TEXT,WITHIN_TEXT,[START_NUM])
‣ REMOVES THE DECIMAL (TIME) PORTION FROM A DATE
DIFFERENCE, LEAVING THE INTEGER (DATE) PORTION](https://image.slidesharecdn.com/advancedmicrosoftexcel-150907190512-lva1-app6891/85/Advanced-Microsoft-Excel-35-320.jpg)


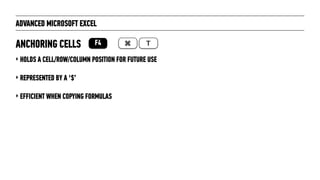
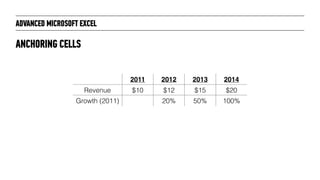
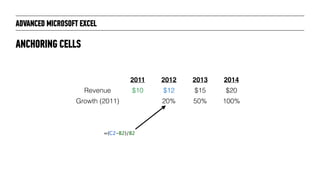
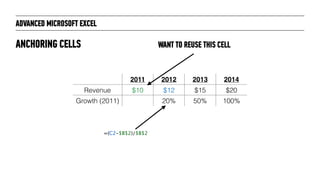
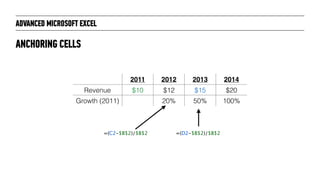
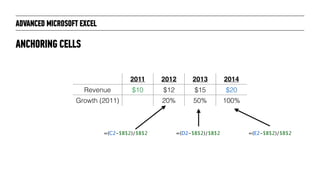
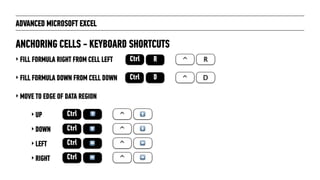
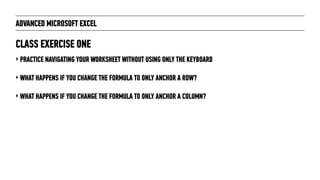
The document outlines an advanced Microsoft Excel training agenda covering anchoring cells, functions for summarizing data, sorting and filtering, text and time functions, pivot tables, and macros. Key topics include using dollar signs to anchor cells for copying formulas, COUNTIF, SUMIF, VLOOKUP, INDEX/MATCH functions, sorting and filtering data, text functions like LEFT, RIGHT, MID, TRIM and FIND, time functions like NOW and DATE, creating pivot tables, and recording macros. Class exercises are included to practice these skills on sample name and data sets.


![20260201 [FOSDEM] gomodjail - library sandboxing for Go modules.pdf](https://cdn.slidesharecdn.com/ss_thumbnails/20260201fosdemgomodjail-librarysandboxingforgomodules-260201225659-76609ec4-thumbnail.jpg?width=640&height=640&fit=bounds)


