Download to read offline


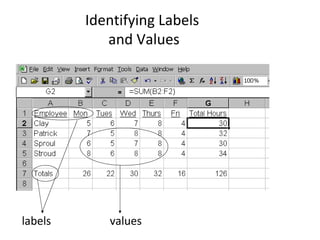


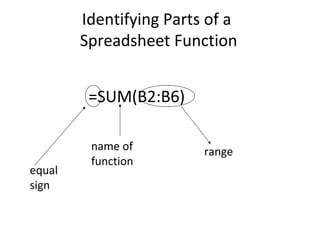
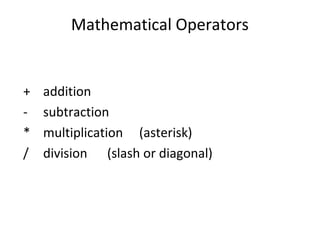


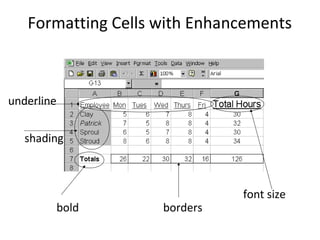


This document provides an introduction to spreadsheets and their main components. It discusses labels, values, formulas and functions. It also outlines some common uses of spreadsheets like budgets, grades, and financial statements. The document identifies the parts of a spreadsheet window like columns, rows, cells, and describes entering different data types. It explains formulas and functions, relative and absolute referencing, and basic formatting and analysis tools like sorting, charts and graphs. Practical examples are provided on formatting cells and changing column widths.


![Spreadsheets[1]](https://cdn.slidesharecdn.com/ss_thumbnails/spreadsheets1-150131022908-conversion-gate01-thumbnail.jpg?width=640&height=640&fit=bounds)


