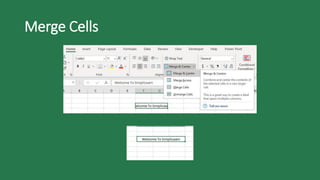
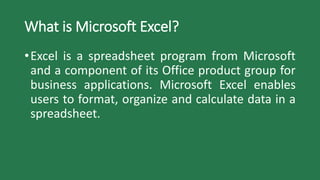
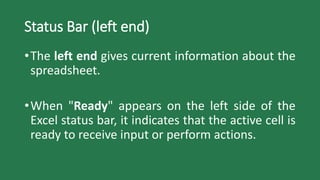
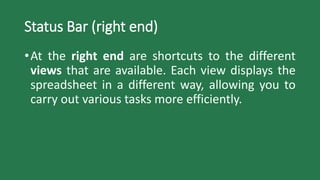
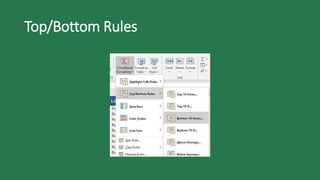
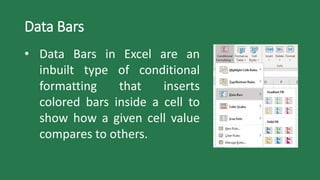
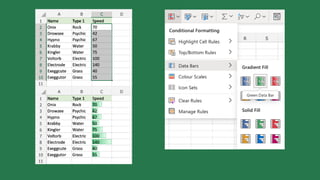
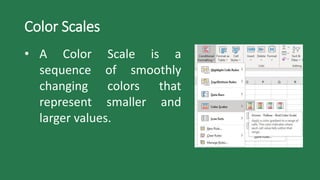
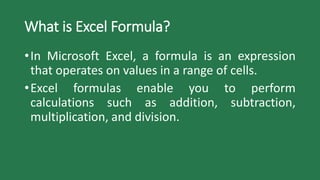
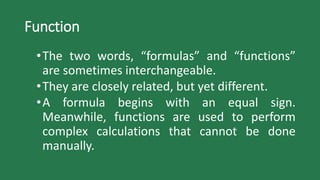
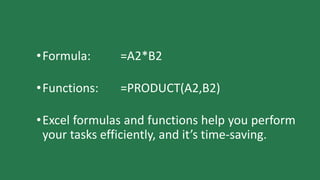
What is Microsoft Excel?
•Excel is a spreadsheet program from Microsoft
and a component of its Office product group for
business applications. Microsoft Excel enables
users to format, organize and calculate data in a
spreadsheet.
History and future of Excel
•Microsoft released Excel in 1985 under the name
Microsoft Multiplan. Microsoft's spreadsheet
program competed with similar products at the
time, including Lotus 1-2-3 from the Lotus
Development Corp.
•The Title bar section has window controls at the
right end, as in other Microsoft Office programs.
•The Quick Access Toolbar is located all the way to
the left on the title bar. It contains frequently
used commands and can be customized using the
drop-down menu.
•The Ribbon contains all of the tools that you use
to interact with your Microsoft Excel file. The
ribbon has a number of tabs, each of which
contains buttons, which are organized into
groups.
•Contextual tabs are displayed when certain
objects, such as images and charts, are selected.
They contain additional options for modifying
the object.
•the File tab provides a Backstage view of your
document. Backstage view gives you various
options for saving, opening a file, printing, or
sharing your document.
Parts of the Excel window
•Name Box – Displays the current selected cell.
•Formula Bar – Displays the number, text, or
formula that is in the currently selected cell, and
allows you to edit it. It behaves just like a text
box.
•Selected Cell – The selected cell has a dark
border around it.
Parts of the Excel window
•Column – Columns run vertically (top to
bottom).
•Column Label – Identifies each column with a
letter. Clicking on a column label selects the
entire column.
•Row – Rows run horizontally (left to right).
•Row Label – Identifies each row with a number.
Clicking on a row label selects the entire row.
Parts of the Excel window
•Cell – The intersection of a row and column.
•Worksheets – The worksheets contained in a
workbook are displayed at the bottom-left of the
screen.
•Scroll Bars – Used to view other parts of a
worksheet when the entire worksheet cannot fit
on the screen.
Status Bar
•The Status Bar is located below the document
window area.
Status Bar (left end)
•The left end gives current information about the
spreadsheet.
•When "Ready" appears on the left side of the
Excel status bar, it indicates that the active cell is
ready to receive input or perform actions.
Status Bar (right end)
•At the right end are shortcuts to the different
views that are available. Each view displays the
spreadsheet in a different way, allowing you to
carry out various tasks more efficiently.
Views
•Normal – It simply displays the grid of cells that
make up your spreadsheet.
•Page Layout – Show what your spreadsheet will
look like when printed on paper.
•Page Break Preview – Allows you to add page
breaks to your spreadsheets so you can better
control what parts of the spreadsheets are
printed on each page.
Normal View
Page Layout View
Page Break Preview
Zoom Slider
•Also at the right end of the Status Bar is the
Zoom Slider. This allows you to adjust how large
the spreadsheet is displayed on the screen. It
does not adjust the actual size of the text – jus
how big or small they are rendered on the
screen.
Understanding Workbooks
•In Microsoft Excel the data you enter, whether it
consists of numbers, text, or formulas, is stored
in a file known as a workbook. Workbooks are
just like huge electronic books with pages (or
sheets) that have been ruled into columns and
rows.
Understanding Workbooks
•A worksheet (or page) in a workbook contains
16,384 columns that are labelled using letters of
the alphabet. The first column in a worksheet is
labelled column A, while the last is labelled XFD.
Understanding Workbooks
•A worksheet (or page) in a workbook contains
1,048,576 rows that are labelled using numbers
from 1 to 1,048,576.
Understanding Workbooks
•Where a column and row intersect we get what
is known as a cell. You enter your data into these
cells. Each cell in a worksheet can hold up to
32,767 characters. Cells are referred to by their
column and row labels.
Cell Address
•For example, the cell we are pointing to is B2 –
this reference is known as the cell address and is
most important as it is frequently used in
commands and formulas.
Active Cell
•When the Status Bar show Ready mode, at least
one cell in the worksheet will be highlighted –
this is known as the active cell. You can have
more than active cell – when this occurs you
have what is known as a range.
Worksheets
•A workbook is made up of pages known as
worksheets. You can have as many sheets in a
workbook as your computer resources can
accommodate.
•Add new Worksheet
Navigating in a File
•Arrow Keys – Move one cell to the right, left, up
or down.
•Tab – Move one cell to the right
•Ctrl+Home – To beginning file
•Ctrl+End – To end of typed information
•Home – Beginning of a line
•End – End of a line
Navigating in a File
•Page Down – Down one screen
•Page Up – Up one screen
•F5 – To a specific page
•Scroll bars – Appear at the right and on the
bottom of the screen. You may click the scroll
arrows, drag the scroll box or click the scroll bar
to move through the document.
Filling a Series
•A series refers to a sequence of ordered entries
in adjacent cells, such as days of the week or
months of the year.
•The fill technique can be used to create these in
a worksheet for you, reducing the amount of
time taken for data entry, and ensuring that the
spelling is correct.
Filling a Series
•Excel provides days and months as special built-
in series that you can access.
To fill a series:
1. Click on the first cell in the series
2. Drag from the fill handle across as many
columns as required
Filling a Series
•As you drag the fill handle across, a tool tip
appears below the fill pointer displaying the
current value in the series. This is really handy
when you want to end on particular month, day
or value.
Filling a Series
Filling a Series
Filling a Series
Freezing Rows and Columns
•When you lay out your data in rows and
columns, it is most likely that your headings end
up at the top or to the left of your data, if you
have a large amount of data, you may find that
when you scroll across or down to particular
cells, the headings scroll out of view. This
problem can be resolved by freezing the rows
and/or columns that hold the headings.
Freezing Rows and Columns
•To freeze panes in a worksheet:
1. Click in the cell below and to the right of the
area you want to freeze/unfreeze
2. Click on the view tab
3. Click on Freeze Panes in the Window group,
the select Freeze Panes
What is Conditional Formatting?
•Conditional formatting is feature in Microsoft
Excel that allows you to apply specific formatting
to your cells according to certain criteria.
•It enables you to make sense of your data and
spot significant trends.
Highlight Cells Rules
Top/Bottom Rules
Data Bars
• Data Bars in Excel are an
inbuilt type of conditional
formatting that inserts
colored bars inside a cell to
show how a given cell value
compares to others.
Color Scales
• A Color Scale is a
sequence of smoothly
changing colors that
represent smaller and
larger values.
Icon Sets
• Icon Sets in Excel are ready-
to-use formatting options
that add various icons to
cells, such as arrows, shapes,
check marks, flags, rating
stars, etc. to visually show
how cell values in a range
are compared to each other.
Icon Sets Options
What is Excel Formula?
•In Microsoft Excel, a formula is an expression
that operates on values in a range of cells.
•Excel formulas enable you to perform
calculations such as addition, subtraction,
multiplication, and division.
Function
•The two words, “formulas” and “functions”
are sometimes interchangeable.
•They are closely related, but yet different.
•A formula begins with an equal sign.
Meanwhile, functions are used to perform
complex calculations that cannot be done
manually.
•Formula: =A2*B2
•Functions: =PRODUCT(A2,B2)
•Excel formulas and functions help you perform
your tasks efficiently, and it’s time-saving.
Excel Formulas and Functions
1. SUM
The SUM() function, as the name suggests,
gives the total of the selected range of cell
values. It performs the mathematical operation
which is addition.
=SUM(number 1, [number 2],…)
Excel Formulas and Functions
2. AVERAGE
The AVERAGE() function focuses on calculating
the average of the selected range of cell values.
=AVERAGE(number 1, [number 2],…)
Excel Formulas and Functions
3. COUNT
The function COUNT() counts the total number
of cells in a range that contains a number. It
does not include the cell, which is blank, and
the ones that hold data in any other format
apart from numeric.
=COUNT(value 1, [value 2],…)
Excel Formulas and Functions
4. COUNTA
The COUNTA() function is a premade function
in Excel, which counts cells in a range that has
values, both numbers and letters.
=COUNTA(value 1, [value 2],…)
Excel Formulas and Functions
5. COUNTBLANK
The COUNTBLANK() function is a premade
function in Excel, which counts blank cells in a
range.
=COUNTBLANK(range)
Excel Formulas and Functions
6. SUBTOTAL
The SUBTOTAL() function returns the subtotal in
a database. Depending on what you want to
select either Average, Count, Sum, Min, Max,
and others.
=SUBTOTAL(function_num,ref1,[ref2],…)
=SUBTOTAL(1,A2:A4)
Excel Formulas and Functions
7. MODULUS
The MOD() function works on returning the
remainder when a particular number is divided
by a divisor.
=MOD(number,divisor)
=MOD(A2,3)
Excel Formulas and Functions
8. POWER
The function POWER() returns the result of a
number raised to a certain power.
=POWER(number,power)
=POWER(A2,3)
Excel Formulas and Functions
9. CEILING
The CEILING() function rounds a number up to
its nearest multiple significance.
=CEILING(number,significance)
Excel Formulas and Functions
10. FLOOR
Contrary to the Ceiling function, the floor
function rounds a number down to the nearest
multiple of significance.
=FLOOR(number,significance)
Excel Formulas and Functions
11. CONCATENATE
This function merges or joins several text
strings into one text string.
=CONCATENATE(text1, [text2],…)
Excel Formulas and Functions
12. LEN
The function LEN() returns the total number of
characters in a string. So, it will count the
overall characters, including spaces and special
characters.
=CONCATENATE(text1, [text2],…)
Merge Cells
Merge and Center
•Combine and center the contents of the
selected cells in a new larger cell
•This is a great way to create labels that spans
multiple columns.
Merge Across
•Merge selected cells in the same row into one
larger cell.
Merge Cell
•Merge the selected cells into one cell.
Split Cells
Data > Data Tools > Text to Columns
•Split a single column of text into multiple
columns.
•You can choose how to split it up: fixed width
or split at each comma, period, or other
character.
Split Cells
Split Cells
Split Cells
Split Cells
Split Cells

Microsoft Excel Essentials: A Beginner's Guide

  • 2.
    What is MicrosoftExcel? •Excel is a spreadsheet program from Microsoft and a component of its Office product group for business applications. Microsoft Excel enables users to format, organize and calculate data in a spreadsheet.
  • 3.
    History and futureof Excel •Microsoft released Excel in 1985 under the name Microsoft Multiplan. Microsoft's spreadsheet program competed with similar products at the time, including Lotus 1-2-3 from the Lotus Development Corp.
  • 4.
    •The Title barsection has window controls at the right end, as in other Microsoft Office programs. •The Quick Access Toolbar is located all the way to the left on the title bar. It contains frequently used commands and can be customized using the drop-down menu. •The Ribbon contains all of the tools that you use to interact with your Microsoft Excel file. The ribbon has a number of tabs, each of which contains buttons, which are organized into groups.
  • 5.
    •Contextual tabs aredisplayed when certain objects, such as images and charts, are selected. They contain additional options for modifying the object. •the File tab provides a Backstage view of your document. Backstage view gives you various options for saving, opening a file, printing, or sharing your document.
  • 7.
    Parts of theExcel window •Name Box – Displays the current selected cell. •Formula Bar – Displays the number, text, or formula that is in the currently selected cell, and allows you to edit it. It behaves just like a text box. •Selected Cell – The selected cell has a dark border around it.
  • 8.
    Parts of theExcel window •Column – Columns run vertically (top to bottom). •Column Label – Identifies each column with a letter. Clicking on a column label selects the entire column. •Row – Rows run horizontally (left to right). •Row Label – Identifies each row with a number. Clicking on a row label selects the entire row.
  • 9.
    Parts of theExcel window •Cell – The intersection of a row and column. •Worksheets – The worksheets contained in a workbook are displayed at the bottom-left of the screen. •Scroll Bars – Used to view other parts of a worksheet when the entire worksheet cannot fit on the screen.
  • 10.
    Status Bar •The StatusBar is located below the document window area.
  • 11.
    Status Bar (leftend) •The left end gives current information about the spreadsheet. •When "Ready" appears on the left side of the Excel status bar, it indicates that the active cell is ready to receive input or perform actions.
  • 12.
    Status Bar (rightend) •At the right end are shortcuts to the different views that are available. Each view displays the spreadsheet in a different way, allowing you to carry out various tasks more efficiently.
  • 13.
    Views •Normal – Itsimply displays the grid of cells that make up your spreadsheet. •Page Layout – Show what your spreadsheet will look like when printed on paper. •Page Break Preview – Allows you to add page breaks to your spreadsheets so you can better control what parts of the spreadsheets are printed on each page.
  • 14.
  • 15.
  • 16.
  • 17.
    Zoom Slider •Also atthe right end of the Status Bar is the Zoom Slider. This allows you to adjust how large the spreadsheet is displayed on the screen. It does not adjust the actual size of the text – jus how big or small they are rendered on the screen.
  • 18.
    Understanding Workbooks •In MicrosoftExcel the data you enter, whether it consists of numbers, text, or formulas, is stored in a file known as a workbook. Workbooks are just like huge electronic books with pages (or sheets) that have been ruled into columns and rows.
  • 19.
    Understanding Workbooks •A worksheet(or page) in a workbook contains 16,384 columns that are labelled using letters of the alphabet. The first column in a worksheet is labelled column A, while the last is labelled XFD.
  • 20.
    Understanding Workbooks •A worksheet(or page) in a workbook contains 1,048,576 rows that are labelled using numbers from 1 to 1,048,576.
  • 21.
    Understanding Workbooks •Where acolumn and row intersect we get what is known as a cell. You enter your data into these cells. Each cell in a worksheet can hold up to 32,767 characters. Cells are referred to by their column and row labels.
  • 22.
    Cell Address •For example,the cell we are pointing to is B2 – this reference is known as the cell address and is most important as it is frequently used in commands and formulas.
  • 23.
    Active Cell •When theStatus Bar show Ready mode, at least one cell in the worksheet will be highlighted – this is known as the active cell. You can have more than active cell – when this occurs you have what is known as a range.
  • 24.
    Worksheets •A workbook ismade up of pages known as worksheets. You can have as many sheets in a workbook as your computer resources can accommodate. •Add new Worksheet
  • 25.
    Navigating in aFile •Arrow Keys – Move one cell to the right, left, up or down. •Tab – Move one cell to the right •Ctrl+Home – To beginning file •Ctrl+End – To end of typed information •Home – Beginning of a line •End – End of a line
  • 26.
    Navigating in aFile •Page Down – Down one screen •Page Up – Up one screen •F5 – To a specific page •Scroll bars – Appear at the right and on the bottom of the screen. You may click the scroll arrows, drag the scroll box or click the scroll bar to move through the document.
  • 27.
    Filling a Series •Aseries refers to a sequence of ordered entries in adjacent cells, such as days of the week or months of the year. •The fill technique can be used to create these in a worksheet for you, reducing the amount of time taken for data entry, and ensuring that the spelling is correct.
  • 28.
    Filling a Series •Excelprovides days and months as special built- in series that you can access. To fill a series: 1. Click on the first cell in the series 2. Drag from the fill handle across as many columns as required
  • 29.
    Filling a Series •Asyou drag the fill handle across, a tool tip appears below the fill pointer displaying the current value in the series. This is really handy when you want to end on particular month, day or value.
  • 30.
  • 31.
  • 32.
  • 33.
    Freezing Rows andColumns •When you lay out your data in rows and columns, it is most likely that your headings end up at the top or to the left of your data, if you have a large amount of data, you may find that when you scroll across or down to particular cells, the headings scroll out of view. This problem can be resolved by freezing the rows and/or columns that hold the headings.
  • 34.
    Freezing Rows andColumns •When you lay out your data in rows and columns, it is most likely that your headings end up at the top or to the left of your data, if you have a large amount of data, you may find that when you scroll across or down to particular cells, the headings scroll out of view. This problem can be resolved by freezing the rows and/or columns that hold the headings.
  • 35.
    Freezing Rows andColumns •To freeze panes in a worksheet: 1. Click in the cell below and to the right of the area you want to freeze/unfreeze 2. Click on the view tab 3. Click on Freeze Panes in the Window group, the select Freeze Panes
  • 36.
    What is ConditionalFormatting? •Conditional formatting is feature in Microsoft Excel that allows you to apply specific formatting to your cells according to certain criteria. •It enables you to make sense of your data and spot significant trends.
  • 37.
  • 38.
  • 39.
    Data Bars • DataBars in Excel are an inbuilt type of conditional formatting that inserts colored bars inside a cell to show how a given cell value compares to others.
  • 41.
    Color Scales • AColor Scale is a sequence of smoothly changing colors that represent smaller and larger values.
  • 43.
    Icon Sets • IconSets in Excel are ready- to-use formatting options that add various icons to cells, such as arrows, shapes, check marks, flags, rating stars, etc. to visually show how cell values in a range are compared to each other.
  • 44.
  • 46.
    What is ExcelFormula? •In Microsoft Excel, a formula is an expression that operates on values in a range of cells. •Excel formulas enable you to perform calculations such as addition, subtraction, multiplication, and division.
  • 47.
    Function •The two words,“formulas” and “functions” are sometimes interchangeable. •They are closely related, but yet different. •A formula begins with an equal sign. Meanwhile, functions are used to perform complex calculations that cannot be done manually.
  • 48.
    •Formula: =A2*B2 •Functions: =PRODUCT(A2,B2) •Excelformulas and functions help you perform your tasks efficiently, and it’s time-saving.
  • 49.
    Excel Formulas andFunctions 1. SUM The SUM() function, as the name suggests, gives the total of the selected range of cell values. It performs the mathematical operation which is addition. =SUM(number 1, [number 2],…)
  • 50.
    Excel Formulas andFunctions 2. AVERAGE The AVERAGE() function focuses on calculating the average of the selected range of cell values. =AVERAGE(number 1, [number 2],…)
  • 51.
    Excel Formulas andFunctions 3. COUNT The function COUNT() counts the total number of cells in a range that contains a number. It does not include the cell, which is blank, and the ones that hold data in any other format apart from numeric. =COUNT(value 1, [value 2],…)
  • 52.
    Excel Formulas andFunctions 4. COUNTA The COUNTA() function is a premade function in Excel, which counts cells in a range that has values, both numbers and letters. =COUNTA(value 1, [value 2],…)
  • 53.
    Excel Formulas andFunctions 5. COUNTBLANK The COUNTBLANK() function is a premade function in Excel, which counts blank cells in a range. =COUNTBLANK(range)
  • 54.
    Excel Formulas andFunctions 6. SUBTOTAL The SUBTOTAL() function returns the subtotal in a database. Depending on what you want to select either Average, Count, Sum, Min, Max, and others. =SUBTOTAL(function_num,ref1,[ref2],…) =SUBTOTAL(1,A2:A4)
  • 55.
    Excel Formulas andFunctions 7. MODULUS The MOD() function works on returning the remainder when a particular number is divided by a divisor. =MOD(number,divisor) =MOD(A2,3)
  • 56.
    Excel Formulas andFunctions 8. POWER The function POWER() returns the result of a number raised to a certain power. =POWER(number,power) =POWER(A2,3)
  • 57.
    Excel Formulas andFunctions 9. CEILING The CEILING() function rounds a number up to its nearest multiple significance. =CEILING(number,significance)
  • 58.
    Excel Formulas andFunctions 10. FLOOR Contrary to the Ceiling function, the floor function rounds a number down to the nearest multiple of significance. =FLOOR(number,significance)
  • 59.
    Excel Formulas andFunctions 11. CONCATENATE This function merges or joins several text strings into one text string. =CONCATENATE(text1, [text2],…)
  • 60.
    Excel Formulas andFunctions 12. LEN The function LEN() returns the total number of characters in a string. So, it will count the overall characters, including spaces and special characters. =CONCATENATE(text1, [text2],…)
  • 61.
  • 62.
    Merge and Center •Combineand center the contents of the selected cells in a new larger cell •This is a great way to create labels that spans multiple columns.
  • 63.
    Merge Across •Merge selectedcells in the same row into one larger cell.
  • 64.
    Merge Cell •Merge theselected cells into one cell.
  • 65.
    Split Cells Data >Data Tools > Text to Columns •Split a single column of text into multiple columns. •You can choose how to split it up: fixed width or split at each comma, period, or other character.
  • 66.
  • 67.
  • 68.
  • 69.
  • 70.