
Recommended
More Related Content
What's hot
What's hot (20)
Similar to Project Scheduling Essentials
Similar to Project Scheduling Essentials (20)
More from SN Panigrahi, PMP
More from SN Panigrahi, PMP (20)
Recently uploaded
Recently uploaded (20)
Project Scheduling Essentials
- 1. Start A B F C D E H G End 60 6 4 3 2 3 10 3 2 0 0 4 10 6 9 4 6 9 11 4 7 10 13 13 13 1310 0 00 10 107 3 1311 2 11 11 2882 2 59 733
- 2. 2 SN Panigrahi is a Versatile Practitioner, Strategist, Energetic Coach, Learning Enabler & Public Speaker. He is an International-Corporate Trainer, Mentor & Author He has diverse experience and expertise in Project Management, Contract Management, Supply Chain Management, Procurement, Strategic Sourcing, Global Sourcing, Logistics, Exports & Imports, Indirect Taxes – GST etc. He had done more than 150 Workshops on above Published more than 500 Articles; More than 60 Youtube Presentations He is an Engineer + MBA +PGD ISO 9000 / TQM with around 29 Yrs of Experience He is a certified PMP® from PMI (USA) and become PMI India Champion Also a Certified Lean Six Sigma Green Belt from Exemplar Global Trained in COD for 31/2 Yrs. on Strategy & Leadership GST Certified – MSME – Tech. Dev. Centre (Govt of India) ZED Consultant – Certified by QCI – MSME (Govt of India) Member Board of Studies, IIMM Co-Chairman, Indirect Tax Committee, FTAPCCI Empanelled Faculty in NI MSME He has shared his domain expertise in various forums as a speaker & presented a number of papers in various national and international public forums and received a number of awards for his writings and contribution to business thoughts. SN Panigrahi 9652571117 snpanigrahi1963@gmail.com Hyderabad
- 3. SN Panigrahi
- 5. Project Scheduling is a Mechanism to communicate what tasks need to get done and which organizational resources will be allocated to complete those tasks in what timeframe. A project schedule is a document collecting all the work needed to deliver the project on time. A project is made up of many tasks, and each task is given a start and end (or due date), so it can be completed on time. Likewise, people have different schedules, and their availability and vacation or leave dates need to be documented in order to successfully plan those tasks. Project scheduling occurs during the planning phase of the project. You have to ask yourself three questions to start: 1. What needs to be done? 2. When will it be done? 3. Who will do it? Once you’ve got answers to these questions, then you can begin to plan dates, link activities, set the duration, milestones and resources. SN Panigrahi
- 6. Project Schedul e Manageme nt Estimate Activity Durations Plan Schedule Management Define Activities Develop Schedule Control Schedule Sequence Activities As per PMBOK 6th Edition, there are 6 Process in the Project Scheduling Process of establishing policies, procedures and documentation for managing and controlling project schedule Process that identifies and established the specific activities to be performed to produce project deliverables Process of identifying and documenting sequential relationships among project activities. Process of estimating the number of work periods needed to complete individual activities with estimated resources Process of analyzing activity sequences, durations, resource requirements, and schedule constraints to create the project schedule model. Process of monitoring, managing and documenting changes to the schedule baseline. SN Panigrahi
- 8. SN Panigrahi
- 9. SN Panigrahi
- 10. SN Panigrahi
- 11. Network Techniques PERT PERT was devised in 1958 for the POLARIS missile program by the Program Evaluation Branch of the Special Projects office of the U.S.Navy, helped by the Lockheed Missile Systems division and the Consultant firm of Booz-Allen & Hamilton. The calculations were so arranged so that they could be carried out on the IBM Naval Ordinance Research Computer (NORC) at Dahlgren, Virginia. CPM CPM was the discovery of M.R.Walker of E.I.Du Pont de Nemours & Co. and J.E.Kelly of Remington Rand, circa 1957. The computation was designed for the UNIVAC-I computer. The first test was made in 1958, when CPM was applied to the construction of a new chemical plant. In March 1959, the method was applied to a maintenance shut-down at the Du Pont works in Louisville, Kentucky. Unproductive time was reduced from 125 to 93 hours. Gantt Chart also used in scheduling SN Panigrahi
- 12. BASIS FOR COMPARISON PERT CPM Meaning PERT is a project management technique, used to manage uncertain activities of a project. CPM is a statistical technique of project management that manages well defined activities of a project. What is it? A technique of planning and control of time. A method to control cost and time. Orientation Event-oriented Activity-oriented Evolution Evolved as Research & Development project Evolved as Construction project Model Probabilistic Model Deterministic Model Focuses on Time. Meeting time target is More Important Time-cost trade-off. Minimizing cost is more important Estimates Three time estimates One time estimate Appropriate for High precision time estimate Reasonable time estimate Management of Unpredictable Activities Predictable activities Nature of jobs Non-repetitive nature Repetitive nature Critical and Non-critical activities No differentiation Differentiated Suitable for Research and Development Project Non-research projects like civil construction, ship building etc. Crashing concept Not Applicable Applicable
- 13. Prediction of deliverables Planning resource requirements Controlling resource allocation Internal program review External program review Performance evaluation Uniform wide acceptance SN Panigrahi
- 14. Applicable for any Type of Projects like In construction activities Transportation activities In oil refineries Computer system- For manufacturing electric generator machines Medical and surgical sector Library activities SN Panigrahi
- 15. Reduction in cost Saving of time Determination of activities Elimination of risk in complex activities – Flexibility Evaluation of alternatives- Useful in effective control- Useful in decision making Useful is research work SN Panigrahi
- 16. SN Panigrahi
- 17. Milestone: You will also hear this to as a “PERT event.” A milestone is a specific point in time within a project lifecycle used to measure the progress of a project toward its ultimate goal. With the achievement of successive milestones, management is able to maintain a more accurate understanding of how the project is advancing according to the schedules. Milestones are known as a ‘task of zero duration’ because they represent a particular point of time in a project when an achievement has been reached and uses no time or resources - they do not represent the activities necessary to complete a task. For example, the start milestone indicates the start of the project and the finish milestone marks the completion of the project. Milestones are indicated with circles on the PERT chart. They can either be labeled with numbers or have the actual milestone written inside the circle. Milestones might include, for example: Securing funding. Acquiring a site. Appointing consultants. Completing design stages. Client approvals. Securing permissions. Tendering the construction contract. Appointing a contractor. Handing over the site to the contractor. Starting and completing construction. Occupying the completed development. SN Panigrahi
- 18. A project milestone is a task of zero duration that shows Significant Achievement along a project timeline. The milestones should represent a clear sequence of events that incrementally build up until your project is complete. ... They have zero duration because they symbolize an achievement, or a point of time in a project. Project Milestones are the most visible Indicators of Project Progress. Milestones typically Mark Critical Decision Points, the completion of major project tasks and the ends of various project phases. Research Deliverable - 1 Approval Deliverable - 2 Manufacturin g Deliverable -3 Market Launch Deliverable - 4 Milestone -1 Successful Trial Milestone -2 Marketing Authorization Milestone -3 Products Ready for Marketing Time Lines Total Project Schedule Clinical Trial Applications Start Manufacturing File IP (Patents) Start of Marketing Milestone -4 Launch in New Markets Milestone Example: Pharmaceutical SN Panigrah
- 19. 19 Project Design Deliverable - 2 Financing Deliverable - 3 Placing Contracts Deliverable - 4 Project Execution Deliverable - 5 Milestone -2 Project Design Ready Milestone - 3 Availability of Funds Time Lines Total Project Schedule Example: Commercial Construction Project Project Handover Deliverable - 6 Project Planning Deliverable - 1 Milestone - 4 Contract Finalization Milestone - 5 Project Work Completion Milestone - 6 Project Handover to Customer Milestone - 1 Overall Project Milestones, Timelines, Budgets etc Finalized SN Panigrahi
- 20. 20 A deliverable is a Quantifiable tangible or intangible good or service produced as a result of a project or part of a project that is intended to be delivered to a customer (either internal or external). A deliverable could be a Product, a Part, a Report, a Document, a Software Product, a Server upgrade or any other building block of an overall project. A work breakdown structure is based on these deliverables. Deliverable Quantifiab le Results Tangible or Intangible To be Delivere d To a Customer SN Panigrahi
- 21. Task: This can also be referred to as an activity. Activity : All projects may be viewed as composed of activities. It is the smallest unit of work consuming both time & resources that project manager should schedule & control. Be aware that there are two different types of tasks: Predecessors: Activities that must be completed immediately prior to the start of another activity are called predecessor activities. A Predecessor logically comes before the dependent activity/milestone in a Project Network Diagram. Successors: activities that cannot be started until one or more of other activities are completed but immediately succeed them are called successor activities. A Successor is the dependent activity/milestone. It logically comes after Predecessor(s) in a Project Network Diagram. Concurrent activities: activities that can be accomplished together are known as concurrent activities. Dummy activity: An activity which does not consume any resource but merely depicts the dependence of one activity on other is called dummy activity. It is introduced in a network when two or more parallel activities have the same start and finish nodes. SN Panigrahi
- 22. A work breakdown structure (WBS) is a key project deliverable that organizes the team's work into manageable sections. The Project Management Body of Knowledge (PMBOK) defines the work breakdown structure as a "deliverable oriented hierarchical decomposition of the work to be executed by the project team.“ It is common practice for work breakdown structure elements to be numbered sequentially to reveal the hierarchical structure. The purpose for the numbering is to provide a consistent approach to identifying and managing the WBS across like areas regardless of supplier or trade WBS Coding System Defines: Levels and elements of the WBS Organization elements Work packages Budget and cost information Allows reports to be consolidated at any level in the organization structure The most commonly used scheme in practice is numeric indention. SN Panigrahi
- 23. level 0 level 1 level 2 level 3 level 4 level 5 GAS-STEAM COMBINED POWER PLANT MAIN FUNCTIONS OF PLANT (Control Accounts) Planning Packages GAS – 1.0 INTERFACES – 3.0STEAM – 2.0 TURBINE – 1.1 COMPRESSION STATION – 1.3GENERATOR- 1.2 COMPRESSORS-1.3.1 ENCLOSURE-1.3.3GAS TREATMENT-1.3.2 WORK PACKAGES Major Planning Packages COMPRESSOR 1 1.3.1.1 FOUNDATIONS 1.3.1.3 COMPRESSOR 2 1.3.1.2 DESIGN 1.3.1.2.1 INSTALLATION 1.3.1.2.3 PROCUREMENT 1.3.1.2.2 SN Panigrahi
- 24. Project Construction Work 1.0 Site Preparations 1.1 Mobilization 1.2 Execution 1.3 Pilling 2.0 Pile Caps / Ground Beams 2.1 Cut off Piles & Blinding 2.2 Framework or Rebar 2.3 Concrete 3.0 Structural Steel 3.1 Erect Steel Frame 3.2 Holorib Floors 4.0 External 4.1 Cladding 4.2 Roofing 5.0 Floor Slabs 5.1 Sub-Base & Blinding 5.2 Framework & Concrete 6.0 Brick Works 6.1 External Brickwork 6.2 Internal Brickwork 7.0 M & E Services 7.1 Plumbing 7.2 Electric 7.2.1 Exterior 7.2.2 Internal 7.2.2.1 Wiring 7.2.2.2 Outlets/ Switches 7.2.2.3 Install Fixtures 8.0 Finishes 8.1 Jourey 8.2 Plastering 8.3 Decorating Level 0 Broad Project Level 1 Control Account Level 2 Major Planning Packages Level 4 Work Packages A work package is the lowest component in a work breakdown structure (WBS), sometimes called the terminal element of a WBS. SN Panigrahi
- 25. •Path Convergence: The merging or joining parallel schedule network paths into the same node in a project schedule network diagram. Path convergence is characterized by a schedule activity with more than one predecessor activity. •Path Divergence: Extending or generating parallel schedule network paths from the same node in a project schedule network diagram. Path divergence is characterized by a schedule activity with more than one successor activity. SN Panigrahi
- 26. 26 Project schedule network diagram represents graphically the logical relationships of a set of schedule activities on a network path ie it shows dependencies, duration, and workflow and helps identifying critical paths. There are two network diagram methods : 1.Precedence Diagramming Method (PDM) - activities are shown on nodes also called Activity on Node (AON) 2. Arrow Diagram Method (ADM) - activities are represented as arrows also called Activity on Arrow (AOA) •Precedence Diagramming Method (PDM) is most commonly used SNPanigrahi
- 27. 27 Finish-to-Start (most commonly used~95%) : B can't start before A is finished, or in another words Activity A must be completed before Activity B can begin. Ex: 1.Relay Race 2.Plastering can’t start unless brick wall is completed Start-to-Start : B can't start before A starts or in another words Activity B can start after Activity A has started Ex: Level concrete (successor) cannot begin until pour foundation (predecessor) begins. Finish-to-Finish : B can't finish before A is finished or in another words Activity A must be complete before Activity B can finish Ex : Shooting the film (predecessor) required to finish before editing film (successor) to finish Start-to-Finish (very rarely used) B can't finish before A starts Ex: Start of the new shift of the security guard signal the finish shift of the current security guard. SNPanigrahi
- 28. 28 1. Dependencies can be modified by leads, and lags. Both leads and lags can be applied to all 4 types of dependencies. 2. Network Dependency Types (to be determined during Sequence Activities Process): a. Mandatory Dependency (hard logic): A must be completed before B begins – “MUST HAVE” - legally or contractually or inherent in the nature of work b. Discretionary Dependency (preferred, soft logic): sequence preferred by the organization. May be removed / altered if fast-tracking is required c. External Dependency: dependency required by external organization d. Internal Dependency: precedence relationship usually within the project team’s control SN Panigrahi
- 29. 29 1.Leads: the amount of time whereby a successor activity can be advanced with respect to a predecessor activity. In schedule compression (fast tracking), successor activity begins before end of predecessor. A lead is generally represented as a negative value. For example : FS-2 days, means successor can start 2 days before predecessor finishes. 2. Lags: Waiting Time Between Two Activities - the amount of time whereby a successor activity will be delayed with respect to a predecessor activity - imposed delay to successor activity. A lag is generally represented as a positive value. For example, wait 14 days for concrete to cure (FS +14 days) SNPanigrahi
- 30. Describing the Project Diagraming the Network Estimating the Time of Completion Estimating the Project Schedule Deterministic Estimate Probabilistic Estimate Monitor Project Progress SN Panigrahi
- 31. A project is defined by a set of activities. Each activity is defined by its duration (time to complete the activity) and its predecessors (activities that must be completed before the activity can start). (1) The project is broken down into different activities systematically. The project is subdivided into its constituent tasks. This is usually called a Work Breakdown Structure (WBS), although the Project Management Body of Knowledge (PMBOK) differentiates between a WBS and an Activity List. The WBS is actually a deliverable-oriented subdivision of the work, focusing on the project deliverables rather than strictly tasks to be completed. (2) Activities are arranged in logical sequence. (3) The network diagram is drawn. Events and activities are numbered. (4) Using three times estimate, the expected time for each activity is calculated. (5) Standard deviation and variance for each activity are computed. (6) Earliest starting times and latest finishing times are calculated. (7) Expected time, earliest starting time, and latest finishing times are marked on the network diagram. (8) Slack is calculated. (9) Critical path(s) are identified and marked on the network diagram. (10) Length of critical path or total project duration is found out. (11) Lastly, the probability that the project will finish at due date is calculated. SNPanigrahi
- 32. 32SN Panigrahi
- 33. 33 1. Forward pass is a CPM technique used to determine the early start and early finish for an activity. It involves moving forward through a network diagram to calculate the activity duration. 2. Backward Pass is used to determine the Latest Start Time (LST) for each activity. The latest start time represents the latest time an activity can begin without delaying a project. To perform a Backward Pass, begin at the end of the project and move backward. 3. Dummy Activity - An activity that consumes no time or resources and shows only a dependency 4. Path - A connected sequence of activities leading from the starting event to the ending event 5. Critical Path - is the longest path throughout the project and generally determines the minimum duration to execute the project. 6. There can be more than one critical path, in the network. Then the project become complex. 7. Critical activities (Activities on critical path) have zero float or negative float SN Panigrahi
- 34. •Float (also called as Total float or slack or total slack) is the duration by which an activity can be delayed without delaying the scheduled completion date of the project. •If the ES and LS are identical or LF and EF are identical, then the activity is on the critical path. •ie On a critical path, the total float is zero. A float can be used by the project manager to: •Effectively manage the project •Achieve better allocation of resources For example, if you have a new resource who is still learning and if you feel he will take longer to complete the task, you can allocate him to the activity which has maximum float. Thus, even if the activity is taking longer, it is less likely that the project will be delayed. The amount of float also indicates the time flexibility the project members may have for each activity. Resources from Activities having Float can be Shifted to Critical Path Activities to Minimize the Project Duration. Total float = duration of the critical path – duration of the non-critical path SNPanigrahi
- 35. 35 Free Float (Free Slack) - refers to the amount of time an activity can be delayed without delaying the early start date of the successor activity. 1. Total Float belongs to the project, whereas Free Float belongs to individual activities. 2.Free Float is usually less than or equal to Total Float. 3.Negative float indicates there will be a miss on the project time 4.Negative Float: problem with schedule, need schedule rework Free Float = (ES of Successors) – (EF of Activity in Question) SN Panigrahi
- 36. 36 Total Float Free Float “The amount of time that a schedule activity can be delayed or extended from its early start date without delaying the project finish date or violating a schedule constraint.” “The amount of time that a schedule activity can be delayed without delaying the early start date of any successor or violating a schedule constraint” Calculated at path level of activities Calculated at the activity level Defines flexibility of a path w.r.t project end date Define flexibility of activity w.r.t its successor start Formula LS-ES or LF-EF Formula ES (of successors) – EF of current activity Can come into existence if network diagram has multiple path and there are activities which are not there on Critical Path Can come into existence if successor is having more than one activity converging on it or the successor activity is having a constraint applied SN Panigrahi
- 37. Time: Because the PERT chart is used to help you determine how long a project will take, time is a key element of the chart. The time estimate is often listed below the arrow for each task. The PERT chart comes with four different ways you can estimate the time required for tasks. Optimistic Time (t0 ): It is the estimate of minimum possible time which an activity takes in completion under ideal conditions. Pessimistic Time (tp): The maximum amount of time required to complete a task, when everything goes wrong. Most Likely Time (tm ): Your best guess as to how long it will take to complete a task, when things go exactly as you predicted. •Expected Time (Te): The most realistic estimate of how long a task will take, considering that even the best laid plans don’t always work out. Use the following equation to determine the expected time for a given task: Te = (To + 4Tm + Tp) ÷ 6 Standard Deviation of the time of the time required to complete the project = tp - to 6 SN Panigrahi
- 38. For Example, Construction of a House, has following Timelines Optimistic Time estimate (t0) is 120 days, Most Likely Time estimate (tm ) is 180 days and Pessimistic Time estimate (tp) is 365 days. Te = (120 + 4 x 180 + 365) / 6 = 200.83 days Te = (To + 4Tm + Tp) ÷ 6 Standard Deviation = tp - to 6 = (365-120) / 6 = 40.83 Days This means that the building process is likely to take anywhere from 160 to 241.66 days to complete. Instead of telling the customers that building will take just over 200 days to complete, the contractor can choose to quote them 160 to 241.66 days. Project Duration Range = PERT Estimation + / - S.D. = 200.83 + 40.83 = 160 to 241.66 SN Panigrahi
- 39. 39 Activity Preceding Activity Estimate in Weeks Start 0 D Start 4 A Start 6 F D,A 7 E D 8 G F,E 5 B F 5 H G 7 C H 8 End C,B 0 Find 1. Draw Network Diagram & find Different Paths 2. Find Time Lines of Early Start, Early Finnish, Late Start, Late Finnish for Each Activity 3. Find Critical Path 4. Find Total Float on Paths AFGHC & DFGHC 5. Free Float on Activities E & F SN Panigrahi
- 40. Start D A E F G B H C End 4 6 7 8 5 5 7 8 0 4 4 12 0 6 6 13 13 18 18 25 25 33 13 18 25 33 25 33 25720 25 33251813 18 13 6 13 0 6 000 0 0 1551 1 0 0 0 0 Answer : Network Diagram shown above Paths Duration (Weeks) Critical Path Total Float on Activities E & F Free Float of an Activity Activities E & F DEGHC 32 AFGHC Having Longest Duration Total Float for Activity E = LF-EF or LS-ES = 13-12 0r 5-4 =1 Free Float for Activity E = ES of G (Successor) – EF of E = 13-13 = 0 Means No Free Float DFGHC 31 DFB 16 AFGHC 33 Activity F is on Critical Path. Total Float is 0 (Total Float on Activities on Critical Path is Zero) Activity F is on Critical Path. Free Float is 0 (Free Float on Activities on Critical Path is Zero) AFB 18 Acti vity Precedin g Activity Estima te in Weeks Star t 0 D Start 4 A Start 6 F D,A 7 E D 8 G F,E 5 B F 5 H G 7 C H 8 End C,B 0 SNPanigrahi
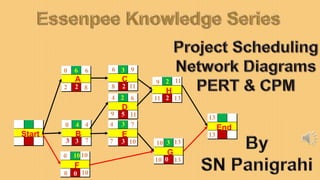
- 41. 41 Activity Duration (weeks) Precedents A Hardware selection 6 B Software design 4 C Install hardware 3 A D Code & test software 2 B E File take-on 3 B F Write user manuals 10 G User training 3 E, F H Install & test system 2 C,D Find 1. Draw Network Diagram & find Different Paths 2. Find Time Lines of Early Start, Early Finnish, Late Start, Late Finnish for Each Activity 3. Find Critical Path 4. Find Total Float on Paths AFGHC & DFGHC 5. Free Float on Activities E & F SN Panigrahi
- 42. 42 Start A B F C D E H G End 60 6 4 3 2 3 10 3 2 0 0 4 10 6 9 4 6 9 11 4 7 10 13 13 13 1310 0 00 10 107 3 1311 2 11 11 2882 2 59 733 Activity Duration (weeks) Prece dents A Hardware selection 6 B Software design 4 C Install hardware 3 A D Code & test software 2 B E File take-on 3 B F Write user manuals 10 G User training 3 E, F H Install & test system 2 C,D Answer : Network Diagram shown above Paths Duration (Weeks) Critical Path Total Float on Activities E & F Free Float of an Activity Activities E & F ACH 11 FG Having Longest Duration Total Float for Activity E = LF-EF or LS-ES = 10-7= or 7-4 =3 Free Float for Activity E = ES of G (Successor) – EF of E = 10-7 = 3 Means Activity E can be Delayed by 3 weeks without Effecting Start of G BDH 8 BEG 10 FG 13 Activity F is on Critical Path. Total Float is 0 (Total Float on Activities on Critical Path is Zero) Activity F is on Critical Path. Free Float is 0 (Free Float on Activities on Critical Path is Zero) SNPanigrahi
- 43. 43 Project Lean Culture Establish Project Value Stream Recognize Value from Customer’s Perspective Do Not Allow Scope Creep Try Schedule Compression Identify & Eliminate Every Waste Possible Abide by Company Policies & Legal / Regulatory Frame Work Involve People Cultivate a Lean Culture SN Panigrahi
- 44. 44 Schedule Compression A Technique used in Project Management to Shorten an already Developed Schedule Done to meet an Update Delivery Date Schedule Shorten to Move to a new Opportunity To Cover up Schedule Delay There are Two Techniques Crashing Crashing assigns more Resources to an activity to decrease the overall time to complete it. The cost benefits of this activity have to be explored in order to make it a useful technique. The trade-off between cost and schedule must be understood to get the best possible schedule compression. Fast Tracking Fast Tracking is the process of executing activities or phases that were originally schedule sequential in parallel. Activities can be overlapped, started earlier than proposed, start activities that require different resources, and maybe combined activities in the schedule. This process does add risk to the schedule and program and must be executed with care. SN Panigrahi
- 45. Clearly defined, independent and stable activities Specified precedence relationships Over emphasis on critical paths Deterministic CPM model Activity time estimates are subjective and depend on judgment PERT assumes a beta distribution for these time estimates, but the actual distribution may be different PERT consistently underestimates the expected project completion time due to alternate paths becoming critical SN Panigrahi
- 46. 46
- 48. 48