Download as PDF, PPTX
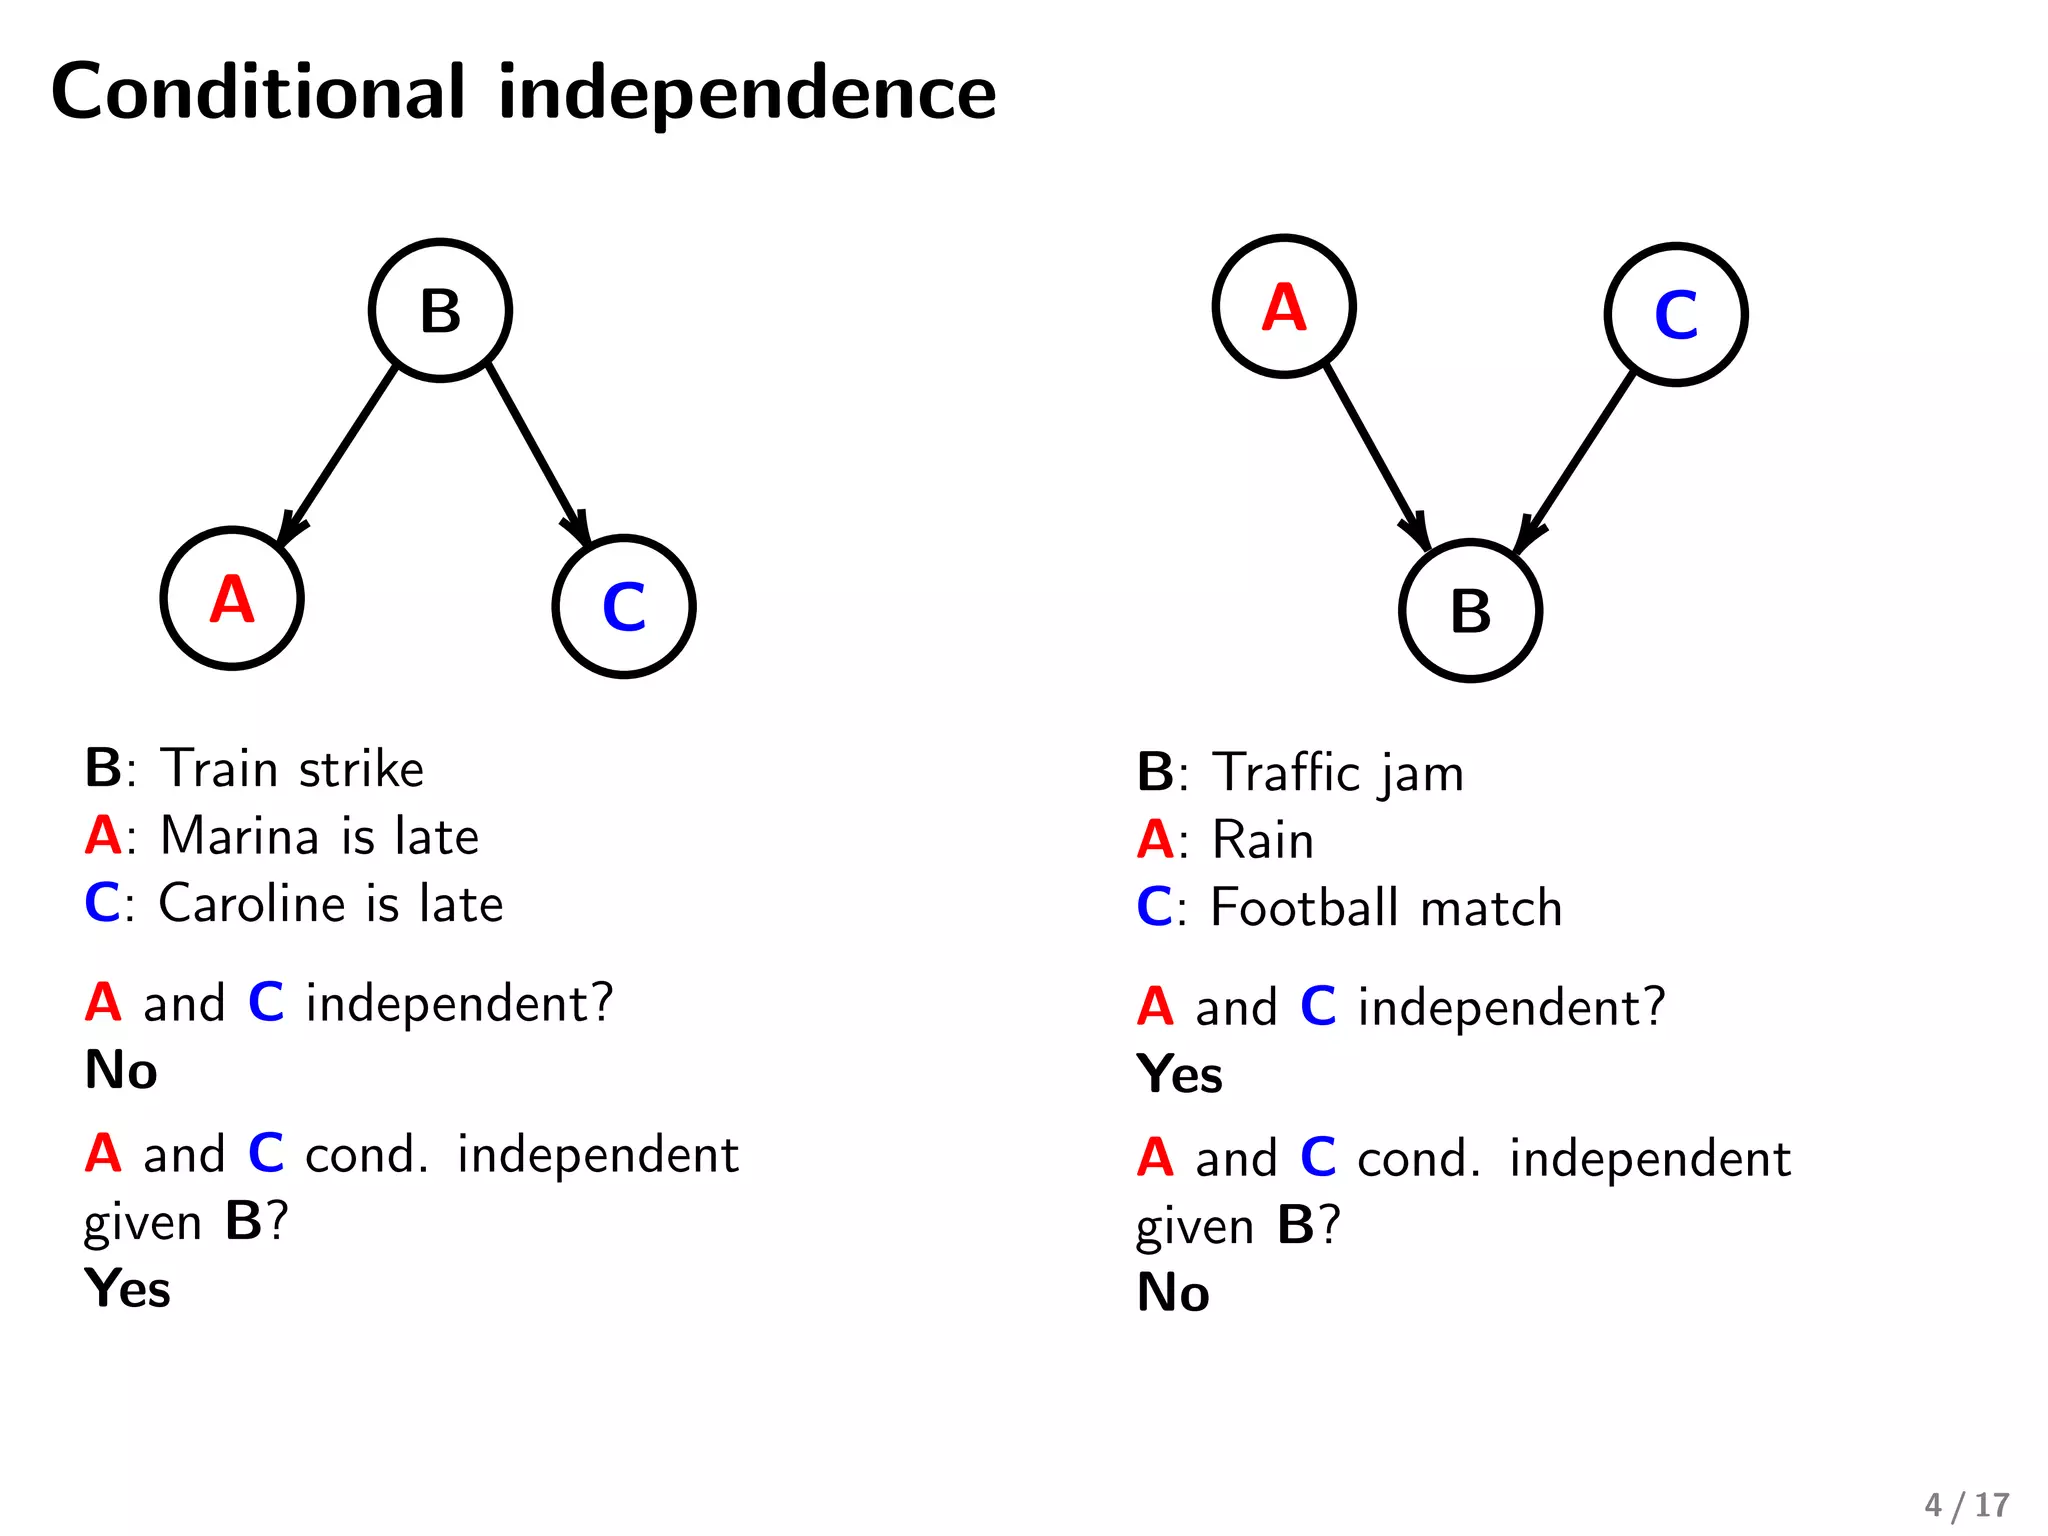
![Why graphical models?
Graphs are a natural way to represent data
Family tree Social network
Gene regulatory
network
Left: Photo of Marie Curie Museum (Muzeum Marii Sklodowskiej-Curie) is courtesy of TripAdvisor. Middle:
https://en.wikipedia.org/wiki/Social graph. Right: Emmert Streib et al. [2014] 2 / 17](https://image.slidesharecdn.com/learningthestructureofggmwithunobservedvariablesmarinavinyes-190606161852/75/Learning-the-structure-of-Gaussian-Graphical-models-with-unobserved-variables-by-Marina-Vinyes-Software-Engineer-in-Machine-Learning-Criteo-2-2048.jpg)

![Previous work
Chandrasekaran et al. [2010]
Since, Σ−1
OO = KOO − UK−1
HHU
Approximation:
ˆΣOO the empirical covariance matrix
ˆΣ−1
OO ≈ sparse + low rank
Formulation:
min
S,L
fnll (S − L) + λ(η S 1 + tr(L))
s.t. S − L 0 L 0
Negative log likelihood fnll (M) := − log det(M) + tr(MΣOO)
Semidefinite program
Limitation:
The low rank component does not recover the connectivity
between latent and observed variables
10 / 17](https://image.slidesharecdn.com/learningthestructureofggmwithunobservedvariablesmarinavinyes-190606161852/75/Learning-the-structure-of-Gaussian-Graphical-models-with-unobserved-variables-by-Marina-Vinyes-Software-Engineer-in-Machine-Learning-Criteo-10-2048.jpg)
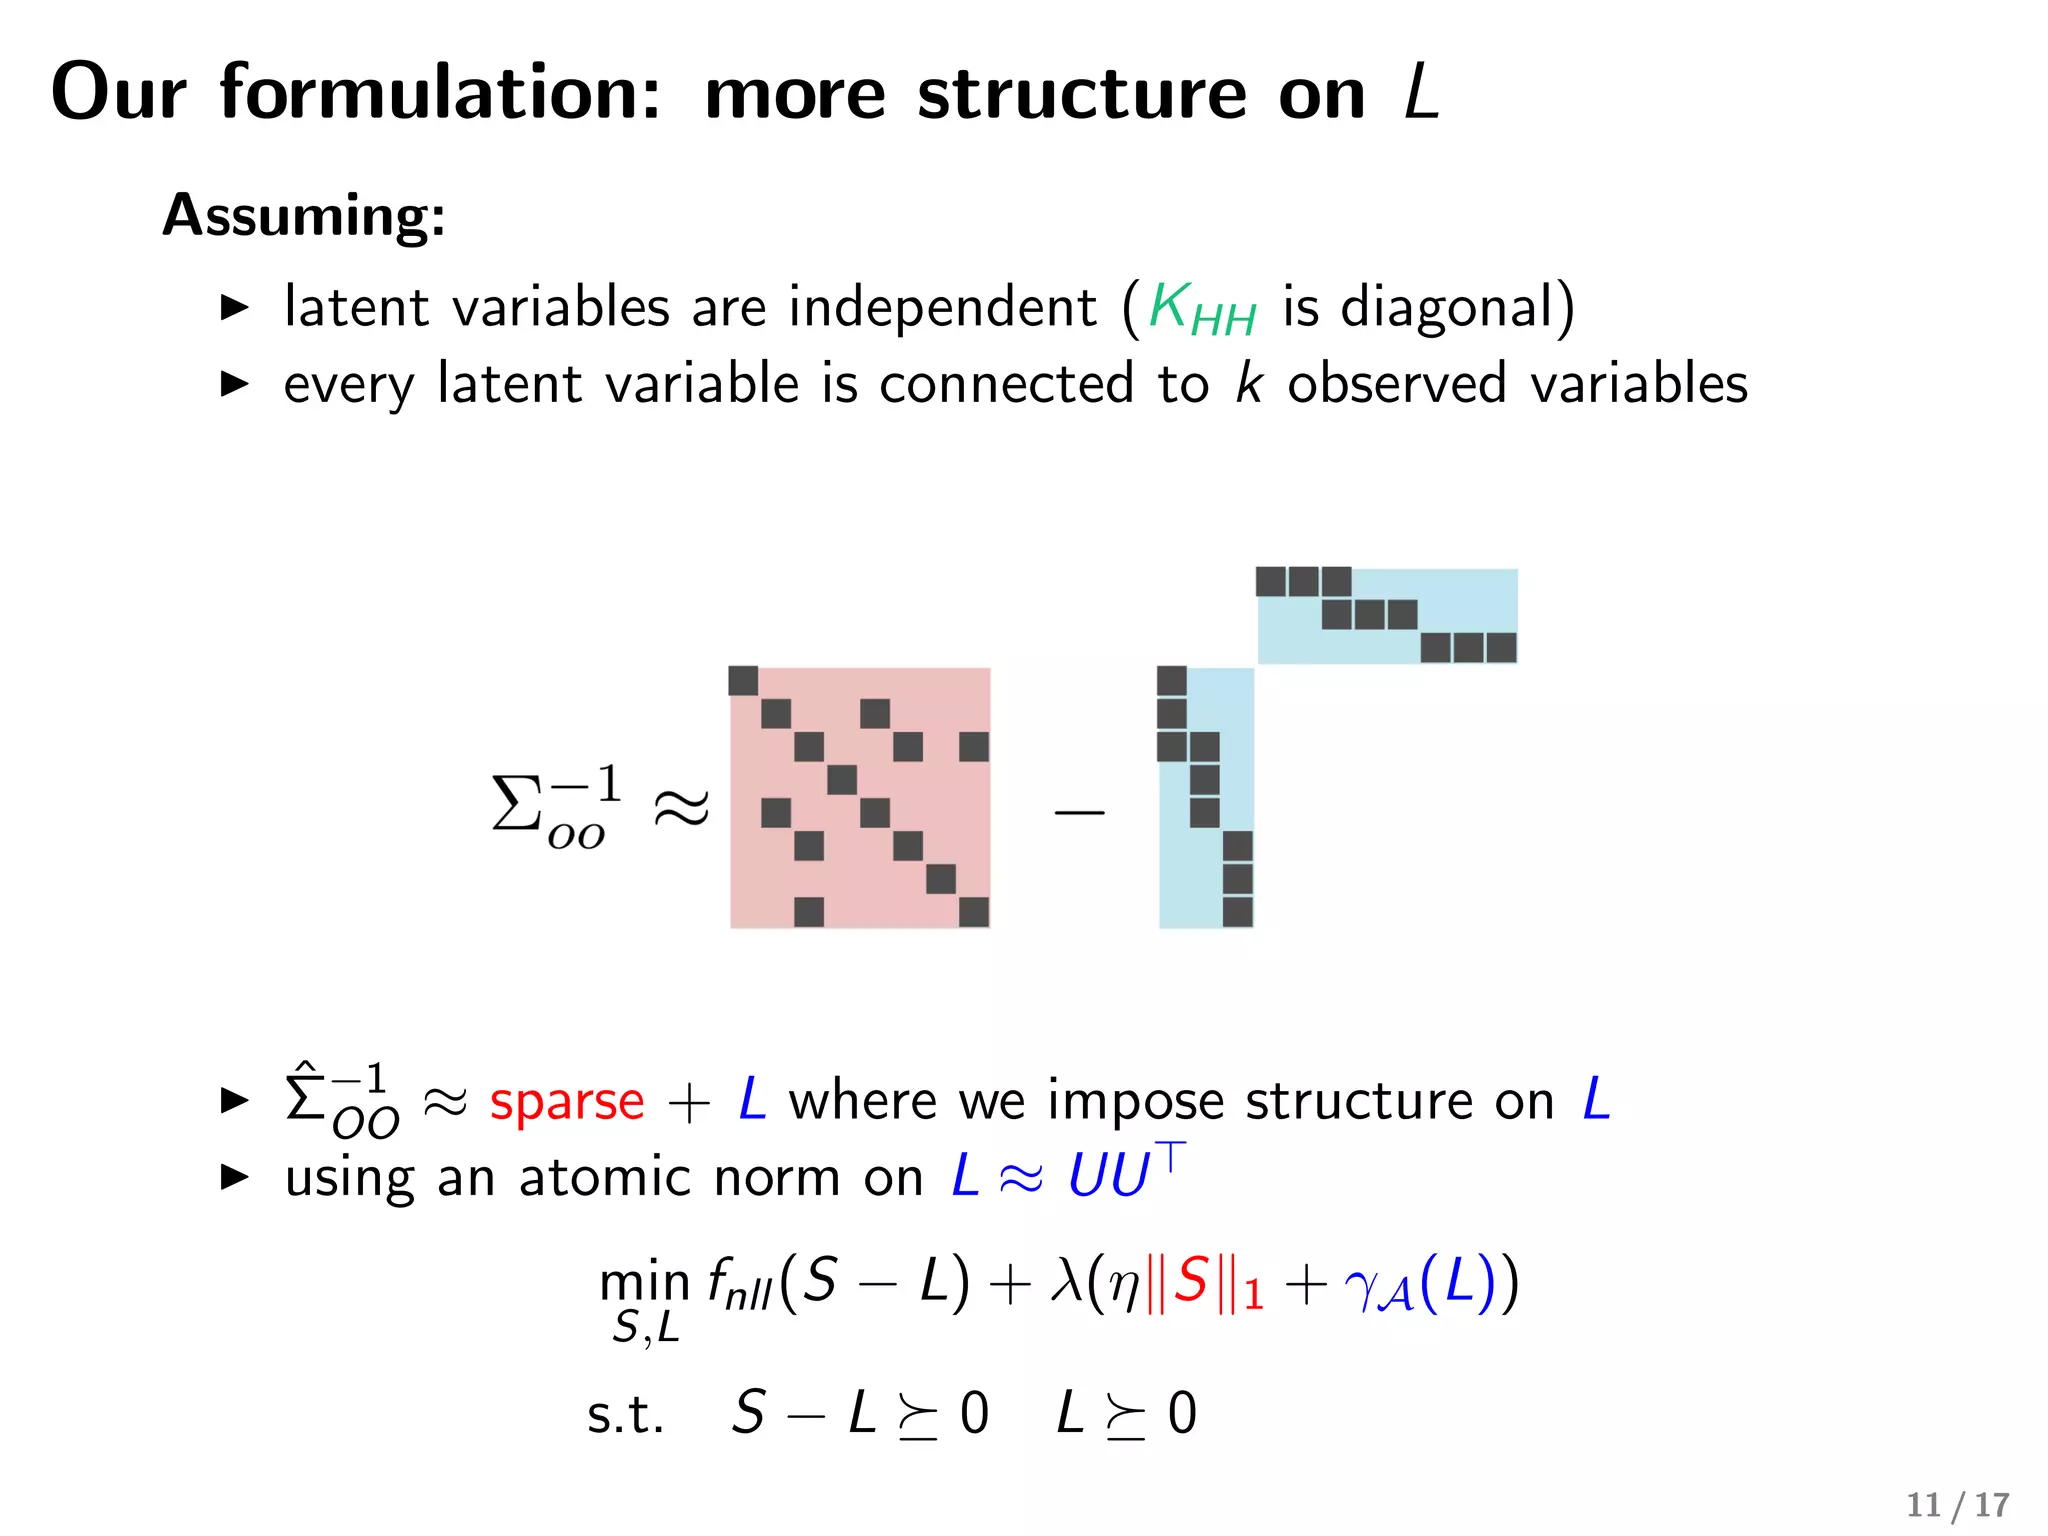
![Our formulation: more structure on L
Σ−1
OO ≈ +s1 u1u1 +s2 +s3u2u2 u3u3
S L1 L2 L3
Atomic norm γA:
Atomic norm for matrices [Richard et al., 2014]
A := {uu | u ∈ Rp
: u 0 ≤ k, u 2 = 1}
12 / 17](https://image.slidesharecdn.com/learningthestructureofggmwithunobservedvariablesmarinavinyes-190606161852/75/Learning-the-structure-of-Gaussian-Graphical-models-with-unobserved-variables-by-Marina-Vinyes-Software-Engineer-in-Machine-Learning-Criteo-12-2048.jpg)


![Atomic norms for leveraging structure
Rockafellar [1970], Chandrasekaran et al. [2012]
Let A be a collection of atoms
x =
a∈A
caa
Atomic norm on A:
γA(x) := inf
c
{
a∈A
ca | ca ≥ 0,
a∈A
caa = x}
Example of trace norm
Matrix M ∈ Rn×p of rank k.
SVD: M = k
i=1 ci ui vi
M tr :=
k
i=1
|ci | = γA(M)
A := set of rank one matrices uv with u 2
2 ≤ 1, v 2
2 ≤ 1 17 / 17](https://image.slidesharecdn.com/learningthestructureofggmwithunobservedvariablesmarinavinyes-190606161852/75/Learning-the-structure-of-Gaussian-Graphical-models-with-unobserved-variables-by-Marina-Vinyes-Software-Engineer-in-Machine-Learning-Criteo-17-2048.jpg)
The document discusses the structure learning of Gaussian graphical models, particularly focusing on cases with unobserved variables and the implications for modeling dependencies. It highlights techniques such as the graphical lasso and introduces a new formulation that imposes structure on latent variable connections. The presentation concludes with insights on convex optimization for graphical model selection and their potential applications in real datasets.