Rameswara Reddy.K.V
1
SimpleAnalogy..
2
• Tell me about your friends(who your
neighbors are) and Iwill tellyou who you are.
Instance-based
Learning
3
Its very similar to a
Desktop!!
KNN–Different names
4
• K-Nearest Neighbors
• Memory-Based Reasoning
• Example-Based Reasoning
• Instance-Based Learning
• LazyLearning
What isKNN?
5
• Apowerful classification algorithm used in pattern
recognition.
• Knearest neighbors stores all available casesand
classifies new casesbasedon asimilarity measure(e.g
distance function)
• Oneof the topdata mining algorithms used today.
• Anon-parametric lazy learning algorithm (AnInstance-
basedLearning method).
Approach
6
• An object (a new instance) is classified bya
majority votes for its neighborclasses.
• The object is assigned to the most common class
amongst its Knearest neighbors.(measured by a
distant function )
7
Distance
Measure
8
Training
Records
Test
Record
Compute
Distance
Choose k of the
“nearest” records
Distancemeasurefor Continuous
Variables
9
DistanceBetweenNeighbors
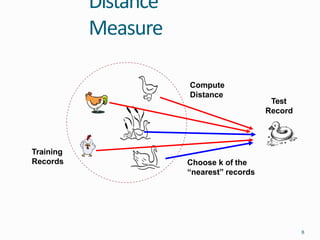
• Calculate the distance between newexample
(E)and all examplesin the trainingset.
• Euclidean distance between two examples.
– X=[x1,x2,x3,..,xn]
– Y=[y1,y2,y3,...,yn]
– TheEuclidean distance between X and Yisdefined
as:
11
n

i1
2
(xi  yi )D(X ,Y ) 
K-NearestNeighborAlgorithm
11
• All the instances correspond to points inan n-dimensional
feature space.
• Eachinstance is represented with aset of numerical
attributes.
• Eachof the training data consists of aset ofvectors and a
classlabel associatedwith eachvector.
• Classification is done by comparing feature vectors of
different Knearestpoints. (K>=2)
• Select the K-nearest examples to Ein the trainingset.
• AssignEto the most common classamong itsK-nearest
neighbors.
3-KNN:Example(1)
12
sqrt [(35-37)2+(35-50)2+(3-
2)2]=15.16
sqrt [(22-37)2+(50-50)2+(2-
2)2]=15
sqrt [(25-37)2+(40-50)2+(4-
2)2]=15.74
?
Distance from John
sqrt [(63-37)2+(200-50)2 +(1-
2)2]=152.23
sqrt [(59-37)2+(170-50)2 +(1-
2)2]=122
Customer Age Income No.
credit
cards
Class
George 35 35K 3 No
Rachel 22 50K 2 Yes
Steve 63 200K 1 No
Tom 59 170K 1 No
Anne 25 40K 4 Yes
John 37 50K 2 YES
Howto chooseK?
13
• If Kis too small it is sensitive tonoise points.
• LargerKworks well. But too large Kmay include majority
points from otherclasses.
• Kvalueshouldbe(K>=2)
X
14
X X X
(a) 1-nearest neighbor (b) 2-nearest neighbor (c) 3-nearest neighbor
K-nearest neighbors of a record x are data points
that have the k smallest distance to x
15
FeatureNormalization
16
• Distance between neighbors could bedominated
by some attributes with relatively largenumbers.
e.g., income of customers in our previousexample.
• Arises when two features are in differentscales.
• Important to normalize thosefeatures.
– Mapping values to numbers between 0 –1.
KNNClassification– Distance
17
Age Loan Default Distance
25 $40,000 N 102000
35 $60,000 N 82000
45 $80,000 N 62000
20 $20,000 N 122000
35 $120,000 N 22000
52 $18,000 N 124000
23 $95,000 Y 47000
40 $62,000 Y 80000
60 $100,000 Y 42000
48 $220,000 Y 78000
33 $150,000 Y 8000
48 $142,000 ?
D  (x  x )2
 (y  y )2
1 2 1 2
StrengthsofKNN
18
• Very simple and intuitive.
• Canbe applied to the data from anydistribution.
• Good classification if the number ofsamples is large enough.
Weaknessesof KNN
• Takesmore time to classify anewexample.
• need to calculate and compare distance from newexample
to all otherexamples.
• Choosing k may be tricky.
• Need large number of samples foraccuracy.
Clustering
 Clustering: the process of grouping a set of objects into classes
of similar objects
 Documents within a cluster should be similar. Documents from
different clusters should be dissimilar.
 The commonest form of unsupervised learning
 Unsupervised learning = learning from raw data, as
opposed to supervised data where a classification of
examples is given.
 in principle, optimal partition achieved via minimising the sum
of squared distance to its “representative object” in each cluster
 Distance measure will determine how the similarity of
two elements is calculated and it will influence the
shape of the clusters.
K Means
 Simply speaking k-means clustering is an algorithm to
classify or to group the objects based on
attributes/features into K number of group.
 K is positive integer number.
 The grouping is done by minimizing the sum of
squares of distances between data and the
corresponding cluster centroid.
 Step 1: Begin with a decision on the value of k =
number of clusters .
 Step 2: Put any initial partition that classifies the
data into k clusters. You may assign the
training samples randomly,or systematically
as the following:
1.Take the first k training sample as single-
element clusters
2. Assign each of the remaining (N-k) training
sample to the cluster with the nearest
centroid. After each assignment, recompute the
centroid of the gaining cluster.
 Step 3: Take each sample in sequence and compute its
distance from the centroid of each of the clusters. If a
sample is not currently in the cluster with the closest
centroid, switch this sample to that cluster and update
the centroid of the cluster gaining the new sample and
the cluster losing the sample.
 Step 4 . Repeat step 3 until convergence is achieved,
that is until a pass through the training sample causes
no new assignments.

Knn 160904075605-converted

  • 1.
  • 2.
    SimpleAnalogy.. 2 • Tell meabout your friends(who your neighbors are) and Iwill tellyou who you are.
  • 3.
  • 4.
    KNN–Different names 4 • K-NearestNeighbors • Memory-Based Reasoning • Example-Based Reasoning • Instance-Based Learning • LazyLearning
  • 5.
    What isKNN? 5 • Apowerfulclassification algorithm used in pattern recognition. • Knearest neighbors stores all available casesand classifies new casesbasedon asimilarity measure(e.g distance function) • Oneof the topdata mining algorithms used today. • Anon-parametric lazy learning algorithm (AnInstance- basedLearning method).
  • 6.
    Approach 6 • An object(a new instance) is classified bya majority votes for its neighborclasses. • The object is assigned to the most common class amongst its Knearest neighbors.(measured by a distant function )
  • 7.
  • 8.
  • 9.
  • 10.
    DistanceBetweenNeighbors • Calculate thedistance between newexample (E)and all examplesin the trainingset. • Euclidean distance between two examples. – X=[x1,x2,x3,..,xn] – Y=[y1,y2,y3,...,yn] – TheEuclidean distance between X and Yisdefined as: 11 n  i1 2 (xi  yi )D(X ,Y ) 
  • 11.
    K-NearestNeighborAlgorithm 11 • All theinstances correspond to points inan n-dimensional feature space. • Eachinstance is represented with aset of numerical attributes. • Eachof the training data consists of aset ofvectors and a classlabel associatedwith eachvector. • Classification is done by comparing feature vectors of different Knearestpoints. (K>=2) • Select the K-nearest examples to Ein the trainingset. • AssignEto the most common classamong itsK-nearest neighbors.
  • 12.
    3-KNN:Example(1) 12 sqrt [(35-37)2+(35-50)2+(3- 2)2]=15.16 sqrt [(22-37)2+(50-50)2+(2- 2)2]=15 sqrt[(25-37)2+(40-50)2+(4- 2)2]=15.74 ? Distance from John sqrt [(63-37)2+(200-50)2 +(1- 2)2]=152.23 sqrt [(59-37)2+(170-50)2 +(1- 2)2]=122 Customer Age Income No. credit cards Class George 35 35K 3 No Rachel 22 50K 2 Yes Steve 63 200K 1 No Tom 59 170K 1 No Anne 25 40K 4 Yes John 37 50K 2 YES
  • 13.
    Howto chooseK? 13 • IfKis too small it is sensitive tonoise points. • LargerKworks well. But too large Kmay include majority points from otherclasses. • Kvalueshouldbe(K>=2) X
  • 14.
  • 15.
    X X X (a)1-nearest neighbor (b) 2-nearest neighbor (c) 3-nearest neighbor K-nearest neighbors of a record x are data points that have the k smallest distance to x 15
  • 16.
    FeatureNormalization 16 • Distance betweenneighbors could bedominated by some attributes with relatively largenumbers. e.g., income of customers in our previousexample. • Arises when two features are in differentscales. • Important to normalize thosefeatures. – Mapping values to numbers between 0 –1.
  • 17.
    KNNClassification– Distance 17 Age LoanDefault Distance 25 $40,000 N 102000 35 $60,000 N 82000 45 $80,000 N 62000 20 $20,000 N 122000 35 $120,000 N 22000 52 $18,000 N 124000 23 $95,000 Y 47000 40 $62,000 Y 80000 60 $100,000 Y 42000 48 $220,000 Y 78000 33 $150,000 Y 8000 48 $142,000 ? D  (x  x )2  (y  y )2 1 2 1 2
  • 18.
    StrengthsofKNN 18 • Very simpleand intuitive. • Canbe applied to the data from anydistribution. • Good classification if the number ofsamples is large enough. Weaknessesof KNN • Takesmore time to classify anewexample. • need to calculate and compare distance from newexample to all otherexamples. • Choosing k may be tricky. • Need large number of samples foraccuracy.
  • 19.
    Clustering  Clustering: theprocess of grouping a set of objects into classes of similar objects  Documents within a cluster should be similar. Documents from different clusters should be dissimilar.  The commonest form of unsupervised learning  Unsupervised learning = learning from raw data, as opposed to supervised data where a classification of examples is given.  in principle, optimal partition achieved via minimising the sum of squared distance to its “representative object” in each cluster
  • 20.
     Distance measurewill determine how the similarity of two elements is calculated and it will influence the shape of the clusters.
  • 22.
  • 23.
     Simply speakingk-means clustering is an algorithm to classify or to group the objects based on attributes/features into K number of group.  K is positive integer number.  The grouping is done by minimizing the sum of squares of distances between data and the corresponding cluster centroid.
  • 24.
     Step 1:Begin with a decision on the value of k = number of clusters .  Step 2: Put any initial partition that classifies the data into k clusters. You may assign the training samples randomly,or systematically as the following: 1.Take the first k training sample as single- element clusters 2. Assign each of the remaining (N-k) training sample to the cluster with the nearest centroid. After each assignment, recompute the centroid of the gaining cluster.
  • 25.
     Step 3:Take each sample in sequence and compute its distance from the centroid of each of the clusters. If a sample is not currently in the cluster with the closest centroid, switch this sample to that cluster and update the centroid of the cluster gaining the new sample and the cluster losing the sample.  Step 4 . Repeat step 3 until convergence is achieved, that is until a pass through the training sample causes no new assignments.