This document provides an introduction to k-means clustering, including:
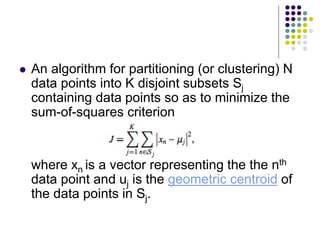
1. K-means clustering aims to partition n observations into k clusters by minimizing the within-cluster sum of squares, where each observation belongs to the cluster with the nearest mean.
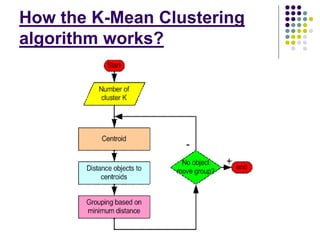
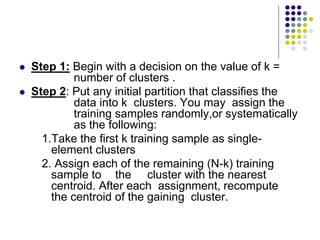
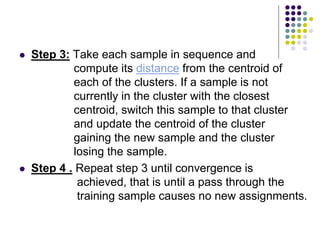
2. The k-means algorithm initializes cluster centroids and assigns observations to the nearest centroid, recomputing centroids until convergence.
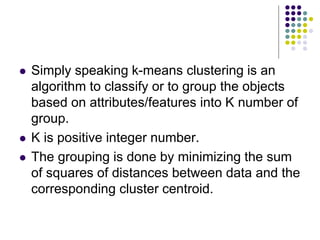
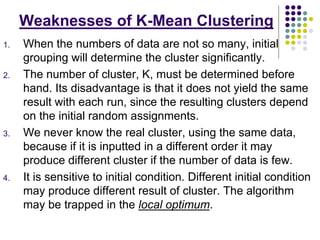
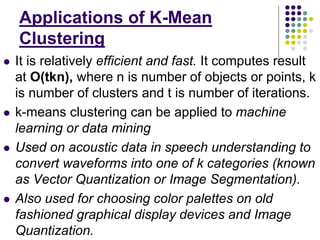
3. K-means clustering is commonly used for applications like machine learning, data mining, and image segmentation due to its efficiency, though it is sensitive to initialization and assumes spherical clusters.