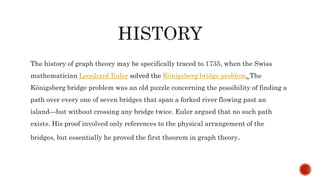
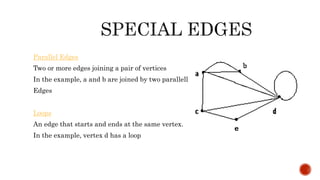
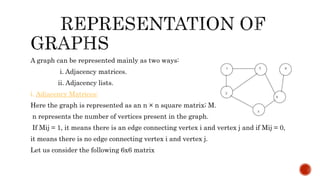
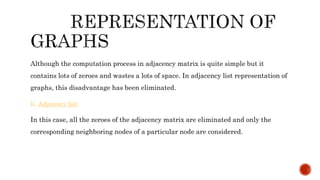
A.SARANYA ,
Assistant professor in Mathematics,
Sri Adi Chunchanagiri women's college,
Cumbum.
 History
 Definition of Graph
 Special Edges
 Types of Edges
 Representation of graphs
 Applications
The history of graph theory may be specifically traced to 1735, when the Swiss
mathematician Leonhard Euler solved the Königsberg bridge problem. The
Königsberg bridge problem was an old puzzle concerning the possibility of finding a
path over every one of seven bridges that span a forked river flowing past an
island—but without crossing any bridge twice. Euler argued that no such path
exists. His proof involved only references to the physical arrangement of the
bridges, but essentially he proved the first theorem in graph theory.
Definition of graph
It is a pair G=(V,E)
where,
V=V(G) = set of vertices
E=E(G)=set of edges
Example:
In the above graph,(right side)
V={A,B,C,D,E}
E={{A,B),(A,C),(C,D),(D,E),(B,D}
Parallel Edges
Two or more edges joining a pair of vertices
In the example, a and b are joined by two parallell
Edges
Loops
An edge that starts and ends at the same vertex.
In the example, vertex d has a loop
Graph can be of two types based upon the type of edges:
i. Directed Edges:
Here the arcs between two vertices have a particular direction; they are directed from one
vertex to another. It is usually represented by an arrow
ii. Undirected Edges:
Here the edges do not have any particular direction from one vertex to another; there is no
difference between the two vertices connected via one undirected edge. It is usually
represented by a straight line.
A graph can be represented mainly as two ways:
i. Adjacency matrices.
ii. Adjacency lists.
i. Adjacency Matrices:
Here the graph is represented as an n × n square matrix; M.
n represents the number of vertices present in the graph.
If Mij = 1, it means there is an edge connecting vertex i and vertex j and if Mij = 0,
it means there is no edge connecting vertex i and vertex j.
Let us consider the following 6x6 matrix
Adjacency matrix and its corresponding graphs
Although the computation process in adjacency matrix is quite simple but it
contains lots of zeroes and wastes a lots of space. In adjacency list representation of
graphs, this disadvantage has been eliminated.
ii. Adjacency list:
In this case, all the zeroes of the adjacency matrix are eliminated and only the
corresponding neighboring nodes of a particular node are considered.
Neighboring nodes of 1: 2, 5.
Neighboring nodes of 2: 1, 3, and 5.
Neighboring nodes of 3: 2, 4.
Neighboring nodes of 4: 3, 5, and 6.
Neighboring nodes of 5: 1, 2, and 4.
Neighboring nodes of 6: 4.
Adjacency list and its corresponding matrix
Here, in adjacency list, all the zeroes of the adjacency matrix are eliminated and the
wastage of space is also being reduced. But the complexity in computation increases
in this case.
Computer Science
 Graphs are used to define the flow of computation.
 Graphs are used to represent networks of communication.
 Graphs are used to represent data organization.
 Graph transformation systems work on rule-based in-memory manipulation of graphs.
Graph databases ensure transaction-safe, persistent storing and querying of graph
structured data.
 Graph theory is used to find shortest path in road or a network.
 In Google Maps, various locations are represented as vertices or nodes and the roads are
represented as edges and graph theory is used to find the shortest path between two nodes.
Physics and Chemistry
 In physics and chemistry, graph theory is used to study molecules.
 The 3D structure of complicated simulated atomic structures can be studied quantitatively
by gathering statistics on graph-theoretic properties related to the topology of the atoms.
 Statistical physics also uses graphs. In this field graphs can represent local connections
between interacting parts of a system, as well as the dynamics of a physical process on
such systems.
 Graphs are also used to express the micro-scale channels of porous media, in which the
vertices represent the pores and the edges represent the smaller channels connecting the
pores.
 Graph is also helpful in constructing the molecular structure as well as lattice of the
molecule. It also helps us to show the bond relation in between atoms and molecules, also
help in comparing structure of one molecule to other.
Computer Network
 In computer network, the relationships among interconnected computers within the
network, follow the principles of graph theory.
 Graph theory is also used in network security.
 We can use the vertex coloring algorithm to find a proper coloring of the map with four
colors.
 Vertex coloring algorithm may be used for assigning at most four different frequencies for
any GSM (Grouped Special Mobile) mobile phone networks.

Graph theory ppt.pptx

  • 1.
    A.SARANYA , Assistant professorin Mathematics, Sri Adi Chunchanagiri women's college, Cumbum.
  • 2.
     History  Definitionof Graph  Special Edges  Types of Edges  Representation of graphs  Applications
  • 3.
    The history ofgraph theory may be specifically traced to 1735, when the Swiss mathematician Leonhard Euler solved the Königsberg bridge problem. The Königsberg bridge problem was an old puzzle concerning the possibility of finding a path over every one of seven bridges that span a forked river flowing past an island—but without crossing any bridge twice. Euler argued that no such path exists. His proof involved only references to the physical arrangement of the bridges, but essentially he proved the first theorem in graph theory.
  • 4.
    Definition of graph Itis a pair G=(V,E) where, V=V(G) = set of vertices E=E(G)=set of edges Example: In the above graph,(right side) V={A,B,C,D,E} E={{A,B),(A,C),(C,D),(D,E),(B,D}
  • 5.
    Parallel Edges Two ormore edges joining a pair of vertices In the example, a and b are joined by two parallell Edges Loops An edge that starts and ends at the same vertex. In the example, vertex d has a loop
  • 6.
    Graph can beof two types based upon the type of edges: i. Directed Edges: Here the arcs between two vertices have a particular direction; they are directed from one vertex to another. It is usually represented by an arrow ii. Undirected Edges: Here the edges do not have any particular direction from one vertex to another; there is no difference between the two vertices connected via one undirected edge. It is usually represented by a straight line.
  • 7.
    A graph canbe represented mainly as two ways: i. Adjacency matrices. ii. Adjacency lists. i. Adjacency Matrices: Here the graph is represented as an n × n square matrix; M. n represents the number of vertices present in the graph. If Mij = 1, it means there is an edge connecting vertex i and vertex j and if Mij = 0, it means there is no edge connecting vertex i and vertex j. Let us consider the following 6x6 matrix
  • 8.
    Adjacency matrix andits corresponding graphs
  • 9.
    Although the computationprocess in adjacency matrix is quite simple but it contains lots of zeroes and wastes a lots of space. In adjacency list representation of graphs, this disadvantage has been eliminated. ii. Adjacency list: In this case, all the zeroes of the adjacency matrix are eliminated and only the corresponding neighboring nodes of a particular node are considered.
  • 10.
    Neighboring nodes of1: 2, 5. Neighboring nodes of 2: 1, 3, and 5. Neighboring nodes of 3: 2, 4. Neighboring nodes of 4: 3, 5, and 6. Neighboring nodes of 5: 1, 2, and 4. Neighboring nodes of 6: 4.
  • 11.
    Adjacency list andits corresponding matrix Here, in adjacency list, all the zeroes of the adjacency matrix are eliminated and the wastage of space is also being reduced. But the complexity in computation increases in this case.
  • 12.
    Computer Science  Graphsare used to define the flow of computation.  Graphs are used to represent networks of communication.  Graphs are used to represent data organization.  Graph transformation systems work on rule-based in-memory manipulation of graphs. Graph databases ensure transaction-safe, persistent storing and querying of graph structured data.  Graph theory is used to find shortest path in road or a network.  In Google Maps, various locations are represented as vertices or nodes and the roads are represented as edges and graph theory is used to find the shortest path between two nodes.
  • 13.
    Physics and Chemistry In physics and chemistry, graph theory is used to study molecules.  The 3D structure of complicated simulated atomic structures can be studied quantitatively by gathering statistics on graph-theoretic properties related to the topology of the atoms.  Statistical physics also uses graphs. In this field graphs can represent local connections between interacting parts of a system, as well as the dynamics of a physical process on such systems.  Graphs are also used to express the micro-scale channels of porous media, in which the vertices represent the pores and the edges represent the smaller channels connecting the pores.
  • 14.
     Graph isalso helpful in constructing the molecular structure as well as lattice of the molecule. It also helps us to show the bond relation in between atoms and molecules, also help in comparing structure of one molecule to other. Computer Network  In computer network, the relationships among interconnected computers within the network, follow the principles of graph theory.  Graph theory is also used in network security.  We can use the vertex coloring algorithm to find a proper coloring of the map with four colors.  Vertex coloring algorithm may be used for assigning at most four different frequencies for any GSM (Grouped Special Mobile) mobile phone networks.