Par 4.1(1)
•
1 like•87 views

The document provides information about sigma notation, approximating the area under a curve using rectangles, and defining the exact area of a plane region. It includes an example of using rectangles with varying widths to better approximate the area under the parabola y=x^2 from 0 to 1. As the number of rectangles increases from 4 to 8 to 50 and 1000, the upper and lower estimates of the area converge, allowing for a more accurate determination of the actual area.

Recommended
More Related Content
What's hot
What's hot (18)
Similar to Par 4.1(1)
Similar to Par 4.1(1) (20)
Recently uploaded
Recently uploaded (20)
Par 4.1(1)
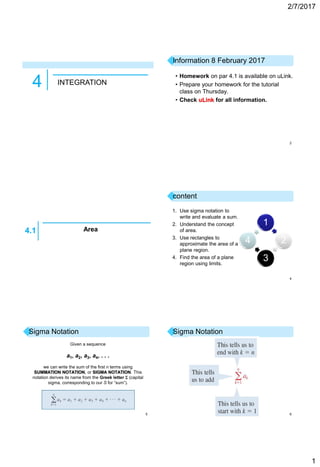
- 1. 2/7/2017 1 4 INTEGRATION 2 Information 8 February 2017 • Homework on par 4.1 is available on uLink. • Prepare your homework for the tutorial class on Thursday. • Check uLink for all information. Area4.1 4 content 1. Use sigma notation to write and evaluate a sum. 2. Understand the concept of area. 3. Use rectangles to approximate the area of a plane region. 4. Find the area of a plane region using limits. 1 2 3 4 5 Sigma Notation Given a sequence a1, a2, a3, a4, . . . we can write the sum of the first n terms using SUMMATION NOTATION, or SIGMA NOTATION. This notation derives its name from the Greek letter (capital sigma, corresponding to our S for “sum”). 6 Sigma Notation
- 2. 2/7/2017 2 7 Additional Example 1 8 Sigma Notation The following properties of sums are natural consequences of properties of the real numbers. 9 Additional Theorem 10 10 Sums of Powers of Integers Sums of Powers of Integers 1 ( 1) 1 2 3 41 2 . n i n n i n 2 2 2 2 2 2 1 ( 1)(2 1) 1 2 3 42. 6 n i n n n i n 2 2 3 3 3 3 3 3 1 ( 1) 1 2 3 43. 4 n i n n i n 2 4 4 4 4 4 4 1 ( 1)(2 1)(3 3 1) 1 2 3 44. 30 n i n n n n n i n 2 2 2 5 5 5 5 5 5 1 ( 1) (2 2 1) 1 2 3 4 1 5 2 . n i n n n n i n 11 Additional Example 2 12 The Area Problem
- 3. 2/7/2017 3 13 The Area Problem We begin by attempting to solve the area problem: Find the area of the region S that lies under the curve y = f(x) from a to b. This means that S, illustrated in Figure 1, is bounded by the graph of a continuous function f [where f(x) 0], the vertical lines x = a and x = b, and the x-axis. Figure 1 14 The Area Problem However, it isn’t so easy to find the area of a region with curved sides. We all have an intuitive idea of what the area of a region is. But part of the area problem is to make this intuitive idea precise by giving an exact definition of area. We first approximate the region S by rectangles and then we take the limit of the areas of these rectangles as we increase the number of rectangles. The next example illustrates the procedure. 15 Additional Example Use rectangles to estimate the area under the parabola y = x2 from 0 to 1 (the parabolic region S illustrated in Figure 3). Figure 3 16 Additional Example - Solution Solution: We first notice that the area of S must be somewhere between 0 and 1 because S is contained in a square with side length 1, but we can certainly do better than that. Suppose we divide S into four strips S1, S2, S3, and S4 by drawing the vertical lines , , and as in Figure 4(a). Figure 4(a) 17 Example 1 – Solution We can approximate each strip by a rectangle whose base is the same as the strip and whose height is the same as the right edge of the strip [see Figure 4(b)]. cont’d Figure 4(b) 18 Additional Example – Solution In other words, the heights of these rectangles are the values of the function f(x) = x2 at the right endpoints of the subintervals , , , and . Each rectangle has width and the heights are and 12. If we let R4 be the sum of the areas of these approximating rectangles, we get cont’d
- 4. 2/7/2017 4 19 Additional Example – Solution From Figure 4(b) we see that the area A of S is less than R4, so cont’d Figure 4(b) 20 Additional Example – Solution Instead of using the rectangles in Figure 4(b) we could use the smaller rectangles in Figure 5 whose heights are the values of f at the left endpoints of the subintervals. (The leftmost rectangle has collapsed because its height is 0.) cont’d Figure 5 21 Additional Example – Solution The sum of the areas of these approximating rectangles is We see that the area of S is larger than L4, so we have lower and upper estimates for A: We can repeat this procedure with a larger number of strips. cont’d 22 Additional Example – Solution Figure 6 shows what happens when we divide the region S into eight strips of equal width. cont’d (a) Using left endpoints (b) Using right endpoints Approximating S with eight rectangles Figure 6 23 Additional Example – Solution By computing the sum of the areas of the smaller rectangles (L8) and the sum of the areas of the larger rectangles (R8), we obtain better lower and upper estimates for A: So one possible answer to the question is to say that the true area of S lies somewhere between 0.2734375 and 0.3984375. We could obtain better estimates by increasing the number of strips. cont’d 24 Additional Example – Solution The following table shows the results of similar calculations (with a computer) using n rectangles whose heights are found with left endpoints (Ln) or right endpoints (Rn). cont’d
- 5. 2/7/2017 5 25 Additional Example – Solution In particular, we see by using 50 strips that the area lies between 0.3234 and 0.3434. With 1000 strips we narrow it down even more: A lies between 0.3328335 and 0.3338335. A good estimate is obtained by averaging these numbers: A 0.3333335 cont’d 26 Additional Example 27 Definition of the Area of a Region in the Plane 28 Additional Example