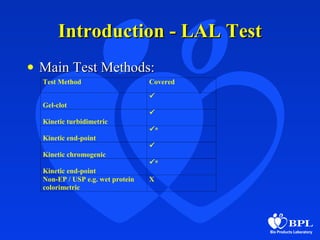
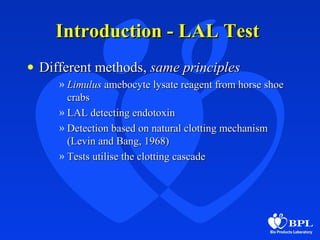
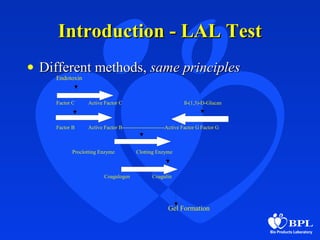
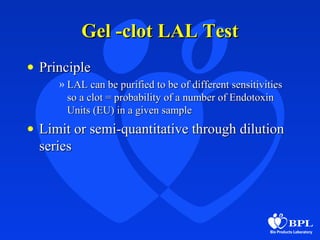
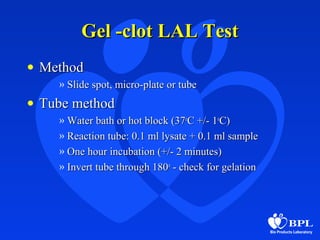
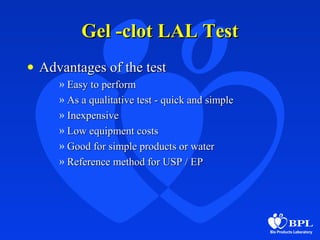
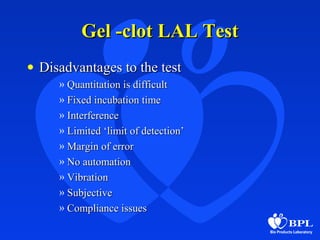
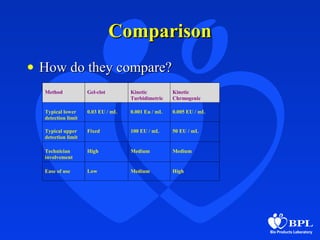
The document discusses three main methods for the bacterial endotoxin test - gel clot, turbidimetric, and chromogenic. The gel clot method is the simplest but least quantitative, while turbidimetric and chromogenic methods allow for more automation and precision using spectrophotometry. All three methods use Limulus amebocyte lysate and detect endotoxins through coagulation reactions. The choice of method depends on factors like testing volumes, sample properties, required sensitivity, and compliance needs. Photometric methods have advantages of automation and precision but higher costs, while gel clot is inexpensive but less quantitative.
Endotoxin Testing is performed to ensure that injectable preparations and medical devices are free from pyrogens and safe for human use.
Pyrogens constitute a heterogeneous group of fever causing substances which comprise both microbial and non-microbial substances. The most potent and most widely known are the endotoxins or lipopolysaccharides (LPS), which are cell wall components of gram-negative bacteria. Gram-positive bacteria are also sources of pyrogens, in particular lipoteichoic acid (LTA), as are particles from yeasts and viruses. Non-microbial pyrogens often emanate from production environments. Small particles of packaging materials are a typical example.
Sterility Testing is defined as a testing which confirms that products are free from the presence of viable microorganisms. Sterility testing is very important for medical devices, pharmaceuticals, preparations, tissue materials and other materials that claim to be sterile or free from viable microorganisms.
دورة مختصرة عن المعمل الميكروبيولوجى ودوره فى شركات ومصانع الادوية
المحتوى :
- Introduction to Microbiology
- Microbiology lab. Overview
- Microbiology Lab. Role
- Pharmaceutical Microbiology
- Microbiological tests for pharmaceuticals
الميكروبيولوجى ببساطة
Limit tests are quantitative or semi-quantitative tests designed to identify and control small quantities of impurity, which are likely to be present in the substance. The quantity of any one impurity in an official substance is often small, and consequently the visible reaction response to any test for that impurity is also small. The design of individual tests is therefore important if errors are to be avoided in the hands of different operators.
Microbiologists carry out a lot of environmental montoring, but is this sufficiently focused? Are too many samples taken? Are samples taken in the wrong locations or at the wrong frequency? Some ideas are presented.
Overview of the key requirements ofelectronic data management systems in relation to pharmaceuticals and healthcare facilities. This includes the importance of computerised systems controls and defenitions of data. The presentation includes the importance of validation and quality assurance aspects.
Risk management tools and techniques for environmental monitoring:
Application of HACCP for selecting environmental monitoring locations; Use of risk filtering to determine frequencies of monitoring ; Applying FMEA to assess risks from process equipment – a sterility testing isolator.
Overview of the apporach to non-compliances and related matters. Appropriate training for analysts on how to perform the tests and steps to take when obtaining OOS results should be implemented . The use of root cause analysis tools when finding an OOS should also be available for review.
Introduction – the ‘great’ myths
Colony Forming Units – what are they?
Microbiology laboratory cabinets – always work?
Media growth promotion – can it be skipped?
Microbial distribution in cleanrooms – free floating?
Environmental monitoring parameters – can they be pre-set?
Bunsen burners needed to create aseptic space– or not?
Identification results– always believable?
Application of FMEA to a Sterility Testing Isolator: A Case StudyTim Sandle, Ph.D.
Presentation on Failure Modes and Effects Analysis, in the pharmaceutical context. Covering:
Introduction to risk assessment
What are risks?
Advantages and disadvantages of FMEA
Applying FMEA to review a sterility testing isolator – case study
Pharmaceutical Microbiology: Current and Future Challenges Tim Sandle, Ph.D.
The changing environment for pharmaceutical microbiology
Limitations of methods
Need for new (rapid) methods
Separating people form processes
Single-use technologies
Environmental monitoring programme
Best practices
Rapid methods
Contamination control strategy
Objectionable organisms
Burkholderia cepacia complex
Why use reference materials?
The importance of reference materials
Different categories of reference materials.
Different classes of reference materials.
Standards for reference materials.
How reference materials are prepared and assessed.
How reference materials are used.
GxP is a general abbreviation for the "good practice" quality guidelines and regulations. These slides provide an overview of current regulations, with a focus on pharmaceuticals and healthcare.
What is likely to go into the revised Annex 1, including:
Terminal sterilisation vs aseptic processing
WFI produced by reverse osmosis
Guidance for media simulation trials
This remains speculative
Key question:
Could the plague ever re-emerge on a similar level in the twenty-first century?
Due to the potential seriousness of the disease this is a subject worthy of epidemiological consideration and research.
The two most commonly used within microbiology are
HACCP (which originated in the food industry) and FMEA
(developed for engineering). This article explores these two
approaches, first with a description of HACCP, followed by a
description and case study of FMEA in sterility testing.
Considering: Environmental monitoring guidance, Background to USP <1116>, Main changes and debates Method limitations, Incident rates, Frequencies of monitoring, Locations of monitoring, Other changes, Regulatory issues and Rapid methods
An introduction to the international cleanroom standard ISO 14644 and the 2015 revisions to Parts 1 and 2. The focus is on particulate and contamination control.
Multi-source connectivity as the driver of solar wind variability in the heli...Sérgio Sacani
The ambient solar wind that flls the heliosphere originates from multiple
sources in the solar corona and is highly structured. It is often described
as high-speed, relatively homogeneous, plasma streams from coronal
holes and slow-speed, highly variable, streams whose source regions are
under debate. A key goal of ESA/NASA’s Solar Orbiter mission is to identify
solar wind sources and understand what drives the complexity seen in the
heliosphere. By combining magnetic feld modelling and spectroscopic
techniques with high-resolution observations and measurements, we show
that the solar wind variability detected in situ by Solar Orbiter in March
2022 is driven by spatio-temporal changes in the magnetic connectivity to
multiple sources in the solar atmosphere. The magnetic feld footpoints
connected to the spacecraft moved from the boundaries of a coronal hole
to one active region (12961) and then across to another region (12957). This
is refected in the in situ measurements, which show the transition from fast
to highly Alfvénic then to slow solar wind that is disrupted by the arrival of
a coronal mass ejection. Our results describe solar wind variability at 0.5 au
but are applicable to near-Earth observatories.
Earliest Galaxies in the JADES Origins Field: Luminosity Function and Cosmic ...Sérgio Sacani
We characterize the earliest galaxy population in the JADES Origins Field (JOF), the deepest
imaging field observed with JWST. We make use of the ancillary Hubble optical images (5 filters
spanning 0.4−0.9µm) and novel JWST images with 14 filters spanning 0.8−5µm, including 7 mediumband filters, and reaching total exposure times of up to 46 hours per filter. We combine all our data
at > 2.3µm to construct an ultradeep image, reaching as deep as ≈ 31.4 AB mag in the stack and
30.3-31.0 AB mag (5σ, r = 0.1” circular aperture) in individual filters. We measure photometric
redshifts and use robust selection criteria to identify a sample of eight galaxy candidates at redshifts
z = 11.5 − 15. These objects show compact half-light radii of R1/2 ∼ 50 − 200pc, stellar masses of
M⋆ ∼ 107−108M⊙, and star-formation rates of SFR ∼ 0.1−1 M⊙ yr−1
. Our search finds no candidates
at 15 < z < 20, placing upper limits at these redshifts. We develop a forward modeling approach to
infer the properties of the evolving luminosity function without binning in redshift or luminosity that
marginalizes over the photometric redshift uncertainty of our candidate galaxies and incorporates the
impact of non-detections. We find a z = 12 luminosity function in good agreement with prior results,
and that the luminosity function normalization and UV luminosity density decline by a factor of ∼ 2.5
from z = 12 to z = 14. We discuss the possible implications of our results in the context of theoretical
models for evolution of the dark matter halo mass function.
THE IMPORTANCE OF MARTIAN ATMOSPHERE SAMPLE RETURN.Sérgio Sacani
The return of a sample of near-surface atmosphere from Mars would facilitate answers to several first-order science questions surrounding the formation and evolution of the planet. One of the important aspects of terrestrial planet formation in general is the role that primary atmospheres played in influencing the chemistry and structure of the planets and their antecedents. Studies of the martian atmosphere can be used to investigate the role of a primary atmosphere in its history. Atmosphere samples would also inform our understanding of the near-surface chemistry of the planet, and ultimately the prospects for life. High-precision isotopic analyses of constituent gases are needed to address these questions, requiring that the analyses are made on returned samples rather than in situ.
Cancer cell metabolism: special Reference to Lactate PathwayAADYARAJPANDEY1
Normal Cell Metabolism:
Cellular respiration describes the series of steps that cells use to break down sugar and other chemicals to get the energy we need to function.
Energy is stored in the bonds of glucose and when glucose is broken down, much of that energy is released.
Cell utilize energy in the form of ATP.
The first step of respiration is called glycolysis. In a series of steps, glycolysis breaks glucose into two smaller molecules - a chemical called pyruvate. A small amount of ATP is formed during this process.
Most healthy cells continue the breakdown in a second process, called the Kreb's cycle. The Kreb's cycle allows cells to “burn” the pyruvates made in glycolysis to get more ATP.
The last step in the breakdown of glucose is called oxidative phosphorylation (Ox-Phos).
It takes place in specialized cell structures called mitochondria. This process produces a large amount of ATP. Importantly, cells need oxygen to complete oxidative phosphorylation.
If a cell completes only glycolysis, only 2 molecules of ATP are made per glucose. However, if the cell completes the entire respiration process (glycolysis - Kreb's - oxidative phosphorylation), about 36 molecules of ATP are created, giving it much more energy to use.
IN CANCER CELL:
Unlike healthy cells that "burn" the entire molecule of sugar to capture a large amount of energy as ATP, cancer cells are wasteful.
Cancer cells only partially break down sugar molecules. They overuse the first step of respiration, glycolysis. They frequently do not complete the second step, oxidative phosphorylation.
This results in only 2 molecules of ATP per each glucose molecule instead of the 36 or so ATPs healthy cells gain. As a result, cancer cells need to use a lot more sugar molecules to get enough energy to survive.
introduction to WARBERG PHENOMENA:
WARBURG EFFECT Usually, cancer cells are highly glycolytic (glucose addiction) and take up more glucose than do normal cells from outside.
Otto Heinrich Warburg (; 8 October 1883 – 1 August 1970) In 1931 was awarded the Nobel Prize in Physiology for his "discovery of the nature and mode of action of the respiratory enzyme.
WARNBURG EFFECT : cancer cells under aerobic (well-oxygenated) conditions to metabolize glucose to lactate (aerobic glycolysis) is known as the Warburg effect. Warburg made the observation that tumor slices consume glucose and secrete lactate at a higher rate than normal tissues.
Slide 1: Title Slide
Extrachromosomal Inheritance
Slide 2: Introduction to Extrachromosomal Inheritance
Definition: Extrachromosomal inheritance refers to the transmission of genetic material that is not found within the nucleus.
Key Components: Involves genes located in mitochondria, chloroplasts, and plasmids.
Slide 3: Mitochondrial Inheritance
Mitochondria: Organelles responsible for energy production.
Mitochondrial DNA (mtDNA): Circular DNA molecule found in mitochondria.
Inheritance Pattern: Maternally inherited, meaning it is passed from mothers to all their offspring.
Diseases: Examples include Leber’s hereditary optic neuropathy (LHON) and mitochondrial myopathy.
Slide 4: Chloroplast Inheritance
Chloroplasts: Organelles responsible for photosynthesis in plants.
Chloroplast DNA (cpDNA): Circular DNA molecule found in chloroplasts.
Inheritance Pattern: Often maternally inherited in most plants, but can vary in some species.
Examples: Variegation in plants, where leaf color patterns are determined by chloroplast DNA.
Slide 5: Plasmid Inheritance
Plasmids: Small, circular DNA molecules found in bacteria and some eukaryotes.
Features: Can carry antibiotic resistance genes and can be transferred between cells through processes like conjugation.
Significance: Important in biotechnology for gene cloning and genetic engineering.
Slide 6: Mechanisms of Extrachromosomal Inheritance
Non-Mendelian Patterns: Do not follow Mendel’s laws of inheritance.
Cytoplasmic Segregation: During cell division, organelles like mitochondria and chloroplasts are randomly distributed to daughter cells.
Heteroplasmy: Presence of more than one type of organellar genome within a cell, leading to variation in expression.
Slide 7: Examples of Extrachromosomal Inheritance
Four O’clock Plant (Mirabilis jalapa): Shows variegated leaves due to different cpDNA in leaf cells.
Petite Mutants in Yeast: Result from mutations in mitochondrial DNA affecting respiration.
Slide 8: Importance of Extrachromosomal Inheritance
Evolution: Provides insight into the evolution of eukaryotic cells.
Medicine: Understanding mitochondrial inheritance helps in diagnosing and treating mitochondrial diseases.
Agriculture: Chloroplast inheritance can be used in plant breeding and genetic modification.
Slide 9: Recent Research and Advances
Gene Editing: Techniques like CRISPR-Cas9 are being used to edit mitochondrial and chloroplast DNA.
Therapies: Development of mitochondrial replacement therapy (MRT) for preventing mitochondrial diseases.
Slide 10: Conclusion
Summary: Extrachromosomal inheritance involves the transmission of genetic material outside the nucleus and plays a crucial role in genetics, medicine, and biotechnology.
Future Directions: Continued research and technological advancements hold promise for new treatments and applications.
Slide 11: Questions and Discussion
Invite Audience: Open the floor for any questions or further discussion on the topic.
Mammalian Pineal Body Structure and Also Functions
Lal presentation
1. LAL: Choice of Test MethodLAL: Choice of Test Method
ByBy
Tim SandleTim Sandle
Bio Products LaboratoryBio Products Laboratory
2. IntroductionIntroduction
• How did we get here?How did we get here?
• Main test methods - Gel-Clot, TurbidimetricMain test methods - Gel-Clot, Turbidimetric
and Chromogenicand Chromogenic
• Advantages and disadvantages of eachAdvantages and disadvantages of each
methodmethod
• Comparison between the main methodsComparison between the main methods
3. Introduction - LAL TestIntroduction - LAL Test
• LAL Test - for performing BETLAL Test - for performing BET
• Alternative to Pyrogen (Rabbit) duringAlternative to Pyrogen (Rabbit) during
1980s1980s
• USP 1980; FDA Guide 1987; Ph. Eur.USP 1980; FDA Guide 1987; Ph. Eur.
1988; BP 1989 (Gel-clot test)1988; BP 1989 (Gel-clot test)
• To meet the requirements for the BacterialTo meet the requirements for the Bacterial
Endotoxin Test in Ph. Eur. 2.6.14 /Endotoxin Test in Ph. Eur. 2.6.14 /
USP <85>USP <85>
4. Introduction - LAL TestIntroduction - LAL Test
• Main Test Methods:Main Test Methods:
Test Method Covered
Gel-clot
Kinetic turbidimetric
Kinetic end-point
*
Kinetic chromogenic
Kinetic end-point
*
Non-EP / USP e.g. wet protein
colorimetric
X
5. Introduction - LAL TestIntroduction - LAL Test
• Different methods,Different methods, same principlessame principles
» LimulusLimulus amebocyte lysate reagent from horse shoeamebocyte lysate reagent from horse shoe
crabscrabs
» LAL detecting endotoxinLAL detecting endotoxin
» Detection based on natural clotting mechanismDetection based on natural clotting mechanism
(Levin and Bang, 1968)(Levin and Bang, 1968)
» Tests utilise the clotting cascadeTests utilise the clotting cascade
6. Introduction - LAL TestIntroduction - LAL Test
• Different methods,Different methods, same principlessame principles
Endotoxin
Factor C Active Factor C ß-(1,3)-D-Glucan
Factor B Active Factor B------------------------Active Factor G Factor G
Proclotting Enzyme Clotting Enzyme
Coagulogen Coagulin
Gel Formation
7. Gel -clot LAL TestGel -clot LAL Test
• PrinciplePrinciple
» LAL can be purified to be of different sensitivitiesLAL can be purified to be of different sensitivities
so a clot = probability of a number of Endotoxinso a clot = probability of a number of Endotoxin
Units (EU) in a given sampleUnits (EU) in a given sample
• Limit or semi-quantitative through dilutionLimit or semi-quantitative through dilution
seriesseries
8. Gel -clot LAL TestGel -clot LAL Test
• MethodMethod
» Slide spot, micro-plate or tubeSlide spot, micro-plate or tube
• Tube methodTube method
» Water bath or hot block (37Water bath or hot block (37oo
C +/- 1C +/- 1oo
C)C)
» Reaction tube: 0.1 ml lysate + 0.1 ml sampleReaction tube: 0.1 ml lysate + 0.1 ml sample
» One hour incubation (+/- 2 minutes)One hour incubation (+/- 2 minutes)
» Invert tube through 180Invert tube through 180oo
- check for gelation- check for gelation
9. Gel -clot LAL TestGel -clot LAL Test
• EP / USP testingEP / USP testing
– More complicatedMore complicated
» Positive controlsPositive controls
» Negative controlsNegative controls
» Endotoxin standard curve (confirm label claim)Endotoxin standard curve (confirm label claim)
» Positive product controls (spiked samples)Positive product controls (spiked samples)
» Semi-quantitative through two-fold dilutionsSemi-quantitative through two-fold dilutions
10. Gel -clot LAL TestGel -clot LAL Test
• Advantages of the testAdvantages of the test
» Easy to performEasy to perform
» As a qualitative test - quick and simpleAs a qualitative test - quick and simple
» InexpensiveInexpensive
» Low equipment costsLow equipment costs
» Good for simple products or waterGood for simple products or water
» Reference method for USP / EPReference method for USP / EP
11. Gel -clot LAL TestGel -clot LAL Test
• Disadvantages to the testDisadvantages to the test
» Quantitation is difficultQuantitation is difficult
» Fixed incubation timeFixed incubation time
» InterferenceInterference
» Limited ‘limit of detection’Limited ‘limit of detection’
» Margin of errorMargin of error
» No automationNo automation
» VibrationVibration
» SubjectiveSubjective
» Compliance issuesCompliance issues
12. Photometric methodsPhotometric methods
• Turbidimetric and ChromogenicTurbidimetric and Chromogenic
TechniquesTechniques
• Many similaritiesMany similarities
» Use spectrophotometryUse spectrophotometry
» Use a standard curve (r = 0.980)Use a standard curve (r = 0.980)
» Increased throughputIncreased throughput
» Wider ranges of quantitationWider ranges of quantitation
» As kinetic methods - single stepsAs kinetic methods - single steps
» Reduced margins of errorReduced margins of error
13. Turbidimetric LAL TestTurbidimetric LAL Test
• Principle:Principle:
» Links the rate of gelation (as turbidity) to determineLinks the rate of gelation (as turbidity) to determine
endotoxin contentendotoxin content
» Plotting turbidity (optical density) against endotoxinPlotting turbidity (optical density) against endotoxin
concentration from a series of standardsconcentration from a series of standards
• End-point or kinetic methodEnd-point or kinetic method
14. Turbidimetric LAL TestTurbidimetric LAL Test
• MethodMethod
» Heated plate reader or heated tube reader (37Heated plate reader or heated tube reader (37oo
CC
+/-1+/-1oo
C)C)
» SpectrophotometerSpectrophotometer
» Computer softwareComputer software
» Lysate sensitivity determined via curveLysate sensitivity determined via curve
15. Turbidimetric LAL TestTurbidimetric LAL Test
• Advantages of the testAdvantages of the test
» Real time measurementReal time measurement
» Results can be ‘seen’Results can be ‘seen’
» Reading is automated: objectivityReading is automated: objectivity
» SoftwareSoftware
» Less dilutions cf Gel-clot (in-use costs)Less dilutions cf Gel-clot (in-use costs)
» Over-coming interferenceOver-coming interference
16. Turbidimetric LAL TestTurbidimetric LAL Test
• Disadvantages of the testDisadvantages of the test
» Turbid samplesTurbid samples
» Samples with precipitationSamples with precipitation
» Some biologicalsSome biologicals
» Equipment costEquipment cost
» Vibration, bubbles and background noiseVibration, bubbles and background noise
» Technician expertiseTechnician expertise
17. Chromogenic LAL testChromogenic LAL test
• PrinciplePrinciple
» Uses the clotting cascade, but in a modified wayUses the clotting cascade, but in a modified way
» Synthetic chromogenic substrate - pNA - in theSynthetic chromogenic substrate - pNA - in the
presence of LAL and endotoxin produces a yellowpresence of LAL and endotoxin produces a yellow
colour. Intensity of colour = relates to amount ofcolour. Intensity of colour = relates to amount of
endotoxinendotoxin
• End-point or kinetic methodEnd-point or kinetic method
18. Chromogenic LAL testChromogenic LAL test
• MethodMethod
» Heated plate reader or heated tube reader (37Heated plate reader or heated tube reader (37oo
CC
+/-1+/-1oo
C)C)
» SpectrophotometerSpectrophotometer
» Computer softwareComputer software
» Lysate sensitivity determined via curveLysate sensitivity determined via curve
19. Chromogenic LAL testChromogenic LAL test
• Advantages of the testAdvantages of the test
» Fast, real time measurementFast, real time measurement
» Results can be ‘seen’Results can be ‘seen’
» Reading is automated: objectivityReading is automated: objectivity
» SoftwareSoftware
» Less dilutions cf Gel-clot (in-use costs)Less dilutions cf Gel-clot (in-use costs)
» Over-coming interferenceOver-coming interference
20. Chromogenic LAL TestChromogenic LAL Test
• Disadvantages of the testDisadvantages of the test
» Coloured samplesColoured samples
» Equipment and reagent costEquipment and reagent cost
» Technician expertise / variabilityTechnician expertise / variability
21. ComparisonComparison
• What’s similar?What’s similar?
» Use the same / similar principleUse the same / similar principle
» Use LALUse LAL
» Use tube or micro-plateUse tube or micro-plate
» Require endotoxin standardsRequire endotoxin standards
» Meet Regulatory requirements - FDA, MCA, EP,Meet Regulatory requirements - FDA, MCA, EP,
USP, JPUSP, JP
22. ComparisonComparison
• How do they compare?How do they compare?
Method Gel-clot Kinetic
Turbidimetric
Kinetic
Chrmogenic
Typical lower
detection limit
0.03 EU / mL 0.001 Eu / mL 0.005 EU / mL
Typical upper
detection limit
Fixed 100 EU / mL 50 EU / mL
Technician
involvement
High Medium Medium
Ease of use Low Medium High
23. ComparisonComparison
• How do they compare?How do they compare?
Method Gel-clot Kinetic
Turbidimetric
Kinetic
Chrmogenic
Test robustness Medium Medium High
Equipment cost Low High Medium
Reagent cost Medium Medium High
24. ComparisonComparison
• How do I choose?How do I choose?
– Gel-clot method?Gel-clot method?
– Turbidimetric method?Turbidimetric method?
– Chromogenic method?Chromogenic method?
– End point or kinetic?End point or kinetic?
25. SummarySummary
• Brief introduction to the LAL testBrief introduction to the LAL test
• The three main methodsThe three main methods
• Advantages and disadvantages of eachAdvantages and disadvantages of each
• Comparison between themComparison between them
26. SummarySummary
• Final choice…Final choice…
– It’s up to you:It’s up to you:
Your budgetYour budget
Your application - water, raw materials, in-processYour application - water, raw materials, in-process
samples or final productssamples or final products
Volumes to be testedVolumes to be tested
Material to be tested - turbid, coloured, precipitate,Material to be tested - turbid, coloured, precipitate,
inhibitioninhibition
Endotoxin limitEndotoxin limit
Degree of complianceDegree of compliance
Who am I?
Tim Sandle
Manager of Microbiology at Bio Products Laboratory (BPL)
BPL is the NHS’ manufacturer of blood products - derived from human plasma - for England and Wales
I have a long history of using the LAL test, starting in the 1980s
This is what we will be covering
Please can questions be saved to the end or until the discussion period
Because time is limited I can only touch on this subject.
This talk won’t conclude with a recommendation of which method - it is only guidance
I won’t be covering regulatory issues or future directions of the test (it’s possible that five years from now we won’t be using LAL at all to detect endotoxins)
By LAL test - methods designed to meet the Bacterial Endotoxin Test monographs in USP, EP and JP
Methods which detect the LPS component from cell wall of Gram negative bacteria, where a one millionth of a gram can be detected (using 0.03 sensitivity lysate)
LAL test emerged as an alternative to the rabbit pyrogen test for the pharamceutical industury in the 1980s (although used to test medical devices in 1970s)
However, work began on LAL reactions in the 1960s
LAL is far more sensitive than pyrogen test - 1000s of fold.
Today 0.001 EU can be detected using the photometric methods, which is aprox. Total endotoxin extracted from 10 E.coli bacteria
The first method to appear in the pharmacopeias was the gel-clot - others appeared later - and with most pharmacopeial changes took a while to gain acceptance
I will covering the gel-clot, kinetic turbdimetric and kinetic chromogenic.
Although I won’t be specifically covering the end-point versions of the two “photometric” methods a lot of what I will say will apply
An end-point method = read at a fixed time interval
kinetic method = read continuously (collecting data points every so many seconds). Advantage over end point is no set period of incubation (technician terminates the assay) and reduces what are three step processes into a single step assay
The three main methods work on the same principle
The use the same reagent - LAL
LAL is extracted from the horse shoe crab - mainly Limulus polyphemus (although Tachypleus and Carcinoscorpius are sometimes used world wide)
It is a lysate extracted from the crab’s amoeboyctes
The lysate detects endotoxin produced from Gram negative bacteria
Detection is based on the natural clotting mechanism of the crab; part of defence against bacteria and fungi (because it will reacr against other things other than endotoxin)
Based on Levin and Bang’s research
The LAL test takes the clotting cascade by utilising the fact that the crab’s amoeboyctes contain various proteins, co-factors and ions which all interact to initiate coagulation
This talk isn’t designed to go into detail here - but as all the methods use this clotting cascade (some in a more natural way than others) it is worth pausing
Endotoxin catalyses the activation of coagulase which hydrolyses bonds within a clotting protein called coagulogen to form hydrolysed coagulin
This forms an insouluble, gelatinous clot
LAL can be purified to a particular sensitivity so that the reaction - gel formation - equates to a particular value of endotoxin.
Therefore gel clot lysate is often available as 0.25, 0.125, 0.06 and at its most sensitive 0.03 EU
Therefore a clot at 0.03 lysate = probability of 0.03 EU or greater in a sample - say probability because of margin of error in the test
Tube method is the accepted method re: regulatory compliance
Low level of equipment
Hot block is better than water bath - stability, vibration, evaporation
Tube is typically 10 x 75 mm; soda lime glass - equal volume of lysate and sample
Fixed temperature and incubation time
To move beyond the limit test, by making two-fold dilutions the test can become semi-quantitative
Can become semi-quantitative through a dilution series (or ‘titration’ according to EP) e.g.using 0.03 sensitive lysate a neat sample gives a clot but a 1/2 dilution gives no clot, the result is somewhere between 0.03 and 0.06 (or 0.03125 and 0.0625 to be precise). Calculations using geometric means
Easy to perform once trained
Qualitative - pass or fail = quick and simple for product release
Low equipment cost
Regulatory / reference test advantage is less of an issue these days - now more understand the other methods / other methods more wide spread
Although it is semi-quantitative - this needs lots of dilutions for a sample with high level of endotoxin or need to over come interference; a lot when doing it in duplicate or quadruplicate!
Fixed incubation time - other methods are quicker; gives no idea of what is happening until final read e.g. test controls may fail
Interference - at every step of the clotting cascade from various factors like pH; alcohols…..many pharmaceutical products are increasingly complex
Limited sensitivity - the test dilution to overcome interference might be so great that the result looses meaning or conflicts with MVD….also less good for trending
Margin of error is high - any result can be with one-two fold dilution of the one obtained. E.g. test at 1/8th dilution and get a gel, result could be at 1/4 or 1/16th
Subjective: open to operator interpretation
Very reliant on paper records etc. for compliance / auditing…no print-outs etc.
Called photometric because they use spectrophotometers and measure threshold of absorbance
The kinetic methods use a standard curve of endotoxin concentrations, from which logs are taken and it is made linear and can be used to measure the endotoxin content of samples if it has a correlation coefficient of 0.980 or greater
Margin of error is about 50% (down from either side of a two-fold dilution for gel-clot)
Uses same basic reaction as the gel-clot
Called a photometric method in EP
Instead of going for final gelation it looks at the rate of gelation - as turbidity
The test - using appropriate software - plots the rate / time taken to reach a level of turbidity against a series of endotoxin standards
When an unknown is run, the time taken for it to become turbid can be measured against the onset times of a standard series and the endotoxin concentration extrapolated from the curve.
Kinetic method is by far the most common these days
Tube reader or plate reader = depends on personal preference / manufacturer used
Spectrophotometer measures (typically at 340 nm) the rate of reaction in milli-absorbance units and the time taken to reach a particular onset time. Once the onset time threshold is crossed the amount of endotoxin can be measured
Computer software performs all the calculations - construction of a standard curve; converting the curve into logs; measuring
Sensitivity of the lysate is determined by the standard curve used - typically 100 EU to 0.001 EU (much more sensitive than the gel-clot)
Results can be seen - if a sample is going to fail or controls are not working, action can be taken
reading is automated = removes subjectivity
Software allows all sorts of calculations and trending
Good for compliance etc
Less prone to vibration
Allows greater dilutions - overcoming interference
Can be less expensive as an in use method than gel-clot - once validation - because less dilutions involved
Difficult to test samples that a re turbid or have a degree of ppt without large dilutions - then comes the MVD issue again
Equipment set up is expensive
Prone to vibration - bubbles in tubes can mess up tests
Arguably need more skilled technicians in preparation….although some would argue that the automated part can be used to deskill labs!
The second of the photometric methods
Uses pNA (para-nitroaniline). pNA is a colourless peptide but becomes yellow when dia-associated.
It is artificially introduced into the cascade reaction by substituting the synthetic pNA substrate from the enzymatic reaction to work on. If endotoxin is present the yellow colour is produced
The intensity of the yellow colour is linearly related to endotoxin concentration because the quantity released is directly proportional to the amount of endotoxin released during the cascade reaction
An azo method was developed (with a purple colour) but this is less common place
Similar in equipment to the turbidimetric (now some machines are available that do both)
Tube reader or plate reader = depends on personal preference / manufacturer used
Spectrophotometer at 405 nm measuring the rate of colour development at a pre-determined level of absorbance
Computer software performs all the calculations - construction of a standard curve; converting the curve into logs; measuring
Sensitivity of the lysate is determined by the standard curve used - typically 50 EU to 0.005 EU (again much more sensitive than the gel-clot)
Advantages similar to the turbidimetric
Arguably a faster method
Same visual advantages - track results on computer, removal of subjectivity, software advanatages
Allows greater dilutions - overcoming interference; can test turbid samples
Difficult to test samples that a coloured without dilutions - then comes the MVD issue again
Equipment set up is expensive / the reagent cost is generally higher
Arguably needs the highest level of skill from technicians out of the three methods considered
All use or are based on the clotting cascade reaction for the horse shoe crab
All use purified lysate from the crab - as a lyophilised reagent
Use tube or plate reader
Need endotoxin standards derived from internationally accepted Reference Standard of E.coli
Importantly - meet the expectations of Regulatory Authorities
This table and the next one is a little subjective, especially ease of use and robustness
The different manufacturers here today can discuss with you equipment and reagent cost!
This is where you won’t get any easy answers!
Gel-clot - simple, easy to use; if you want a limit test and aren’t too worried about trending; OK with lots of a paper work. It is still the most widely used method in the world!
But….if you need to test more complicate products; want trending; want to demonstrate compliance (spike recoveries / remove subjectivity etc) etc……consider the photometric methods
But….they are easier to apply these days by people who understand assays…so the microbiologist needs to meet with the biochemist!
Much of the turbidimetric vs. chromogenic debate is down to personal choice
But…if you are testing lots of water or non-tubrid samples…consider turbidimetric
If you are testing a lot of final prodicts or have samples with turbidity or have slight ppt consider chromogenic
The photometric kinetic methods are generally easier than their end-point versions re: less manipulations