Download to read offline
![International Research Journal of Engineering and Technology (IRJET) e-ISSN: 2395-0056
Volume: 05 Issue: 11 | Nov 2018 www.irjet.net p-ISSN: 2395-0072
© 2018, IRJET | Impact Factor value: 7.211 | ISO 9001:2008 Certified Journal | Page 1603
4. CONCLUSION
The study focuses on analysis of credit card transactions’
dataset and identifies patterns that fraudulent credit card
transactions follow to help design and implement a credit
card fraud detection algorithm.
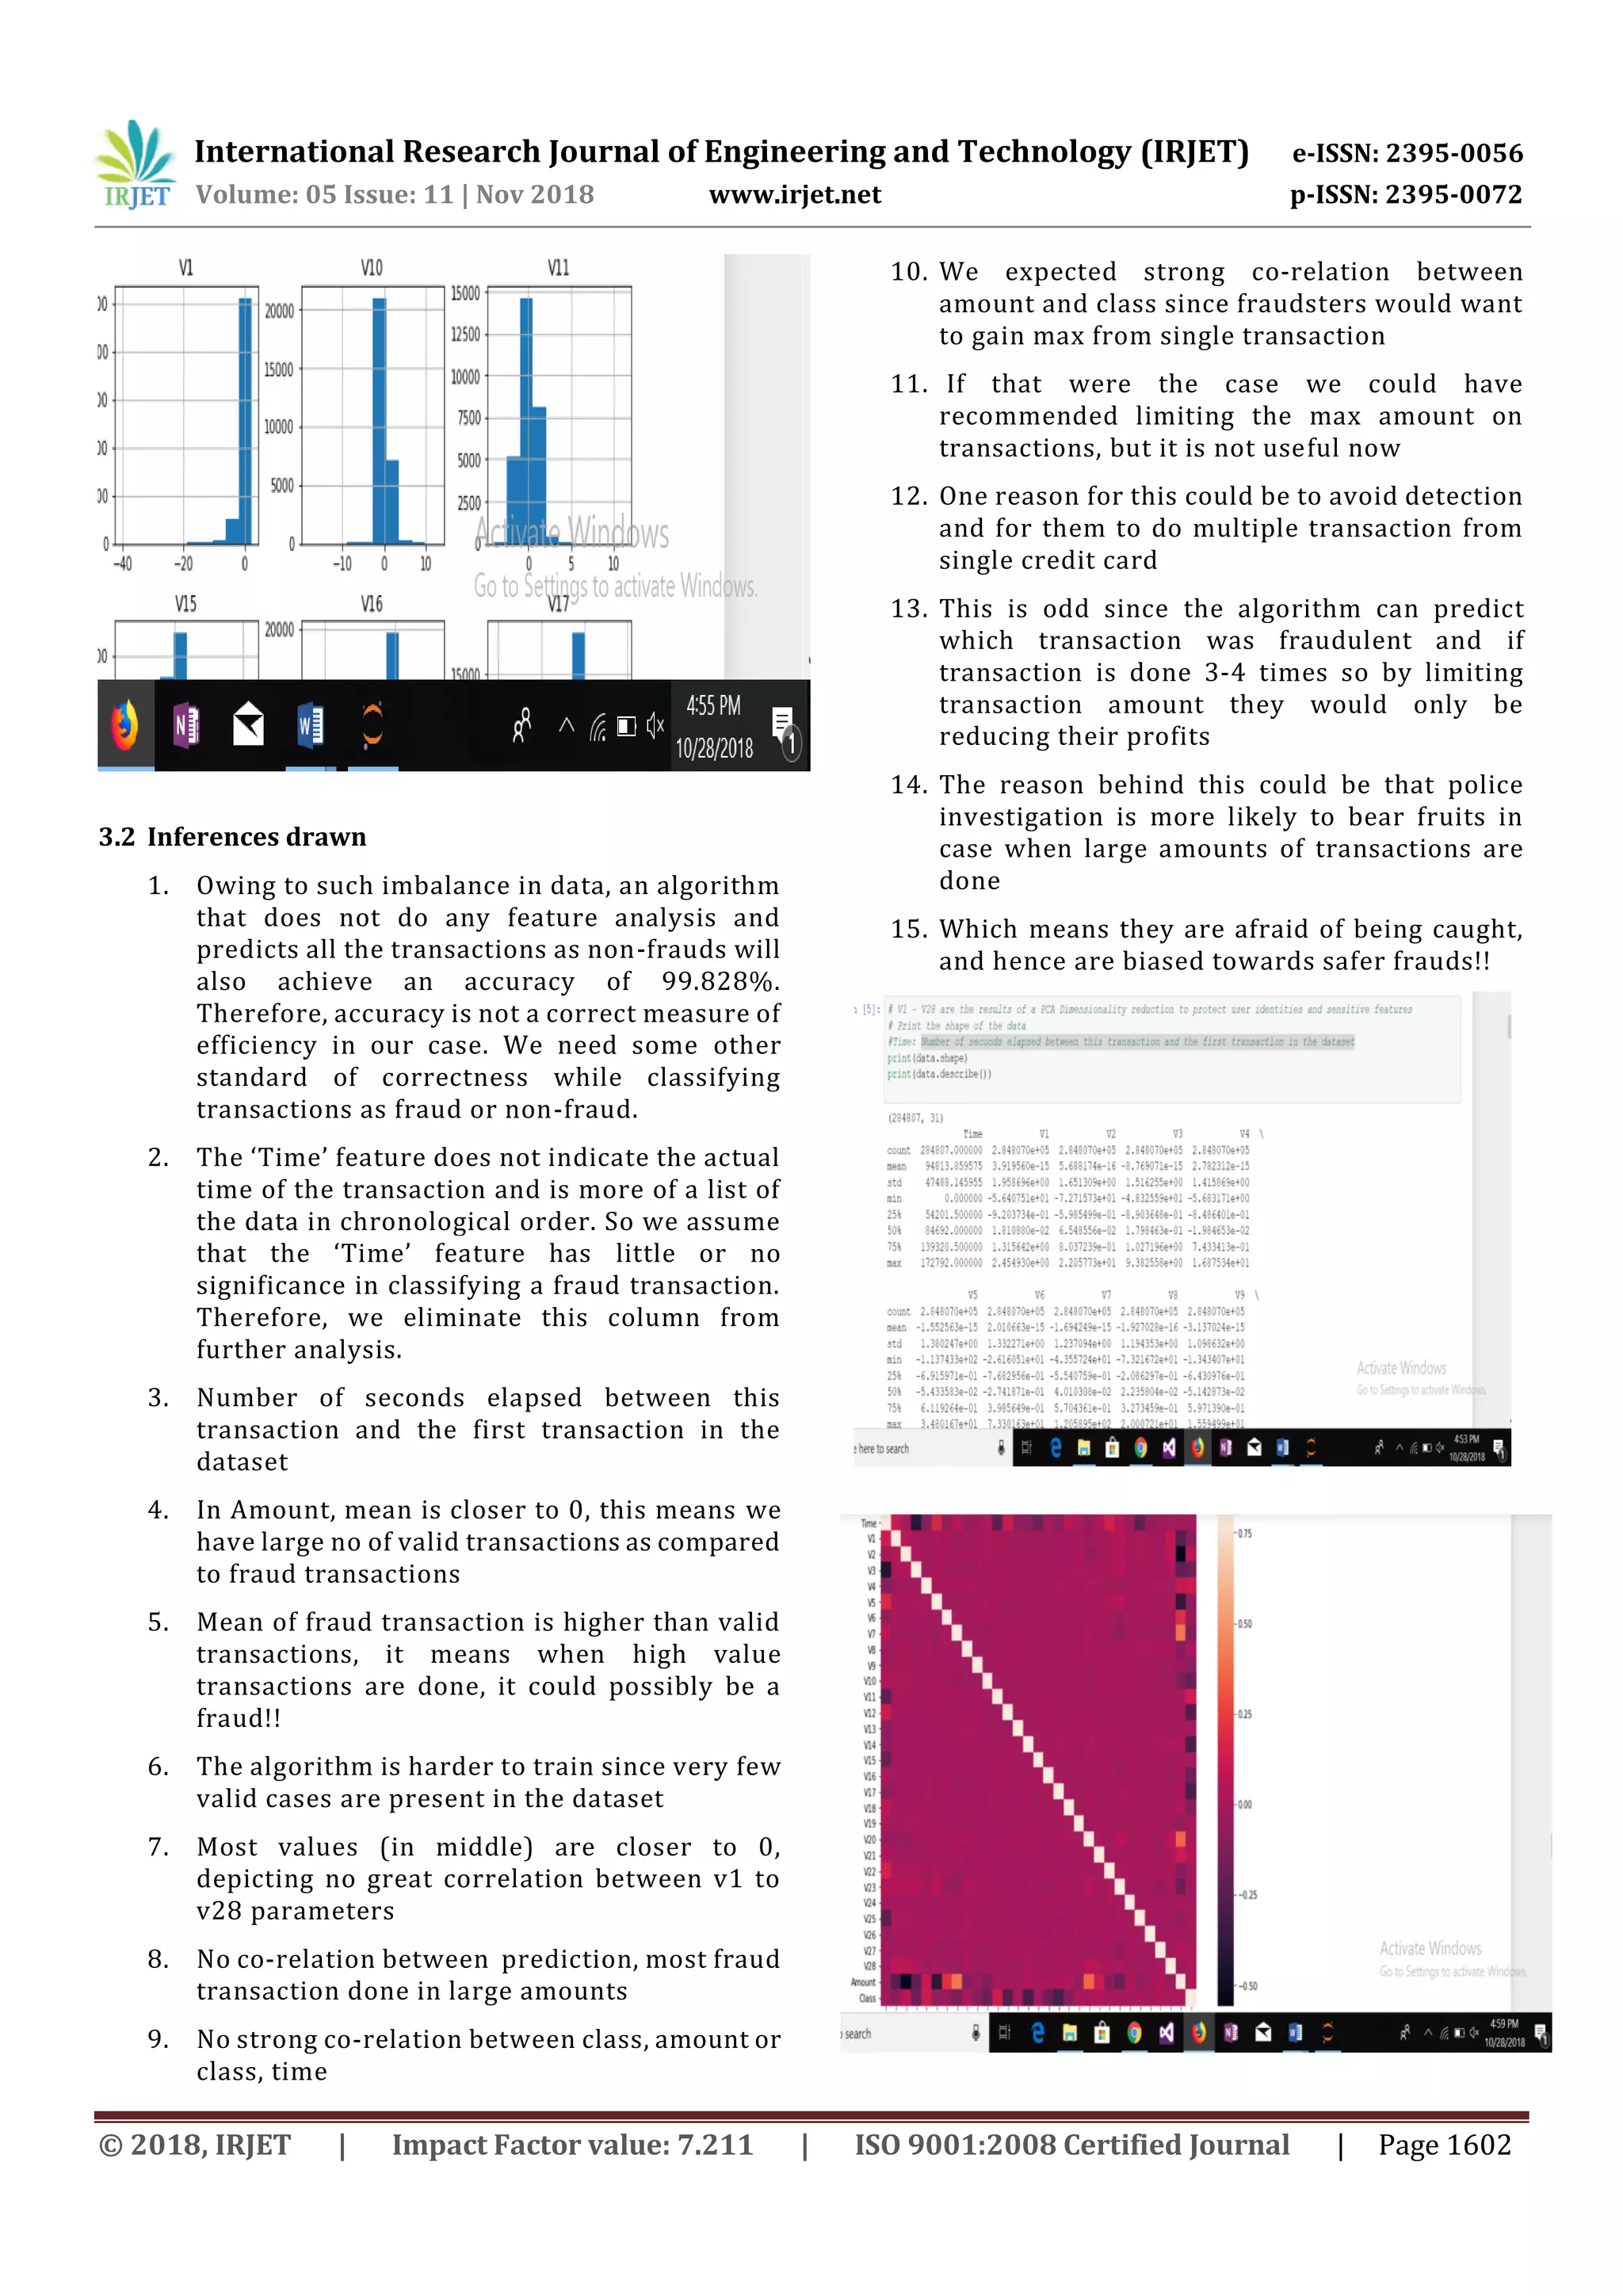
The data analysis is done by creating histograms of the
variables related to the dataset and by creating co-relation
matrix of the variables. The data analysis further helps us
identify the appropriate Machine Learning techniques
applicable to implement the algorithm.
The algorithm is implemented by using Local Outlier Factor
Machine Learning technique the results of which showsthat
the precision of this technique is very high but the accuracy
in detecting credit card fraud is low. The algorithm can be
used to detect fraudulent transactions which follow the
pattern.
REFERENCES
[1] Samaneh Sorournejad, Zahra Zojaji, Reza Ebrahimi
Atani, Amir Hassan Monadjemi “A Survey of Credit Card
Fraud Detection Techniques: Data and Technique
Oriented Perspective”
[2] https://en.wikipedia.org/wiki/Local_outlier_factor
[3] https://www.3pillarglobal.com/insights/credit-card-
fraud-detection](https://image.slidesharecdn.com/irjet-v5i11304-181208104839/75/IRJET-Credit-Card-Fraud-Detection-Analysis-4-2048.jpg)

This document analyzes a dataset of over 280,000 credit card transactions to detect fraudulent transactions using machine learning techniques. It first discusses challenges in credit card fraud detection like imbalanced data and lack of standard evaluation metrics. It then evaluates techniques like support vector machines, random forests, and local outlier factors. Analysis of the dataset found the data is highly skewed with few fraud cases. While models could achieve high accuracy by predicting all transactions as valid, other metrics are needed. The document concludes by implementing a local outlier factor model to detect patterns in fraudulent transactions, though accuracy in detecting fraud was low.