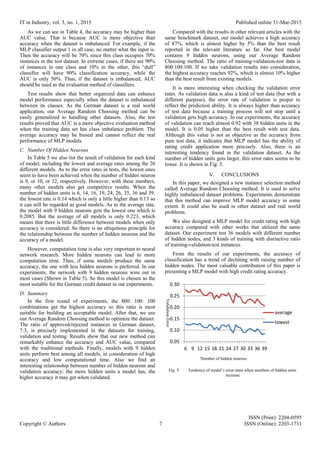
IT in Industry, vol. 3, no. 1, 2015 Published online 31-Mar-2015
ISSN (Print): 2204-0595
Copyright © Authors 1 ISSN (Online): 2203-1731
Instance Selection and Optimization of Neural Networks
Zongyuan Zhao, Shuxiang Xu, Byeong Ho Kang,
Mir Md Jahangir kabir
School of Computing and Information Systems
University of Tasmania
Tasmania, Australia
Yunling Liu*
College of Information and Electrical Engineering
China Agricultural University
Beijing, China
lyunling@163.com
Abstract— Credit scoring is an important tool in financial
institutions, which can be used in credit granting decision. Credit
applications are marked by credit scoring models and those with
high marks will be treated as “good”, while those with low marks
will be regarded as “bad”. As data mining technique develops,
automatic credit scoring systems are warmly welcomed for their
high efficiency and objective judgments. Many machine learning
algorithms have been applied in training credit scoring models,
and ANN is one of them with good performance. This paper
presents a higher accuracy credit scoring model based on MLP
neural networks trained with back propagation algorithm. Our
work focuses on enhancing credit scoring models in three
aspects: optimize data distribution in datasets using a new
method called Average Random Choosing; compare effects of
training-validation-test instances numbers; and find the most
suitable number of hidden units. Another contribution of this
paper is summarizing the tendency of scoring accuracy of models
when the number of hidden units increases. The experiment
results show that our methods can achieve high credit scoring
accuracy with imbalanced datasets. Thus, credit granting
decision can be made by data mining methods using MLP neural
networks.
Keywords— Back propagation; credit scoring; multilayer
perceptron; neural network
I. INTRODUCTION
Credit scoring, or credit rating, has been widely used in
banks and other financial institutes. It is the set of decision
models and their underlying techniques that help lenders judge
whether an application of credit should be approved or rejected
[1, 2]. Currently credit rating can be divided into two general
categories: new credit application judgement and prediction of
bankrupt after lending. The first kind uses personal information
and financial status of a loan applicant as inputs to calculate a
score. If the score is higher than a “safe level”, the applicant
has high possibility to preform good credit behaviour. On the
contrary, a low score indicates high risk loan so the lender
needs to take careful consideration of the application. The other
kind of credit scoring focuses on the credit record of existing
customers. This paper focuses on application scoring.
Compared with traditional credit scoring which is achieved
by professional bank managers, automatic scoring has some
obvious advantages: it saves costs and time for evaluating new
credit applications; it is consistent and objective [3]. However,
some current computational approaches are not as capable as
experienced loan experts on judgement accuracy. The
performances of automatic credit rating are always hindered by
imbalanced datasets, complex attributes and shortage of the
chosen data mining algorithms.
In recent years, artificial intelligence has shown its
advantages in credit scoring comparing with linear probability
models, discriminant analysis and other statistical techniques
[4]. Among those artificial intelligent models, Multilayer
perception (MLP) models are widely utilized [2, 5, 6] and
shown competitive prediction ability against other methods [7,
8]. In [9] back-propagation (BP) algorithm was developed and
now has been mostly used in training MLP. Improvements of
neural networks include altering the ratios of training and
testing datasets, the number of hidden nodes, and the training
iterations. A nine learning schemes with different training-to-
validation data ratios was investigated and got the
implementation results with the German datasets [10]. They
concluded that the learning scheme with 400 cases for training
and 600 for validation performed best with an overall accuracy
rate of 83.6%. Emotional neural network [11] is a modified BP
learning algorithm. It has additional emotional weights that are
updated using two additional emotional parameters: anxiety
and confidence. When comparing emotional neural networks
with conventional networks for credit risk evaluation,
experimental results showed that both models were effective,
but the emotional models outperformed the conventional ones
in decision making speed and accuracy [12].
As reported in [3], RBF, LS-SVM and BP classifiers yield
high performances on eight different credit scoring datasets. At
the same time LDA and LOG also get good results, which
indicate that the linear classifiers can also be available [4].
Several automatic scoring models also prove this result using
the German, Australian and Japanese credit datasets [5]. In
their experiments, C4.5 decision tree performed a little better
than MLP on credit scoring but both of them are with high
accuracies. On the contrary, Nearest Neighbor and Naïve
Bayes classifiers appeared to be the worst in their tests.
Optimization on the ratios of training and testing datasets,
the number of hidden nodes, and the training iterations can
have positive effect on refining the performance of MLP.
Using the German datasets, an experiment is designed to test
the performances of MLPs with various ratios of training-
validation instances [6]. In their tests, the learning scheme with
400 cases for training and 600 for validation performed best
regarding to the overall accuracy rate. The number of hidden
nodes is also considered in their tests, as they conduct their
*corresponding author
IT in Industry, vol. 3, no. 1, 2015 Published online 31-Mar-2015
ISSN (Print): 2204-0595
Copyright © Authors 2 ISSN (Online): 2203-1731
tests with MLPs that contains three different numbers of
hidden nodes. However, their tests only consider some cases
and could not lead to a general conclusion. Emotional neural
network [7] has additional emotional weights that are updated
using two additional emotional parameters: anxiety and
confidence. It is a modified BP learning algorithm. The
emotional models, as tested in experiments, outperformed the
conventional ones in both speed and accuracy [8]. Artificial
meta plasticity MLP is efficient when fewer patterns of a class
are available or when information inherent to low probability
events is crucial for a successful application. The accuracy of
this model is 84.67% for the German dataset, and 92.75% for
the Australian dataset [9].
In [10], a two-stage hybrid modelling procedure with ANN
and multivariate adaptive regression splines (MARS) is
designed. After using MARS in building the credit scoring
model, the obtained significant variables then served as the
input nodes of ANN. However, ensemble system performed
better only in one of the three datasets in the experiments of
[11]. MLP is compared with multiple classifiers and classifier
ensembles. Tests demonstrate that the ability of hybrid system
is not better than usual methods.
As to other methods, support vector machine (SVM) and
genetic algorithm (GA) are also used for credit rating with
good performance. SVM model can be refined by reduction of
features using F score and took a sample instead of a whole
dataset to create the credit scoring model [12]. Test results
showed that this method was competitive in the view of
accuracy as well as computational time. In [13], they selected
important variables by GA to combine bank’s internal
behavioral rating model and an external credit bureau model.
This dual scoring model underwent more accurate risk
judgment and segmentation to further discover the parts which
were required to be enhanced in management or control from
mortgage portfolio. Other than SVM and GA, Clustering-
Launched Classification (CLC) is also available and may
perform better than SVM [14]. A multi-criteria quadratic
programming (MCQP) model was proposed based on the idea
of maximizing external distance between groups and
minimizing internal distances within a certain group [15]. It
could solve linear equations to find a global optimal solution
and obtained the classifier and at the same time used kernel
functions to solve nonlinear problems. Comparing with SVM it
seemed more accurate and scalable to massive problems.
Decision tree (DT) is another good alternative method.
Recently, imbalanced datasets (where instances belonging
to one class heavily outnumber instances in other classes) have
attracted attention and some work has shown that appropriate
ratios of different kinds of instances can augment classification
accuracy. In [15], they used five real-world datasets to test the
effect of good/bad credit instance ratio. Results showed that
linear discriminant analysis (LDA) and logistic regression
(LOG) performed acceptable rating accuracy with both slightly
imbalanced datasets and highly imbalanced ones. To avoid the
effect of imbalance data distribution, dynamic classifier and
dynamic ensemble selection of features were added in the
scoring model, which performed better than static classifiers
[16].
Imbalance datasets can also bring bias to the evaluation of
credit rating models. Traditionally, the performance of credit
rating is evaluated by average accuracy. However, this value is
highly susceptible by the imbalance number of instances, if one
kind of instances is highly outnumbered the other. For example,
if the credit rating model decided that every instance is “good”,
and the ratio of good and bad instances is 9:1, then the
accuracy of this “silly” credit rating model will be 90%. This is
obviously unacceptable. In this paper, both accuracy and
another evaluation model called Area Under Curve (AUC) will
be used in experiments and the details of AUC will be
introduced.
In general, neural network with back propagation algorithm
can score credit applications with high performance. However,
there are still some problems for this model. Firstly, as the
ratios of approved and rejected instances in the datasets are
usually not balanced and sometimes highly imbalanced, the
training process of a model may have to deal with more
approved instances than rejected ones. This may cause bad
performance when applying the learned model to the test
datasets. Secondly, the numbers of instances used in test,
validation and training sets are always limited. More data used
in training means less used in validation and test, which may
result in low accuracy. As all the three parts need as much
instances as possible, the distribution of data is vital for the
final test results. At last, the number of hidden units affects the
accuracy and the time costs of a model. More hidden units may
lead to high computing time but insufficient units cannot
achieve high accuracy. The appropriate number can only be
known by experiments with different models and choose the
best according to the test results.
In order to solve these problems, three aspects of the MLP
will be discussed in this paper: (1) Optimise the ratio of
approved/rejected cases in input instances. (2) Test the effect of
different ratios of training-validation-testing data. (3) Improve
the structure of MLP network.
II. DATASET
There are many open credit dataset available on the website
of UCI Machine Learning Repository [5]. Among those
datasets, the German dataset is a real world dataset with 21
features including 20 attributes recording personal information
and financial history of applicants. The last feature is labelled
as approved (marked as 1) or rejected (marked as 2). This
dataset contains 1000 instances, with 700 approved application
instances and 300 rejected ones. These instances are presented
randomly. Attribute details of this dataset are listed in Table 1.
In this table, some attributes are numerical but others are
qualitative and hard to be computed in training of neural
networks. Thus, a numerical version of the dataset is used in
this work. It transforms all qualitative variables to numeric and
adds four more attributes.
The German credit dataset is widely used as a benchmark
and has many scoring models. In recent years different models
have been utilized on this dataset to solve credit scoring
problems. The accuracies of some representative models are
listed in Table 2.
IT in Industry, vol. 3, no. 1, 2015 Published online 31-Mar-2015
ISSN (Print): 2204-0595
Copyright © Authors 3 ISSN (Online): 2203-1731
TABLE I. ATTRIBUTES OF THE GERMEN CREDIT DATASET
Number Description Class
attribute 1 Status of existing checking account qualitative
attribute 2 Duration in month numerical
attribute 3 Credit history qualitative
attribute 4 Purpose qualitative
attribute 5 Credit amount numerical
attribute 6 Savings account/bonds qualitative
attribute 7 Present employment since qualitative
attribute 8 Instalment rate in percentage of
disposable income
numerical
attribute 9 Personal status and sex qualitative
attribute 10 Other debtors / guarantors qualitative
attribute 11 Present residence since numerical
attribute 12 Property qualitative
attribute 13 Age in years numerical
attribute 14 Other instalment plans qualitative
attribute 15 Housing qualitative
attribute 16 Number of existing credits at this bank numerical
attribute 17 Job qualitative
attribute 18 Number of people being liable to
provide maintenance for
numerical
attribute 19 Telephone qualitative
attribute 20 Foreign worker qualitative
TABLE II. ACCURACY OF SOME REPRESENTATIVE MODELS
Article Scoring Models Accuracy (%)
[9] MLP 84.67
[16] Ensemble 82.03
[17] LS-SVM 81.9
[18] MLP 81.3
[8] MLP 81.03
[12] SVM 80.42
[19] DT 78.52
[20] Re-Rx 78.47
[21] SVM 78.46
[22] Case-based reasoning model 77.4
[23] SVM 76.6
[24] SVM 75.4
[25] SVM 71.8
Some of the accuracies as listed are average rates in a group
of models and others are the best one. The “scoring models” in
table 1 are basic models used in experiments and many of them
have been improved. From this table we can see that the
highest accuracy is 84.67±1.5% achieved by [18] using MLP
model. This table only includes some results from journal
papers published between 2011 and 2013. There were lots of
experiments published in previous years but the accuracies
were not better.
III. METHEDOLOGY
A. Average Random Choosing Method
In this paper, we designed an average random choosing
(ARC) method to select instances from datasets, which is used
to improve training effects and model accuracy.
The imbalance of data classes (where instances belonging
to one class heavily outnumber instances in other classes)
usually exist in credit datasets. Thus, in the training of neural
networks there should be more instances of approved
applications in order to get a better scoring model. From the
point of test, as the original dataset is imbalanced, it is
reasonable to keep the same ratio (approved/failed) in the test
dataset.
Another problem of data processing is the ratio of training-
validation-test sets. All three sets should have proper amount of
instances. Usually, more instances for training can lead to
better chance to get a better model. However, as the amount of
data is limited, more data used for training means less for
validation and test, which will cause unpredictable test
performance.
Usually when given a dataset containing both training and
test data, the instances that used for training, validation and test
are chosen randomly. For balanced dataset, this will cause
imbalance distribution slightly and occasionally, which will
hardly bring any problems. However, when the dataset is
imbalanced, random choosing method will easily aggravate the
imbalance problem. For example, if the training instance group
is less imbalanced, which seems to be good for training, then
the test group will be higher imbalanced and makes the
evaluation of credit rating model biased.
To solve these problems, we propose a method called ARC
to pre-process data and generate average number of different
instanced in each data group such as training and test. Suppose
the total number of instances is n, and the ratio of good
applications in the dataset is p. Then the numbers of good and
bad applications are
Good applications: p ∗ n ,
Bad applicaions: (1 − p) ∗ n
Then suppose the ratio of data used in training is t and in
validation is v. Then we have
Training data: n ∗ t
Validation data: n ∗ v
Test data: n ∗ (1 − t − v)
As we want the ratio of good to bad applications stays the
same in training data (as in original data), the training,
validation and test data can be divided into good cases and bad
cases. The flow of processing data is listed in Figure 1.
Original Credit
Dataset
Good Instances
n*p
Bad instances
n*(1-p)
Training dataset
n*t
Validation dataset
n*v
Test dataset
n*(1-t-v)
1-p
p
Fig. 1. Flow of data processing and the amount of instances in each group
From the original dataset, two different kinds of data, bad
instances and good instances are divided into two groups. Then
both of them are divided into training, validation and test
datasets randomly. This step should be repeated for each new
network training session, which can minimize the effect of
IT in Industry, vol. 3, no. 1, 2015 Published online 31-Mar-2015
ISSN (Print): 2204-0595
Copyright © Authors 4 ISSN (Online): 2203-1731
unordinary instances. This way, it is more likely to get a good
data distribution which promotes a good scoring model. The
algorithm can be described as follows:
The function randperm(n) returns n different integer
numbers. It is used to randomly select n different samples from
an instance group.
By this method, all groups (training, validation and test)
have the same ratio of good to bad instances. Traditional 10-
fold validation method divides a dataset into 10 blocks of data
randomly before training starts. It is not really random
choosing and is not fit for imbalanced dataset. In some extreme
cases, there could be one group with only one class of data.
This is obviously unable to judge the performance of the
model. Our average random method chooses instances
randomly from both classes of data. It can choose data
randomly which ensures more instance combinations can be
used for training. Also the datasets of training, validation and
test have the same ratio of instances.
B. NN and MLP Scoring Mode
A neural network is a massively parallel distributed
processor made up of simple processing units, which has a
natural propensity for storing experiential knowledge and
making it available for use [26]. It was motivated by inspecting
the human brain, which has high efficiency in computing and
recognizing [27]. According to the structure of networks, it can
be divided as single layer feed forward networks, multilayer
feed forward networks and recurrent networks. Feed forward
networks do not have any feedback loop, which are different
from recurrent networks.
ANNs are made of neurons, or called simple perceptron.
The structure of neuron is shown in Fig 2. Each neuron is
composed of two units. First unit adds products of weights
coefficients and input signals. The second unit realizes
nonlinear function, called neuron activation function. Signal e
is adder output signal, and y = f(e) is output signal of nonlinear
element. Signal y is also output signal of neuron.
A typical feed forward network is multilayer perceptron
(MLP). Other kinds of feed forward networks include single
layer networks, radial basis function networks, support vector
machine and others. Among them, MLP has better
performance when applying on some models, especially for
complex models and nonlinear classification problems [28].
This research use MLP neural networks to construct a credit
rating model.
A three layer MLP model will be developed in this
research. The basic structure is demonstrated in Fig 3. The first
layer is the input layer with 24 neurons since the dataset
contains 24 input features (attributes). The last layer is the
output layer with only one neuron, which stands for the score
of an application. Only one hidden layer is used to reduce
computing complexity.
The number of hidden neurons can have great impact on
the performance of the network. Here we build 34 different
MLP models, with the number of hidden units varying from 6
to 39. The model with highest classification accuracy will be
chosen out. Our experiment results also prove that this scope is
large enough since some of the models can achieve high
accuracies.
Neural networks cannot work without “learning”. The
learning procedure is realized by learning algorithms, which
calculate the weights of each neuron in the network. Based on
the structure of NN, learning algorithms can be divided into
supervised learning and unsupervised learning. In this paper, as
the dataset has an outcome attribute, supervised learning will
be used to obtain a MLP model for classification. The most
popular learning algorithms for feed forward networks include
back propagation (BP), radial basis function (RBF) and others
[29].
f(e) y
x1
x2
w1
w2
x1
x2
w1
w2
Summing
junction
Non-linear
element
f(e)
e=x1w1+x2w2 y=f(e)
Fig. 2. Structure of neuron
Algorithm ARC
Original Dataset D={xi, ti |i=0,1…n}
1. Select out all samples of class A A={xi, ti |ti=1}
2. Select out all samples of class B B={xi, ti |ti=2}
3. Select instances for test from class A
TA={xi, ti | i =randperm(n*p*(1-t-v)), (xi, ti)∈A}
4. Select instances for test from class B
TB={xi, ti | i =randperm(n*(1-p)*(1-t-v)), (xi, ti)∈B}
5. The test instances group T=TA∪TB
6. Samples in class A that are used to train and validate
SA=A-TA
7. Samples in class B that are used to train and validate
SB=B-TB
8. while(not reach the max epoch)
9. Choose out samples used for training in class A
SAt={xi, ti |i=randperm(n*p*t), (xi, ti)∈SA}
10. Choose out samples used for training in class B
SBt={xi, ti |i=randperm(n*(1-p)*t), (xi, ti)∈SB}
11. The training group is St= SAt+ SBt
12. The validation group is Sv=( SA- SAt)∪(SB- SBt)
13. Calculate output
𝑦𝑖 = ∅(∑ 𝑤𝑠∅(∑ 𝑤𝑠𝑟
𝑛
𝑟=0 𝑥 𝑟))ℎ
𝑠=0 , xr∈St
14. Update MLP by BP. Error signal is
e(i)=ti-yi ti∈St
15. Validate MLP
𝑦𝑖 = ∅(∑ 𝑤𝑠∅(∑ 𝑤𝑠𝑟
𝑛
𝑟=0 𝑥 𝑟))ℎ
𝑠=0 , xr∈Sv
16. Performance of MLP v =
∑ 𝑒(𝑖)𝑛∗𝑣
𝑖=0
𝑛∗𝑣
17. if(v>v0) stop training
18. else v0=v
19. end while
IT in Industry, vol. 3, no. 1, 2015 Published online 31-Mar-2015
ISSN (Print): 2204-0595
Copyright © Authors 5 ISSN (Online): 2203-1731
In this paper, back propagation algorithm will be used in
the training of MLP models. It is widely used in the training of
MLP and proved to be effective for supervised training. The
basic idea of BP is to update the weights of each connection by
the difference of the outputs of the model and outputs in
datasets. Initial weights will be given randomly in a range and
the algorithm will stop if it meets the stopping criteria. It has
been proved that the weights can converge in finite iterations.
The algorithm of BP utilized on a MLP with one hidden layer
can be described as follows:
Initialize network weights (often small random values)
Do
for each training example ex
prediction = neural-net-output(network, ex)
// forward pass
actual = teacher-output(ex)
compute error (prediction - actual) at the output units
compute ∆𝑤ℎfor all weights from hidden layer to
output layer // backward pass
compute ∆𝑤𝑖 for all weights from input layer to
hidden layer // backward pass continued
update network weights
until all examples classified correctly or another stopping
criterion satisfied
return the network
During the procedure of training, validation is used to
control over-fitting. As the iteration goes on, the error rate of
the network goes down until it reaches the lowest point. After
that point, the error rate will not fall down any more and even
rise. This is called over training or over fitting and the training
procedure should be stopped when the error rate reaches the
lowest point. Here we use some data to validate the network
after each iteration. Validation data are not used to train the
network, and they are more like the test data. After each
iteration, we calculate the error rate with validation data and
compare it with the result of the last iteration. If the new one is
larger, then the iteration stops immediately. Else, the training
and validation process goes on. In this way, we can avoid over
fitting.
.
.
.
.
.
.
Input layer Hidden layer output layer
Fig. 3. Structure of a 3 layer MLP model.
C. Area Under Curve
Traditionally, classification accuracy is used to judge the
“goodness” of feature group. Recently the Area Under Curve
(AUC) have been proved to be a good alternative [30]. It was
initially used as an evaluation function in Feature Selection to
rank features in [31] and [32]. It was later extended to multi-
class in [33] and test results showed that AUC has better
performance than traditional overall accuracy (OA).
Define an experiment from P positive instances and N
negative instances for some condition. The four outcomes can
be formulated in a 2*2 contingency table or confusion matrix,
as in table 3 [34].
TABLE III. FOUR OUTCOMES OF AN EXPERIMENT
Condition
Positive Negative
Test
outcome
Positive True positive
False positive
(Type 1 error)
Precision=
Negative
False negative
(Type 2 error)
True negative
Negative predictive value=
Sensitivity= Specificity=
Accuracy
∑ 𝑇𝑟𝑢𝑒 𝑝𝑜𝑠𝑖𝑡𝑖𝑣𝑒
∑ 𝐶𝑜𝑛𝑑𝑖𝑡𝑖𝑜𝑛 𝑝𝑜𝑠𝑖𝑡𝑖𝑣𝑒
∑ 𝑇𝑢𝑟𝑒 𝑛𝑒𝑔𝑎𝑡𝑖𝑣𝑒
∑ 𝐶𝑜𝑛𝑑𝑖𝑡𝑖𝑜𝑛 𝑛𝑒𝑔𝑎𝑡𝑖𝑣𝑒
∑ 𝑇𝑢𝑟𝑒 𝑝𝑜𝑠𝑖𝑡𝑣𝑒
∑ 𝑇𝑒𝑠𝑡 𝑜𝑢𝑡𝑐𝑜𝑚𝑒 𝑝𝑜𝑠𝑖𝑡𝑖𝑣𝑒
∑ 𝑇𝑟𝑢𝑒 𝑛𝑒𝑔𝑎𝑡𝑖𝑣𝑒
∑ 𝑇𝑒𝑠𝑡 𝑜𝑢𝑡𝑐𝑜𝑚𝑒 𝑛𝑒𝑔𝑎𝑡𝑖𝑣𝑒
IT in Industry, vol. 3, no. 1, 2015 Published online 31-Mar-2015
ISSN (Print): 2204-0595
Copyright © Authors 6 ISSN (Online): 2203-1731
A receiver operating characteristic (ROC) space is defined
by false positive rate (FPR) and true positive rate (TPR) as x
and y axes respectively, as shown in Fig 4. Write the
probability for belonging in the class as a function of a
decision/threshold parameter T as P1(T) and the probability of
not belonging to the class as P0(T). The false positive rate FPR
is given by FPR(T) = ∫ 𝑃0(𝑇) 𝑑𝑇
∞
𝑇
and the true positive rate is
TPR(T) = ∫ 𝑃1(𝑇) 𝑑𝑇
∞
𝑇
. The ROC curve plots parametrically
TPR(T) versus FPR(T) with T as the varying parameter. The
area under the curve (AUC) of ROC is equal to the probability
that a classifier will rank a randomly chosen positive instance
higher than a randomly chosen negative one (assuming
'positive' ranks higher than 'negative') [30].
IV. EXPERIMENTS AND RESULTS
Experiments are designed to test the effective of our new
instance selection method and find out a better MLP model.
There are three aspects of the experiments. The first aspect is to
find out the best amount of data used in training, validation and
test, respectively. Then based on the results, the second aspect
is to focus on our new instance choosing method. Thirdly, we
discuss about the number of hidden neurons by training each
model 20 times with different initial weights for each kind of
model in all experiments. All instances for training, validation
and test are randomly chosen. The best and average error rates
are listed and discussed.
A. Ratio of Training-Validation-Test
In the experiments, we use 3 different ratios of data,
800:100:100, 900:50:50 and 600:200:200 to find out the most
suitable one. To be more accurate, all groups of data are chosen
randomly from the German dataset. The number of hidden
neurons varies from 6 to 39, which ensures that every group
can get their best model. Also each kind of model is trained 20
times. We record the lowest error rate and average rate of each
kind of model. Test results are listed in Table 5.
The result shows that a ratio of 800:100:100 performs
better in nearly all aspects in regards to accuracy rate. The
lowest error rate, 0.17, is achieved with 15 hidden units which
is also the best model of all. The average of error rate can
indicate an overall performance of some model groups. The
model with 10 hidden units seems more stable, with an average
error rate of 0.2295 which is lower than the others. For all
models, the average lowest error rate is around 0.208,
indicating that it is more likely to get a very low error rate with
this training-validation-test ratio.
The ratio of 600:200:200 gives more data to testing, which
leads to insufficient data for training. Thus it gets high error
rates in regards to both the lowest value and the average value.
Although the ratio 900:50:50 has more instances for training
and the lowest error rate is very close to the best one, the
shortness of testing data leads to a high average value, which
means there is a low possibility to get a good model.
B. Average Random Choosing method
In this section, we compare models trained by data from
our Average Random Choosing (ARC) method. Nothing has
changed except that we control the percentage of
approved/rejected instances in each dataset. The overall
percentage is 70% for approved instances and 30% for rejected
instances. So this ratio stays the same in training, validation
and test data groups. The ratio of training-validation-test is
800:200:200, which performs best in our previous tests. The
results are listed on Table 4.
Comparing with the traditional instances divide methods,
which randomly divide different kinds of instances in test,
validation and training, our new method obviously outperforms
the others. As to the AUC, the ARC method performs much
better than the other methods, especially the 900:50:50 group,
because class imbalance problem is very serious in that group.
Fig. 4. Area Under Curve (AUC)
TABLE IV. AUCS AND ACCURACIES OF ARC METHOD COMPARING WITH OTHER METHODS
Divide rate 800:100:100 900:50:50 600:200:200 ARC method
Evaluation method AUC
Average
Accuracy AUC
Average
Accuracy AUC
Average
Accuracy AUC
Average
Accuracy
9 hidden neurons 0.71 0.762 0.58 0.769 0.69 0.724 0.76 0.80
Best of all 0.73 0.771 0.62 0.769 0.71 0.738 0.76 0.80
IT in Industry, vol. 3, no. 1, 2015 Published online 31-Mar-2015
ISSN (Print): 2204-0595
Copyright © Authors 7 ISSN (Online): 2203-1731
As we can see in Table 4, the accuracy may be higher than
AUC value. That is because AUC is more objective than
accuracy when the dataset is imbalanced. For example, if the
MLP classifier output 1 in all case, no matter what the input is.
Then the accuracy will be 70% since this class occupies 70%
instances in the test dataset. In extreme cases, if there are 90%
of instances in one class and 10% in the other, this “dull”
classifier will have 90% classification accuracy, while the
AUC is only 50%. Thus, if the dataset is imbalanced, AUC
should be used as the evaluation method of classifiers.
Test results show that better organized data can enhance
model performance especially when the dataset is imbalanced
between its classes. As the German dataset is a real world
application, our Average Random Choosing method can be
easily generalized to handling other datasets. Also, the test
results proved that AUC is a more objective evaluation method
when the training data set has class imbalance problem. The
average accuracy may be biased and cannot reflect the real
performance of MLP models.
C. Number Of Hidden Neurons
In Table 5 we also list the result of validation for each kind
of model, including the lowest and average rates among the 20
different models. As to the error rates in tests, the lowest ones
seem to have been achieved when the number of hidden neuron
is 9, or 10, or 12, respectively. However, with these numbers,
many other models also get competitive results. When the
number of hidden units is 6, 14, 16, 19, 24, 26, 35, 36 and 39,
the lowest rate is 0.14 which is only a little higher than 0.13 so
it can still be regarded as good models. As to the average rate,
the model with 9 hidden neurons gets the lowest one which is
0.2085. But the average of all models is only 0.223, which
means that there is little difference between models when only
accuracy is considered. So there is no ubiquitous principle for
the relationship between the number of hidden neurons and the
accuracy of a model.
However, computation time is also very important to neural
network research. More hidden neurons can lead to more
computation time. Thus, if some models produce the same
accuracy, the one with less hidden neurons is preferred. In our
experiments, the network with 9 hidden neurons wins out in
most cases (Shown in Table 5). So this model is chosen as the
most suitable for the German credit dataset in our experiments.
D. Summary
In the first round of experiments, the 800: 100: 100
combinations get the highest accuracy so this ratio is most
suitable for building an acceptable model. After that, we use
our Average Random Choosing method to optimize the dataset.
The ratio of approved/rejected instances in German dataset,
7:3, is precisely implemented in the datasets for training,
validation and testing. Results show that our new method can
remarkably enhance the accuracy and AUC value, compared
with the traditional methods. Finally, models with 9 hidden
units perform best among all models, in consideration of high
accuracy and low computational time. Also we find an
interesting relationship between number of hidden neurons and
validation accuracy: the more hidden units a model has, the
higher accuracy it may get when validated.
Compared with the results in other relevant articles with the
same benchmark dataset, our model achieves a high accuracy
of 87%, which is almost higher by 5% than the best result
reported in the relevant literature so far. Our best model
contains 9 hidden neurons, using our Average Random
Choosing method. The ratio of training-validation-test data is
800:100:100. If we take validation results into consideration,
the highest accuracy reaches 92%, which is almost 10% higher
than the best result from existing models.
It is more interesting when checking the validation error
rates. As validation data is also a kind of test data (but with a
different purpose), the error rate of validation is proper to
reflect the prediction ability. It is always higher than accuracy
of test data because a training process will not stop until a
validation gets high accuracy. In our experiments, the accuracy
of validation can reach almost 0.92 with 38 hidden units in the
model. It is 0.05 higher than the best result with test data.
Although this value is not as objective as the accuracy from
pure test data, it indicates that MLP model has the ability of
rating credit application more precisely. Also, there is an
interesting tendency found in the validation dataset. As the
number of hidden units gets larger, this error rates seems to be
lower. It is shown in Fig. 5.
V. CONCLUSIONS
In this paper, we designed a new instance selection method
called Average Random Choosing method. It is used to solve
highly imbalanced dataset problems. Experiments demonstrate
that this method can improve MLP model accuracy in some
extent. It could also be used in other dataset and real world
problems.
We also designed a MLP model for credit rating with high
accuracy compared with other works that utilized the same
dataset. Our experiment test 36 models with different number
of hidden nodes, and 3 kinds of training with distinctive ratio
of training-validation-test instances.
From the results of our experiments, the accuracy of
classification has a trend of declining with raising number of
hidden nodes. The most valuable contribution of this paper is
presenting a MLP model with high credit rating accuracy.
Fig. 5. Tendency of model’s error rates when numbers of hidden units
increase
0.05
0.10
0.15
0.20
0.25
0.30
6 9 12 15 18 21 24 27 30 33 36 39
average
lowest
ValidationError
Number of hidden neurons
IT in Industry, vol. 3, no. 1, 2015 Published online 31-Mar-2015
ISSN (Print): 2204-0595
Copyright © Authors 8 ISSN (Online): 2203-1731
TABLE V. TEST RESULTS OF GERMEN CREDIT DATASET
800:100:100 900:50:50 600:200:200 Average Random Choosing method
Number of
hidden
neurons
Lowest
error
rate
Average
error rate
Lowest
error rate
Average
error rate
Lowest
error rate
Average
error rate
Lowest test
error rate
Average
error rate
lowest
validate
error rate
average
validate
error rate
6 0.21 0.2415 0.21 0.2925 0.245 0.273 0.14 0.2145 0.1265 0.1502
7 0.21 0.251 0.2 0.251 0.225 0.273 0.15 0.211 0.1228 0.1441
8 0.19 0.239 0.21 0.2765 0.22 0.2615 0.17 0.2215 0.1231 0.1438
9 0.18 0.2385 0.18 0.2315 0.245 0.27675 0.13 0.2085 0.1284 0.1472
10 0.18 0.2295 0.2 0.243 0.24 0.27075 0.13 0.221 0.1270 0.1471
11 0.2 0.242 0.18 0.2635 0.225 0.26275 0.16 0.223 0.1234 0.1439
12 0.21 0.246 0.19 0.2675 0.23 0.26575 0.13 0.225 0.1297 0.1491
13 0.2 0.256 0.21 0.2705 0.2 0.26625 0.16 0.2225 0.1163 0.1431
14 0.21 0.258 0.19 0.258 0.205 0.26525 0.14 0.2105 0.1113 0.1407
15 0.17 0.2595 0.21 0.26 0.24 0.2715 0.16 0.219 0.1103 0.1422
16 0.22 0.246 0.23 0.26 0.23 0.266 0.14 0.2085 0.1245 0.1399
17 0.19 0.248 0.21 0.245 0.235 0.2745 0.19 0.2415 0.1196 0.1433
18 0.21 0.2595 0.21 0.293 0.21 0.26725 0.17 0.221 0.1022 0.1342
19 0.2 0.255 0.24 0.277 0.235 0.28 0.14 0.2135 0.1124 0.1407
20 0.21 0.2585 0.21 0.262 0.22 0.2655 0.16 0.2215 0.1006 0.1402
21 0.22 0.256 0.21 0.2835 0.24 0.2665 0.16 0.215 0.1207 0.1368
22 0.2 0.2545 0.22 0.2985 0.23 0.26475 0.15 0.2195 0.1217 0.1351
23 0.19 0.259 0.21 0.2675 0.24 0.27075 0.18 0.2265 0.1143 0.1353
24 0.19 0.26 0.2 0.26 0.245 0.27375 0.14 0.215 0.1249 0.1377
25 0.22 0.257 0.21 0.2845 0.24 0.27175 0.15 0.223 0.1007 0.1394
26 0.22 0.2725 0.19 0.276 0.235 0.28575 0.14 0.224 0.0884 0.1310
27 0.2 0.261 0.22 0.287 0.24 0.2735 0.17 0.2175 0.1227 0.1380
28 0.21 0.2625 0.23 0.2755 0.235 0.2755 0.15 0.2235 0.1123 0.1345
29 0.21 0.262 0.19 0.266 0.225 0.273 0.15 0.2265 0.1100 0.1339
30 0.23 0.2765 0.23 0.278 0.21 0.2665 0.15 0.2275 0.0916 0.1304
31 0.24 0.2715 0.23 0.2775 0.25 0.28575 0.18 0.228 0.0892 0.1283
32 0.22 0.265 0.2 0.2775 0.245 0.272 0.18 0.234 0.1013 0.1295
33 0.23 0.2755 0.22 0.273 0.245 0.27725 0.17 0.2345 0.1070 0.1287
34 0.22 0.272 0.22 0.281 0.24 0.28575 0.17 0.228 0.1023 0.1285
35 0.22 0.2675 0.22 0.2885 0.235 0.28225 0.14 0.229 0.0932 0.1243
36 0.24 0.2835 0.19 0.285 0.245 0.2895 0.14 0.2275 0.1055 0.1311
37 0.22 0.278 0.23 0.3175 0.225 0.29125 0.16 0.2265 0.0963 0.1258
38 0.17 0.28 0.22 0.301 0.21 0.27825 0.19 0.2385 0.0801 0.1324
39 0.24 0.294 0.2 0.284 0.235 0.284 0.14 0.2375 0.0854 0.1215
Best 0.17 0.2295 0.18 0.2315 0.2 0.2615 0.13 0.2085 0.0801 0.1215
Average 0.2082 0.25988 0.20941 0.27389 0.23161 0.27375 0.1553 0.2231 0.1102 0.1368
Further works may focus on feature selection for neural
networks, as attributes in dataset are not always relevant to
classification feature. The elimination of redundant features
is an important task in data mining. Also it should be noticed
that the performance of credit rating model is always
evaluated by accuracies. Other statistic methods, such as F-
score, standard deviation (SD) and others should be used to
help choose out better credit rating models.
ACKNOWLEDGMENT
This work is supported by National Key Technology
R&D Program of China during the 12th Five-Year Plan
Period (Project number: 2012BAJ18B07).
REFERENCES
[1] L.C. Thomas, D.B. Edelman, and J.N. Crook, “Credit Scoring and Its
Applications,” 2002: SIAM: Philadelphia, PA.
[2] H.L. Jensen, “Using Neural Networks for Credit Scoring,”
Managerial Finance, vol. 18, no. 6, pp. 15, 1992.
[3] B. Baesens, et al., “Benchmarking State-of-the-Art Classification
Algorithms for Credit Scoring,” The Journal of the Operational
Research Society, vol. 54, no. 6, pp. 627-635, 2003.
[4] A.I. Marqués, V. García, and J.S. Sánchez, “Exploring the behaviour
of base classifiers in credit scoring ensembles,” Expert Systems with
Applications, vol. 39, no. 11, pp. 10244-10250, 2012.
[5] K. Bache and M. Lichman. {UCI} Machine Learning Repository.
2013; Available from: http://archive.ics.uci.edu/ml.
IT in Industry, vol. 3, no. 1, 2015 Published online 31-Mar-2015
ISSN (Print): 2204-0595
Copyright © Authors 9 ISSN (Online): 2203-1731
[6] A. Khashman, “Neural networks for credit risk evaluation:
Investigation of different neural models and learning schemes,”
Expert Systems with Applications, vol. 37, no. 9, pp. 6233-6239,
2010.
[7] A. Khashman, “A Modified Backpropagation Learning Algorithm
With Added Emotional Coefficients,” IEEE Transactions on Neural
Networks, vol. 19, no. 11, pp. 1896-1909, 2008.
[8] A. Khashman, “Credit risk evaluation using neural networks:
Emotional versus conventional models,” Applied Soft Computing, vol.
11, no. 8, pp. 5477-5484, 2011.
[9] A. Marcano-Cedeño, et al., “Artificial metaplasticity neural network
applied to credit scoring,” International Journal of Neural Systems,
vol. 21, no. 4, pp. 311-317, 2011.
[10] T.-S. Lee and I.F. Chen, “A two-stage hybrid credit scoring model
using artificial neural networks and multivariate adaptive regression
splines,” Expert Systems with Applications, vol. 28, no. 4, pp. 743-
752, 2005.
[11] C.-F. Tsai and J.-W. Wu, “Using neural network ensembles for
bankruptcy prediction and credit scoring,” Expert Systems with
Applications, vol. 34, no. 4, pp. 2639-2649, 2008.
[12] A.B. Hens and M.K. Tiwari, “Computational time reduction for credit
scoring: An integrated approach based on support vector machine and
stratified sampling method,” Expert Systems with Applications, vol.
39, no. 8, pp. 6774-6781, 2012.
[13] B.-W. Chi and C.-C. Hsu, “A hybrid approach to integrate genetic
algorithm into dual scoring model in enhancing the performance of
credit scoring model,” Expert Systems with Applications, vol. 39, no.
3, pp. 2650-2661, 2012.
[14] S.-T. Luo, B.-W. Cheng, and C.-H. Hsieh, “Prediction model building
with clustering-launched classification and support vector machines
in credit scoring,” Expert Systems with Applications, vol. 36, no. 4,
pp. 7562-7566, 2009.
[15] Y. Peng, et al., “A Multi-criteria Convex Quadratic Programming
model for credit data analysis,” Decision Support Systems, vol. 44,
no. 4, pp. 1016-1030, 2008.
[16] J. Xiao, et al., “Dynamic classifier ensemble model for customer
classification with imbalanced class distribution,” Expert Systems
with Applications, vol. 39, no. 3, pp. 3668-3675, 2012.
[17] I. Brown and C. Mues, “An experimental comparison of classification
algorithms for imbalanced credit scoring data sets,” Expert Systems
with Applications, vol. 39, no. 3, pp. 3446-3453, 2012.
[18] M. Khashei, et al., “A bi-level neural-based fuzzy classification
approach for credit scoring problems,” Complexity, vol. 18, no. 6, pp.
46-57, 2013.
[19] G. Wang, et al., “Two credit scoring models based on dual strategy
ensemble trees,” Knowledge-Based Systems, vol. 26, pp. 61-68, 2012.
[20] R. Setiono, B. Baesens, and C. Mues, “Rule extraction from minimal
neural networks for credit card screening,” International Journal of
Neural Systems, vol. 21, no. 4, pp. 265-276, 2011.
[21] L. Yu, et al., “Credit risk evaluation using a weighted least squares
SVM classifier with design of experiment for parameter selection,”
Expert Systems with Applications, vol. 38, no. 12, pp. 15392-15399,
2011.
[22] S. Vukovic, et al., “A case-based reasoning model that uses
preference theory functions for credit scoring,” Expert Systems with
Applications, vol. 39, no. 9, pp. 8389-8395, 2012.
[23] Y. Ping and L. Yongheng, “Neighborhood rough set and SVM based
hybrid credit scoring classifier,” Expert Systems with Applications,
vol. 38, no. 9, pp. 11300-11304, 2011.
[24] G.B. Gonen, M. Gonen, and F. Gurgen, “Probabilistic and
discriminative group-wise feature selection methods for credit risk
analysis,” Expert Systems with Applications, vol. 39, no. 14, pp.
11709-11717, 2012.
[25] A.I. Marqués, V. García, and J.S. Sánchez, “On the suitability of
resampling techniques for the class imbalance problem in credit
scoring,” Journal of the Operational Research Society, vol. 64, no. 7,
pp. 1060-1070, 2013.
[26] S.S. Haykin, Neural networks : a comprehensive foundation / Simon
Haykin, 1999: Upper Saddle River, N.J. : Prentice Hall, c1999. 2nd
ed.
[27] D. West, “Neural network credit scoring models,” Computers and
Operations Research, vol. 27, no. 11-12, pp. 1131-1152, 2000.
[28] T. Karkkainen and E. Heikkola, “Robust formulations for training
multilayer perceptrons,” Neural Computation, vol. 16, no. 4, pp. 837-
862, 2004.
[29] L. Yuchun, “Handwritten digit recognition using k nearest-neighbor,
radial-basis function, and backpropagation neural networks,” Neural
Computation, vol. 3, no. 3, pp. 440-449, 1991.
[30] T. Fawcett, “An introduction to ROC analysis,” Pattern recognition
letters, vol. 27, no. 8, pp. 861-874, 2006.
[31] X.-W. Chen and M. Wasikowski, “FAST: a roc-based feature
selection metric for small samples and imbalanced data classification
problems,” in Proceedings of the 14th ACM SIGKDD international
conference on Knowledge discovery and data mining, 2008, ACM:
Las Vegas, Nevada, USA. pp. 124-132.
[32] R. Wang and K. Tang, “Feature Selection for Maximizing the Area
Under the ROC Curve,” in Proceedings of the 2009 IEEE
International Conference on Data Mining Workshops, 2009, IEEE
Computer Society, pp. 400-405.
[33] R. Wang and K. Tang, “Feature selection for MAUC-oriented
classification systems,” Neurocomputing, vol. 89, pp. 39-54, 2012.
[34] J. Fogarty, R.S. Baker, and S.E. Hudson, “Case studies in the use of
ROC curve analysis for sensor-based estimates in human computer
interaction,” in Proceedings of Graphics Interface 2005, Canadian
Human-Computer Communications Society: Victoria, British
Columbia. pp. 129-136.

Instance Selection and Optimization of Neural Networks

  • 1.
    IT in Industry,vol. 3, no. 1, 2015 Published online 31-Mar-2015 ISSN (Print): 2204-0595 Copyright © Authors 1 ISSN (Online): 2203-1731 Instance Selection and Optimization of Neural Networks Zongyuan Zhao, Shuxiang Xu, Byeong Ho Kang, Mir Md Jahangir kabir School of Computing and Information Systems University of Tasmania Tasmania, Australia Yunling Liu* College of Information and Electrical Engineering China Agricultural University Beijing, China lyunling@163.com Abstract— Credit scoring is an important tool in financial institutions, which can be used in credit granting decision. Credit applications are marked by credit scoring models and those with high marks will be treated as “good”, while those with low marks will be regarded as “bad”. As data mining technique develops, automatic credit scoring systems are warmly welcomed for their high efficiency and objective judgments. Many machine learning algorithms have been applied in training credit scoring models, and ANN is one of them with good performance. This paper presents a higher accuracy credit scoring model based on MLP neural networks trained with back propagation algorithm. Our work focuses on enhancing credit scoring models in three aspects: optimize data distribution in datasets using a new method called Average Random Choosing; compare effects of training-validation-test instances numbers; and find the most suitable number of hidden units. Another contribution of this paper is summarizing the tendency of scoring accuracy of models when the number of hidden units increases. The experiment results show that our methods can achieve high credit scoring accuracy with imbalanced datasets. Thus, credit granting decision can be made by data mining methods using MLP neural networks. Keywords— Back propagation; credit scoring; multilayer perceptron; neural network I. INTRODUCTION Credit scoring, or credit rating, has been widely used in banks and other financial institutes. It is the set of decision models and their underlying techniques that help lenders judge whether an application of credit should be approved or rejected [1, 2]. Currently credit rating can be divided into two general categories: new credit application judgement and prediction of bankrupt after lending. The first kind uses personal information and financial status of a loan applicant as inputs to calculate a score. If the score is higher than a “safe level”, the applicant has high possibility to preform good credit behaviour. On the contrary, a low score indicates high risk loan so the lender needs to take careful consideration of the application. The other kind of credit scoring focuses on the credit record of existing customers. This paper focuses on application scoring. Compared with traditional credit scoring which is achieved by professional bank managers, automatic scoring has some obvious advantages: it saves costs and time for evaluating new credit applications; it is consistent and objective [3]. However, some current computational approaches are not as capable as experienced loan experts on judgement accuracy. The performances of automatic credit rating are always hindered by imbalanced datasets, complex attributes and shortage of the chosen data mining algorithms. In recent years, artificial intelligence has shown its advantages in credit scoring comparing with linear probability models, discriminant analysis and other statistical techniques [4]. Among those artificial intelligent models, Multilayer perception (MLP) models are widely utilized [2, 5, 6] and shown competitive prediction ability against other methods [7, 8]. In [9] back-propagation (BP) algorithm was developed and now has been mostly used in training MLP. Improvements of neural networks include altering the ratios of training and testing datasets, the number of hidden nodes, and the training iterations. A nine learning schemes with different training-to- validation data ratios was investigated and got the implementation results with the German datasets [10]. They concluded that the learning scheme with 400 cases for training and 600 for validation performed best with an overall accuracy rate of 83.6%. Emotional neural network [11] is a modified BP learning algorithm. It has additional emotional weights that are updated using two additional emotional parameters: anxiety and confidence. When comparing emotional neural networks with conventional networks for credit risk evaluation, experimental results showed that both models were effective, but the emotional models outperformed the conventional ones in decision making speed and accuracy [12]. As reported in [3], RBF, LS-SVM and BP classifiers yield high performances on eight different credit scoring datasets. At the same time LDA and LOG also get good results, which indicate that the linear classifiers can also be available [4]. Several automatic scoring models also prove this result using the German, Australian and Japanese credit datasets [5]. In their experiments, C4.5 decision tree performed a little better than MLP on credit scoring but both of them are with high accuracies. On the contrary, Nearest Neighbor and Naïve Bayes classifiers appeared to be the worst in their tests. Optimization on the ratios of training and testing datasets, the number of hidden nodes, and the training iterations can have positive effect on refining the performance of MLP. Using the German datasets, an experiment is designed to test the performances of MLPs with various ratios of training- validation instances [6]. In their tests, the learning scheme with 400 cases for training and 600 for validation performed best regarding to the overall accuracy rate. The number of hidden nodes is also considered in their tests, as they conduct their *corresponding author
  • 2.
    IT in Industry,vol. 3, no. 1, 2015 Published online 31-Mar-2015 ISSN (Print): 2204-0595 Copyright © Authors 2 ISSN (Online): 2203-1731 tests with MLPs that contains three different numbers of hidden nodes. However, their tests only consider some cases and could not lead to a general conclusion. Emotional neural network [7] has additional emotional weights that are updated using two additional emotional parameters: anxiety and confidence. It is a modified BP learning algorithm. The emotional models, as tested in experiments, outperformed the conventional ones in both speed and accuracy [8]. Artificial meta plasticity MLP is efficient when fewer patterns of a class are available or when information inherent to low probability events is crucial for a successful application. The accuracy of this model is 84.67% for the German dataset, and 92.75% for the Australian dataset [9]. In [10], a two-stage hybrid modelling procedure with ANN and multivariate adaptive regression splines (MARS) is designed. After using MARS in building the credit scoring model, the obtained significant variables then served as the input nodes of ANN. However, ensemble system performed better only in one of the three datasets in the experiments of [11]. MLP is compared with multiple classifiers and classifier ensembles. Tests demonstrate that the ability of hybrid system is not better than usual methods. As to other methods, support vector machine (SVM) and genetic algorithm (GA) are also used for credit rating with good performance. SVM model can be refined by reduction of features using F score and took a sample instead of a whole dataset to create the credit scoring model [12]. Test results showed that this method was competitive in the view of accuracy as well as computational time. In [13], they selected important variables by GA to combine bank’s internal behavioral rating model and an external credit bureau model. This dual scoring model underwent more accurate risk judgment and segmentation to further discover the parts which were required to be enhanced in management or control from mortgage portfolio. Other than SVM and GA, Clustering- Launched Classification (CLC) is also available and may perform better than SVM [14]. A multi-criteria quadratic programming (MCQP) model was proposed based on the idea of maximizing external distance between groups and minimizing internal distances within a certain group [15]. It could solve linear equations to find a global optimal solution and obtained the classifier and at the same time used kernel functions to solve nonlinear problems. Comparing with SVM it seemed more accurate and scalable to massive problems. Decision tree (DT) is another good alternative method. Recently, imbalanced datasets (where instances belonging to one class heavily outnumber instances in other classes) have attracted attention and some work has shown that appropriate ratios of different kinds of instances can augment classification accuracy. In [15], they used five real-world datasets to test the effect of good/bad credit instance ratio. Results showed that linear discriminant analysis (LDA) and logistic regression (LOG) performed acceptable rating accuracy with both slightly imbalanced datasets and highly imbalanced ones. To avoid the effect of imbalance data distribution, dynamic classifier and dynamic ensemble selection of features were added in the scoring model, which performed better than static classifiers [16]. Imbalance datasets can also bring bias to the evaluation of credit rating models. Traditionally, the performance of credit rating is evaluated by average accuracy. However, this value is highly susceptible by the imbalance number of instances, if one kind of instances is highly outnumbered the other. For example, if the credit rating model decided that every instance is “good”, and the ratio of good and bad instances is 9:1, then the accuracy of this “silly” credit rating model will be 90%. This is obviously unacceptable. In this paper, both accuracy and another evaluation model called Area Under Curve (AUC) will be used in experiments and the details of AUC will be introduced. In general, neural network with back propagation algorithm can score credit applications with high performance. However, there are still some problems for this model. Firstly, as the ratios of approved and rejected instances in the datasets are usually not balanced and sometimes highly imbalanced, the training process of a model may have to deal with more approved instances than rejected ones. This may cause bad performance when applying the learned model to the test datasets. Secondly, the numbers of instances used in test, validation and training sets are always limited. More data used in training means less used in validation and test, which may result in low accuracy. As all the three parts need as much instances as possible, the distribution of data is vital for the final test results. At last, the number of hidden units affects the accuracy and the time costs of a model. More hidden units may lead to high computing time but insufficient units cannot achieve high accuracy. The appropriate number can only be known by experiments with different models and choose the best according to the test results. In order to solve these problems, three aspects of the MLP will be discussed in this paper: (1) Optimise the ratio of approved/rejected cases in input instances. (2) Test the effect of different ratios of training-validation-testing data. (3) Improve the structure of MLP network. II. DATASET There are many open credit dataset available on the website of UCI Machine Learning Repository [5]. Among those datasets, the German dataset is a real world dataset with 21 features including 20 attributes recording personal information and financial history of applicants. The last feature is labelled as approved (marked as 1) or rejected (marked as 2). This dataset contains 1000 instances, with 700 approved application instances and 300 rejected ones. These instances are presented randomly. Attribute details of this dataset are listed in Table 1. In this table, some attributes are numerical but others are qualitative and hard to be computed in training of neural networks. Thus, a numerical version of the dataset is used in this work. It transforms all qualitative variables to numeric and adds four more attributes. The German credit dataset is widely used as a benchmark and has many scoring models. In recent years different models have been utilized on this dataset to solve credit scoring problems. The accuracies of some representative models are listed in Table 2.
  • 3.
    IT in Industry,vol. 3, no. 1, 2015 Published online 31-Mar-2015 ISSN (Print): 2204-0595 Copyright © Authors 3 ISSN (Online): 2203-1731 TABLE I. ATTRIBUTES OF THE GERMEN CREDIT DATASET Number Description Class attribute 1 Status of existing checking account qualitative attribute 2 Duration in month numerical attribute 3 Credit history qualitative attribute 4 Purpose qualitative attribute 5 Credit amount numerical attribute 6 Savings account/bonds qualitative attribute 7 Present employment since qualitative attribute 8 Instalment rate in percentage of disposable income numerical attribute 9 Personal status and sex qualitative attribute 10 Other debtors / guarantors qualitative attribute 11 Present residence since numerical attribute 12 Property qualitative attribute 13 Age in years numerical attribute 14 Other instalment plans qualitative attribute 15 Housing qualitative attribute 16 Number of existing credits at this bank numerical attribute 17 Job qualitative attribute 18 Number of people being liable to provide maintenance for numerical attribute 19 Telephone qualitative attribute 20 Foreign worker qualitative TABLE II. ACCURACY OF SOME REPRESENTATIVE MODELS Article Scoring Models Accuracy (%) [9] MLP 84.67 [16] Ensemble 82.03 [17] LS-SVM 81.9 [18] MLP 81.3 [8] MLP 81.03 [12] SVM 80.42 [19] DT 78.52 [20] Re-Rx 78.47 [21] SVM 78.46 [22] Case-based reasoning model 77.4 [23] SVM 76.6 [24] SVM 75.4 [25] SVM 71.8 Some of the accuracies as listed are average rates in a group of models and others are the best one. The “scoring models” in table 1 are basic models used in experiments and many of them have been improved. From this table we can see that the highest accuracy is 84.67±1.5% achieved by [18] using MLP model. This table only includes some results from journal papers published between 2011 and 2013. There were lots of experiments published in previous years but the accuracies were not better. III. METHEDOLOGY A. Average Random Choosing Method In this paper, we designed an average random choosing (ARC) method to select instances from datasets, which is used to improve training effects and model accuracy. The imbalance of data classes (where instances belonging to one class heavily outnumber instances in other classes) usually exist in credit datasets. Thus, in the training of neural networks there should be more instances of approved applications in order to get a better scoring model. From the point of test, as the original dataset is imbalanced, it is reasonable to keep the same ratio (approved/failed) in the test dataset. Another problem of data processing is the ratio of training- validation-test sets. All three sets should have proper amount of instances. Usually, more instances for training can lead to better chance to get a better model. However, as the amount of data is limited, more data used for training means less for validation and test, which will cause unpredictable test performance. Usually when given a dataset containing both training and test data, the instances that used for training, validation and test are chosen randomly. For balanced dataset, this will cause imbalance distribution slightly and occasionally, which will hardly bring any problems. However, when the dataset is imbalanced, random choosing method will easily aggravate the imbalance problem. For example, if the training instance group is less imbalanced, which seems to be good for training, then the test group will be higher imbalanced and makes the evaluation of credit rating model biased. To solve these problems, we propose a method called ARC to pre-process data and generate average number of different instanced in each data group such as training and test. Suppose the total number of instances is n, and the ratio of good applications in the dataset is p. Then the numbers of good and bad applications are Good applications: p ∗ n , Bad applicaions: (1 − p) ∗ n Then suppose the ratio of data used in training is t and in validation is v. Then we have Training data: n ∗ t Validation data: n ∗ v Test data: n ∗ (1 − t − v) As we want the ratio of good to bad applications stays the same in training data (as in original data), the training, validation and test data can be divided into good cases and bad cases. The flow of processing data is listed in Figure 1. Original Credit Dataset Good Instances n*p Bad instances n*(1-p) Training dataset n*t Validation dataset n*v Test dataset n*(1-t-v) 1-p p Fig. 1. Flow of data processing and the amount of instances in each group From the original dataset, two different kinds of data, bad instances and good instances are divided into two groups. Then both of them are divided into training, validation and test datasets randomly. This step should be repeated for each new network training session, which can minimize the effect of
  • 4.
    IT in Industry,vol. 3, no. 1, 2015 Published online 31-Mar-2015 ISSN (Print): 2204-0595 Copyright © Authors 4 ISSN (Online): 2203-1731 unordinary instances. This way, it is more likely to get a good data distribution which promotes a good scoring model. The algorithm can be described as follows: The function randperm(n) returns n different integer numbers. It is used to randomly select n different samples from an instance group. By this method, all groups (training, validation and test) have the same ratio of good to bad instances. Traditional 10- fold validation method divides a dataset into 10 blocks of data randomly before training starts. It is not really random choosing and is not fit for imbalanced dataset. In some extreme cases, there could be one group with only one class of data. This is obviously unable to judge the performance of the model. Our average random method chooses instances randomly from both classes of data. It can choose data randomly which ensures more instance combinations can be used for training. Also the datasets of training, validation and test have the same ratio of instances. B. NN and MLP Scoring Mode A neural network is a massively parallel distributed processor made up of simple processing units, which has a natural propensity for storing experiential knowledge and making it available for use [26]. It was motivated by inspecting the human brain, which has high efficiency in computing and recognizing [27]. According to the structure of networks, it can be divided as single layer feed forward networks, multilayer feed forward networks and recurrent networks. Feed forward networks do not have any feedback loop, which are different from recurrent networks. ANNs are made of neurons, or called simple perceptron. The structure of neuron is shown in Fig 2. Each neuron is composed of two units. First unit adds products of weights coefficients and input signals. The second unit realizes nonlinear function, called neuron activation function. Signal e is adder output signal, and y = f(e) is output signal of nonlinear element. Signal y is also output signal of neuron. A typical feed forward network is multilayer perceptron (MLP). Other kinds of feed forward networks include single layer networks, radial basis function networks, support vector machine and others. Among them, MLP has better performance when applying on some models, especially for complex models and nonlinear classification problems [28]. This research use MLP neural networks to construct a credit rating model. A three layer MLP model will be developed in this research. The basic structure is demonstrated in Fig 3. The first layer is the input layer with 24 neurons since the dataset contains 24 input features (attributes). The last layer is the output layer with only one neuron, which stands for the score of an application. Only one hidden layer is used to reduce computing complexity. The number of hidden neurons can have great impact on the performance of the network. Here we build 34 different MLP models, with the number of hidden units varying from 6 to 39. The model with highest classification accuracy will be chosen out. Our experiment results also prove that this scope is large enough since some of the models can achieve high accuracies. Neural networks cannot work without “learning”. The learning procedure is realized by learning algorithms, which calculate the weights of each neuron in the network. Based on the structure of NN, learning algorithms can be divided into supervised learning and unsupervised learning. In this paper, as the dataset has an outcome attribute, supervised learning will be used to obtain a MLP model for classification. The most popular learning algorithms for feed forward networks include back propagation (BP), radial basis function (RBF) and others [29]. f(e) y x1 x2 w1 w2 x1 x2 w1 w2 Summing junction Non-linear element f(e) e=x1w1+x2w2 y=f(e) Fig. 2. Structure of neuron Algorithm ARC Original Dataset D={xi, ti |i=0,1…n} 1. Select out all samples of class A A={xi, ti |ti=1} 2. Select out all samples of class B B={xi, ti |ti=2} 3. Select instances for test from class A TA={xi, ti | i =randperm(n*p*(1-t-v)), (xi, ti)∈A} 4. Select instances for test from class B TB={xi, ti | i =randperm(n*(1-p)*(1-t-v)), (xi, ti)∈B} 5. The test instances group T=TA∪TB 6. Samples in class A that are used to train and validate SA=A-TA 7. Samples in class B that are used to train and validate SB=B-TB 8. while(not reach the max epoch) 9. Choose out samples used for training in class A SAt={xi, ti |i=randperm(n*p*t), (xi, ti)∈SA} 10. Choose out samples used for training in class B SBt={xi, ti |i=randperm(n*(1-p)*t), (xi, ti)∈SB} 11. The training group is St= SAt+ SBt 12. The validation group is Sv=( SA- SAt)∪(SB- SBt) 13. Calculate output 𝑦𝑖 = ∅(∑ 𝑤𝑠∅(∑ 𝑤𝑠𝑟 𝑛 𝑟=0 𝑥 𝑟))ℎ 𝑠=0 , xr∈St 14. Update MLP by BP. Error signal is e(i)=ti-yi ti∈St 15. Validate MLP 𝑦𝑖 = ∅(∑ 𝑤𝑠∅(∑ 𝑤𝑠𝑟 𝑛 𝑟=0 𝑥 𝑟))ℎ 𝑠=0 , xr∈Sv 16. Performance of MLP v = ∑ 𝑒(𝑖)𝑛∗𝑣 𝑖=0 𝑛∗𝑣 17. if(v>v0) stop training 18. else v0=v 19. end while
  • 5.
    IT in Industry,vol. 3, no. 1, 2015 Published online 31-Mar-2015 ISSN (Print): 2204-0595 Copyright © Authors 5 ISSN (Online): 2203-1731 In this paper, back propagation algorithm will be used in the training of MLP models. It is widely used in the training of MLP and proved to be effective for supervised training. The basic idea of BP is to update the weights of each connection by the difference of the outputs of the model and outputs in datasets. Initial weights will be given randomly in a range and the algorithm will stop if it meets the stopping criteria. It has been proved that the weights can converge in finite iterations. The algorithm of BP utilized on a MLP with one hidden layer can be described as follows: Initialize network weights (often small random values) Do for each training example ex prediction = neural-net-output(network, ex) // forward pass actual = teacher-output(ex) compute error (prediction - actual) at the output units compute ∆𝑤ℎfor all weights from hidden layer to output layer // backward pass compute ∆𝑤𝑖 for all weights from input layer to hidden layer // backward pass continued update network weights until all examples classified correctly or another stopping criterion satisfied return the network During the procedure of training, validation is used to control over-fitting. As the iteration goes on, the error rate of the network goes down until it reaches the lowest point. After that point, the error rate will not fall down any more and even rise. This is called over training or over fitting and the training procedure should be stopped when the error rate reaches the lowest point. Here we use some data to validate the network after each iteration. Validation data are not used to train the network, and they are more like the test data. After each iteration, we calculate the error rate with validation data and compare it with the result of the last iteration. If the new one is larger, then the iteration stops immediately. Else, the training and validation process goes on. In this way, we can avoid over fitting. . . . . . . Input layer Hidden layer output layer Fig. 3. Structure of a 3 layer MLP model. C. Area Under Curve Traditionally, classification accuracy is used to judge the “goodness” of feature group. Recently the Area Under Curve (AUC) have been proved to be a good alternative [30]. It was initially used as an evaluation function in Feature Selection to rank features in [31] and [32]. It was later extended to multi- class in [33] and test results showed that AUC has better performance than traditional overall accuracy (OA). Define an experiment from P positive instances and N negative instances for some condition. The four outcomes can be formulated in a 2*2 contingency table or confusion matrix, as in table 3 [34]. TABLE III. FOUR OUTCOMES OF AN EXPERIMENT Condition Positive Negative Test outcome Positive True positive False positive (Type 1 error) Precision= Negative False negative (Type 2 error) True negative Negative predictive value= Sensitivity= Specificity= Accuracy ∑ 𝑇𝑟𝑢𝑒 𝑝𝑜𝑠𝑖𝑡𝑖𝑣𝑒 ∑ 𝐶𝑜𝑛𝑑𝑖𝑡𝑖𝑜𝑛 𝑝𝑜𝑠𝑖𝑡𝑖𝑣𝑒 ∑ 𝑇𝑢𝑟𝑒 𝑛𝑒𝑔𝑎𝑡𝑖𝑣𝑒 ∑ 𝐶𝑜𝑛𝑑𝑖𝑡𝑖𝑜𝑛 𝑛𝑒𝑔𝑎𝑡𝑖𝑣𝑒 ∑ 𝑇𝑢𝑟𝑒 𝑝𝑜𝑠𝑖𝑡𝑣𝑒 ∑ 𝑇𝑒𝑠𝑡 𝑜𝑢𝑡𝑐𝑜𝑚𝑒 𝑝𝑜𝑠𝑖𝑡𝑖𝑣𝑒 ∑ 𝑇𝑟𝑢𝑒 𝑛𝑒𝑔𝑎𝑡𝑖𝑣𝑒 ∑ 𝑇𝑒𝑠𝑡 𝑜𝑢𝑡𝑐𝑜𝑚𝑒 𝑛𝑒𝑔𝑎𝑡𝑖𝑣𝑒
  • 6.
    IT in Industry,vol. 3, no. 1, 2015 Published online 31-Mar-2015 ISSN (Print): 2204-0595 Copyright © Authors 6 ISSN (Online): 2203-1731 A receiver operating characteristic (ROC) space is defined by false positive rate (FPR) and true positive rate (TPR) as x and y axes respectively, as shown in Fig 4. Write the probability for belonging in the class as a function of a decision/threshold parameter T as P1(T) and the probability of not belonging to the class as P0(T). The false positive rate FPR is given by FPR(T) = ∫ 𝑃0(𝑇) 𝑑𝑇 ∞ 𝑇 and the true positive rate is TPR(T) = ∫ 𝑃1(𝑇) 𝑑𝑇 ∞ 𝑇 . The ROC curve plots parametrically TPR(T) versus FPR(T) with T as the varying parameter. The area under the curve (AUC) of ROC is equal to the probability that a classifier will rank a randomly chosen positive instance higher than a randomly chosen negative one (assuming 'positive' ranks higher than 'negative') [30]. IV. EXPERIMENTS AND RESULTS Experiments are designed to test the effective of our new instance selection method and find out a better MLP model. There are three aspects of the experiments. The first aspect is to find out the best amount of data used in training, validation and test, respectively. Then based on the results, the second aspect is to focus on our new instance choosing method. Thirdly, we discuss about the number of hidden neurons by training each model 20 times with different initial weights for each kind of model in all experiments. All instances for training, validation and test are randomly chosen. The best and average error rates are listed and discussed. A. Ratio of Training-Validation-Test In the experiments, we use 3 different ratios of data, 800:100:100, 900:50:50 and 600:200:200 to find out the most suitable one. To be more accurate, all groups of data are chosen randomly from the German dataset. The number of hidden neurons varies from 6 to 39, which ensures that every group can get their best model. Also each kind of model is trained 20 times. We record the lowest error rate and average rate of each kind of model. Test results are listed in Table 5. The result shows that a ratio of 800:100:100 performs better in nearly all aspects in regards to accuracy rate. The lowest error rate, 0.17, is achieved with 15 hidden units which is also the best model of all. The average of error rate can indicate an overall performance of some model groups. The model with 10 hidden units seems more stable, with an average error rate of 0.2295 which is lower than the others. For all models, the average lowest error rate is around 0.208, indicating that it is more likely to get a very low error rate with this training-validation-test ratio. The ratio of 600:200:200 gives more data to testing, which leads to insufficient data for training. Thus it gets high error rates in regards to both the lowest value and the average value. Although the ratio 900:50:50 has more instances for training and the lowest error rate is very close to the best one, the shortness of testing data leads to a high average value, which means there is a low possibility to get a good model. B. Average Random Choosing method In this section, we compare models trained by data from our Average Random Choosing (ARC) method. Nothing has changed except that we control the percentage of approved/rejected instances in each dataset. The overall percentage is 70% for approved instances and 30% for rejected instances. So this ratio stays the same in training, validation and test data groups. The ratio of training-validation-test is 800:200:200, which performs best in our previous tests. The results are listed on Table 4. Comparing with the traditional instances divide methods, which randomly divide different kinds of instances in test, validation and training, our new method obviously outperforms the others. As to the AUC, the ARC method performs much better than the other methods, especially the 900:50:50 group, because class imbalance problem is very serious in that group. Fig. 4. Area Under Curve (AUC) TABLE IV. AUCS AND ACCURACIES OF ARC METHOD COMPARING WITH OTHER METHODS Divide rate 800:100:100 900:50:50 600:200:200 ARC method Evaluation method AUC Average Accuracy AUC Average Accuracy AUC Average Accuracy AUC Average Accuracy 9 hidden neurons 0.71 0.762 0.58 0.769 0.69 0.724 0.76 0.80 Best of all 0.73 0.771 0.62 0.769 0.71 0.738 0.76 0.80
  • 7.
    IT in Industry,vol. 3, no. 1, 2015 Published online 31-Mar-2015 ISSN (Print): 2204-0595 Copyright © Authors 7 ISSN (Online): 2203-1731 As we can see in Table 4, the accuracy may be higher than AUC value. That is because AUC is more objective than accuracy when the dataset is imbalanced. For example, if the MLP classifier output 1 in all case, no matter what the input is. Then the accuracy will be 70% since this class occupies 70% instances in the test dataset. In extreme cases, if there are 90% of instances in one class and 10% in the other, this “dull” classifier will have 90% classification accuracy, while the AUC is only 50%. Thus, if the dataset is imbalanced, AUC should be used as the evaluation method of classifiers. Test results show that better organized data can enhance model performance especially when the dataset is imbalanced between its classes. As the German dataset is a real world application, our Average Random Choosing method can be easily generalized to handling other datasets. Also, the test results proved that AUC is a more objective evaluation method when the training data set has class imbalance problem. The average accuracy may be biased and cannot reflect the real performance of MLP models. C. Number Of Hidden Neurons In Table 5 we also list the result of validation for each kind of model, including the lowest and average rates among the 20 different models. As to the error rates in tests, the lowest ones seem to have been achieved when the number of hidden neuron is 9, or 10, or 12, respectively. However, with these numbers, many other models also get competitive results. When the number of hidden units is 6, 14, 16, 19, 24, 26, 35, 36 and 39, the lowest rate is 0.14 which is only a little higher than 0.13 so it can still be regarded as good models. As to the average rate, the model with 9 hidden neurons gets the lowest one which is 0.2085. But the average of all models is only 0.223, which means that there is little difference between models when only accuracy is considered. So there is no ubiquitous principle for the relationship between the number of hidden neurons and the accuracy of a model. However, computation time is also very important to neural network research. More hidden neurons can lead to more computation time. Thus, if some models produce the same accuracy, the one with less hidden neurons is preferred. In our experiments, the network with 9 hidden neurons wins out in most cases (Shown in Table 5). So this model is chosen as the most suitable for the German credit dataset in our experiments. D. Summary In the first round of experiments, the 800: 100: 100 combinations get the highest accuracy so this ratio is most suitable for building an acceptable model. After that, we use our Average Random Choosing method to optimize the dataset. The ratio of approved/rejected instances in German dataset, 7:3, is precisely implemented in the datasets for training, validation and testing. Results show that our new method can remarkably enhance the accuracy and AUC value, compared with the traditional methods. Finally, models with 9 hidden units perform best among all models, in consideration of high accuracy and low computational time. Also we find an interesting relationship between number of hidden neurons and validation accuracy: the more hidden units a model has, the higher accuracy it may get when validated. Compared with the results in other relevant articles with the same benchmark dataset, our model achieves a high accuracy of 87%, which is almost higher by 5% than the best result reported in the relevant literature so far. Our best model contains 9 hidden neurons, using our Average Random Choosing method. The ratio of training-validation-test data is 800:100:100. If we take validation results into consideration, the highest accuracy reaches 92%, which is almost 10% higher than the best result from existing models. It is more interesting when checking the validation error rates. As validation data is also a kind of test data (but with a different purpose), the error rate of validation is proper to reflect the prediction ability. It is always higher than accuracy of test data because a training process will not stop until a validation gets high accuracy. In our experiments, the accuracy of validation can reach almost 0.92 with 38 hidden units in the model. It is 0.05 higher than the best result with test data. Although this value is not as objective as the accuracy from pure test data, it indicates that MLP model has the ability of rating credit application more precisely. Also, there is an interesting tendency found in the validation dataset. As the number of hidden units gets larger, this error rates seems to be lower. It is shown in Fig. 5. V. CONCLUSIONS In this paper, we designed a new instance selection method called Average Random Choosing method. It is used to solve highly imbalanced dataset problems. Experiments demonstrate that this method can improve MLP model accuracy in some extent. It could also be used in other dataset and real world problems. We also designed a MLP model for credit rating with high accuracy compared with other works that utilized the same dataset. Our experiment test 36 models with different number of hidden nodes, and 3 kinds of training with distinctive ratio of training-validation-test instances. From the results of our experiments, the accuracy of classification has a trend of declining with raising number of hidden nodes. The most valuable contribution of this paper is presenting a MLP model with high credit rating accuracy. Fig. 5. Tendency of model’s error rates when numbers of hidden units increase 0.05 0.10 0.15 0.20 0.25 0.30 6 9 12 15 18 21 24 27 30 33 36 39 average lowest ValidationError Number of hidden neurons
  • 8.
    IT in Industry,vol. 3, no. 1, 2015 Published online 31-Mar-2015 ISSN (Print): 2204-0595 Copyright © Authors 8 ISSN (Online): 2203-1731 TABLE V. TEST RESULTS OF GERMEN CREDIT DATASET 800:100:100 900:50:50 600:200:200 Average Random Choosing method Number of hidden neurons Lowest error rate Average error rate Lowest error rate Average error rate Lowest error rate Average error rate Lowest test error rate Average error rate lowest validate error rate average validate error rate 6 0.21 0.2415 0.21 0.2925 0.245 0.273 0.14 0.2145 0.1265 0.1502 7 0.21 0.251 0.2 0.251 0.225 0.273 0.15 0.211 0.1228 0.1441 8 0.19 0.239 0.21 0.2765 0.22 0.2615 0.17 0.2215 0.1231 0.1438 9 0.18 0.2385 0.18 0.2315 0.245 0.27675 0.13 0.2085 0.1284 0.1472 10 0.18 0.2295 0.2 0.243 0.24 0.27075 0.13 0.221 0.1270 0.1471 11 0.2 0.242 0.18 0.2635 0.225 0.26275 0.16 0.223 0.1234 0.1439 12 0.21 0.246 0.19 0.2675 0.23 0.26575 0.13 0.225 0.1297 0.1491 13 0.2 0.256 0.21 0.2705 0.2 0.26625 0.16 0.2225 0.1163 0.1431 14 0.21 0.258 0.19 0.258 0.205 0.26525 0.14 0.2105 0.1113 0.1407 15 0.17 0.2595 0.21 0.26 0.24 0.2715 0.16 0.219 0.1103 0.1422 16 0.22 0.246 0.23 0.26 0.23 0.266 0.14 0.2085 0.1245 0.1399 17 0.19 0.248 0.21 0.245 0.235 0.2745 0.19 0.2415 0.1196 0.1433 18 0.21 0.2595 0.21 0.293 0.21 0.26725 0.17 0.221 0.1022 0.1342 19 0.2 0.255 0.24 0.277 0.235 0.28 0.14 0.2135 0.1124 0.1407 20 0.21 0.2585 0.21 0.262 0.22 0.2655 0.16 0.2215 0.1006 0.1402 21 0.22 0.256 0.21 0.2835 0.24 0.2665 0.16 0.215 0.1207 0.1368 22 0.2 0.2545 0.22 0.2985 0.23 0.26475 0.15 0.2195 0.1217 0.1351 23 0.19 0.259 0.21 0.2675 0.24 0.27075 0.18 0.2265 0.1143 0.1353 24 0.19 0.26 0.2 0.26 0.245 0.27375 0.14 0.215 0.1249 0.1377 25 0.22 0.257 0.21 0.2845 0.24 0.27175 0.15 0.223 0.1007 0.1394 26 0.22 0.2725 0.19 0.276 0.235 0.28575 0.14 0.224 0.0884 0.1310 27 0.2 0.261 0.22 0.287 0.24 0.2735 0.17 0.2175 0.1227 0.1380 28 0.21 0.2625 0.23 0.2755 0.235 0.2755 0.15 0.2235 0.1123 0.1345 29 0.21 0.262 0.19 0.266 0.225 0.273 0.15 0.2265 0.1100 0.1339 30 0.23 0.2765 0.23 0.278 0.21 0.2665 0.15 0.2275 0.0916 0.1304 31 0.24 0.2715 0.23 0.2775 0.25 0.28575 0.18 0.228 0.0892 0.1283 32 0.22 0.265 0.2 0.2775 0.245 0.272 0.18 0.234 0.1013 0.1295 33 0.23 0.2755 0.22 0.273 0.245 0.27725 0.17 0.2345 0.1070 0.1287 34 0.22 0.272 0.22 0.281 0.24 0.28575 0.17 0.228 0.1023 0.1285 35 0.22 0.2675 0.22 0.2885 0.235 0.28225 0.14 0.229 0.0932 0.1243 36 0.24 0.2835 0.19 0.285 0.245 0.2895 0.14 0.2275 0.1055 0.1311 37 0.22 0.278 0.23 0.3175 0.225 0.29125 0.16 0.2265 0.0963 0.1258 38 0.17 0.28 0.22 0.301 0.21 0.27825 0.19 0.2385 0.0801 0.1324 39 0.24 0.294 0.2 0.284 0.235 0.284 0.14 0.2375 0.0854 0.1215 Best 0.17 0.2295 0.18 0.2315 0.2 0.2615 0.13 0.2085 0.0801 0.1215 Average 0.2082 0.25988 0.20941 0.27389 0.23161 0.27375 0.1553 0.2231 0.1102 0.1368 Further works may focus on feature selection for neural networks, as attributes in dataset are not always relevant to classification feature. The elimination of redundant features is an important task in data mining. Also it should be noticed that the performance of credit rating model is always evaluated by accuracies. Other statistic methods, such as F- score, standard deviation (SD) and others should be used to help choose out better credit rating models. ACKNOWLEDGMENT This work is supported by National Key Technology R&D Program of China during the 12th Five-Year Plan Period (Project number: 2012BAJ18B07). REFERENCES [1] L.C. Thomas, D.B. Edelman, and J.N. Crook, “Credit Scoring and Its Applications,” 2002: SIAM: Philadelphia, PA. [2] H.L. Jensen, “Using Neural Networks for Credit Scoring,” Managerial Finance, vol. 18, no. 6, pp. 15, 1992. [3] B. Baesens, et al., “Benchmarking State-of-the-Art Classification Algorithms for Credit Scoring,” The Journal of the Operational Research Society, vol. 54, no. 6, pp. 627-635, 2003. [4] A.I. Marqués, V. García, and J.S. Sánchez, “Exploring the behaviour of base classifiers in credit scoring ensembles,” Expert Systems with Applications, vol. 39, no. 11, pp. 10244-10250, 2012. [5] K. Bache and M. Lichman. {UCI} Machine Learning Repository. 2013; Available from: http://archive.ics.uci.edu/ml.
  • 9.
    IT in Industry,vol. 3, no. 1, 2015 Published online 31-Mar-2015 ISSN (Print): 2204-0595 Copyright © Authors 9 ISSN (Online): 2203-1731 [6] A. Khashman, “Neural networks for credit risk evaluation: Investigation of different neural models and learning schemes,” Expert Systems with Applications, vol. 37, no. 9, pp. 6233-6239, 2010. [7] A. Khashman, “A Modified Backpropagation Learning Algorithm With Added Emotional Coefficients,” IEEE Transactions on Neural Networks, vol. 19, no. 11, pp. 1896-1909, 2008. [8] A. Khashman, “Credit risk evaluation using neural networks: Emotional versus conventional models,” Applied Soft Computing, vol. 11, no. 8, pp. 5477-5484, 2011. [9] A. Marcano-Cedeño, et al., “Artificial metaplasticity neural network applied to credit scoring,” International Journal of Neural Systems, vol. 21, no. 4, pp. 311-317, 2011. [10] T.-S. Lee and I.F. Chen, “A two-stage hybrid credit scoring model using artificial neural networks and multivariate adaptive regression splines,” Expert Systems with Applications, vol. 28, no. 4, pp. 743- 752, 2005. [11] C.-F. Tsai and J.-W. Wu, “Using neural network ensembles for bankruptcy prediction and credit scoring,” Expert Systems with Applications, vol. 34, no. 4, pp. 2639-2649, 2008. [12] A.B. Hens and M.K. Tiwari, “Computational time reduction for credit scoring: An integrated approach based on support vector machine and stratified sampling method,” Expert Systems with Applications, vol. 39, no. 8, pp. 6774-6781, 2012. [13] B.-W. Chi and C.-C. Hsu, “A hybrid approach to integrate genetic algorithm into dual scoring model in enhancing the performance of credit scoring model,” Expert Systems with Applications, vol. 39, no. 3, pp. 2650-2661, 2012. [14] S.-T. Luo, B.-W. Cheng, and C.-H. Hsieh, “Prediction model building with clustering-launched classification and support vector machines in credit scoring,” Expert Systems with Applications, vol. 36, no. 4, pp. 7562-7566, 2009. [15] Y. Peng, et al., “A Multi-criteria Convex Quadratic Programming model for credit data analysis,” Decision Support Systems, vol. 44, no. 4, pp. 1016-1030, 2008. [16] J. Xiao, et al., “Dynamic classifier ensemble model for customer classification with imbalanced class distribution,” Expert Systems with Applications, vol. 39, no. 3, pp. 3668-3675, 2012. [17] I. Brown and C. Mues, “An experimental comparison of classification algorithms for imbalanced credit scoring data sets,” Expert Systems with Applications, vol. 39, no. 3, pp. 3446-3453, 2012. [18] M. Khashei, et al., “A bi-level neural-based fuzzy classification approach for credit scoring problems,” Complexity, vol. 18, no. 6, pp. 46-57, 2013. [19] G. Wang, et al., “Two credit scoring models based on dual strategy ensemble trees,” Knowledge-Based Systems, vol. 26, pp. 61-68, 2012. [20] R. Setiono, B. Baesens, and C. Mues, “Rule extraction from minimal neural networks for credit card screening,” International Journal of Neural Systems, vol. 21, no. 4, pp. 265-276, 2011. [21] L. Yu, et al., “Credit risk evaluation using a weighted least squares SVM classifier with design of experiment for parameter selection,” Expert Systems with Applications, vol. 38, no. 12, pp. 15392-15399, 2011. [22] S. Vukovic, et al., “A case-based reasoning model that uses preference theory functions for credit scoring,” Expert Systems with Applications, vol. 39, no. 9, pp. 8389-8395, 2012. [23] Y. Ping and L. Yongheng, “Neighborhood rough set and SVM based hybrid credit scoring classifier,” Expert Systems with Applications, vol. 38, no. 9, pp. 11300-11304, 2011. [24] G.B. Gonen, M. Gonen, and F. Gurgen, “Probabilistic and discriminative group-wise feature selection methods for credit risk analysis,” Expert Systems with Applications, vol. 39, no. 14, pp. 11709-11717, 2012. [25] A.I. Marqués, V. García, and J.S. Sánchez, “On the suitability of resampling techniques for the class imbalance problem in credit scoring,” Journal of the Operational Research Society, vol. 64, no. 7, pp. 1060-1070, 2013. [26] S.S. Haykin, Neural networks : a comprehensive foundation / Simon Haykin, 1999: Upper Saddle River, N.J. : Prentice Hall, c1999. 2nd ed. [27] D. West, “Neural network credit scoring models,” Computers and Operations Research, vol. 27, no. 11-12, pp. 1131-1152, 2000. [28] T. Karkkainen and E. Heikkola, “Robust formulations for training multilayer perceptrons,” Neural Computation, vol. 16, no. 4, pp. 837- 862, 2004. [29] L. Yuchun, “Handwritten digit recognition using k nearest-neighbor, radial-basis function, and backpropagation neural networks,” Neural Computation, vol. 3, no. 3, pp. 440-449, 1991. [30] T. Fawcett, “An introduction to ROC analysis,” Pattern recognition letters, vol. 27, no. 8, pp. 861-874, 2006. [31] X.-W. Chen and M. Wasikowski, “FAST: a roc-based feature selection metric for small samples and imbalanced data classification problems,” in Proceedings of the 14th ACM SIGKDD international conference on Knowledge discovery and data mining, 2008, ACM: Las Vegas, Nevada, USA. pp. 124-132. [32] R. Wang and K. Tang, “Feature Selection for Maximizing the Area Under the ROC Curve,” in Proceedings of the 2009 IEEE International Conference on Data Mining Workshops, 2009, IEEE Computer Society, pp. 400-405. [33] R. Wang and K. Tang, “Feature selection for MAUC-oriented classification systems,” Neurocomputing, vol. 89, pp. 39-54, 2012. [34] J. Fogarty, R.S. Baker, and S.E. Hudson, “Case studies in the use of ROC curve analysis for sensor-based estimates in human computer interaction,” in Proceedings of Graphics Interface 2005, Canadian Human-Computer Communications Society: Victoria, British Columbia. pp. 129-136.