Downloaded 409 times
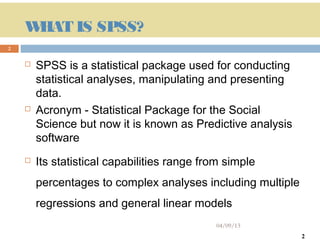
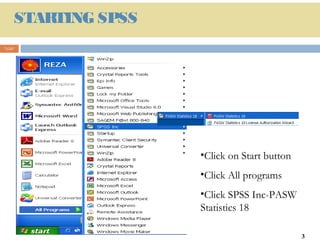
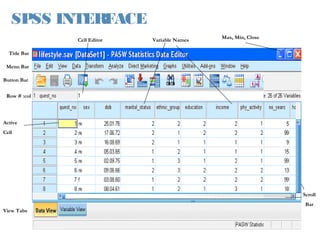
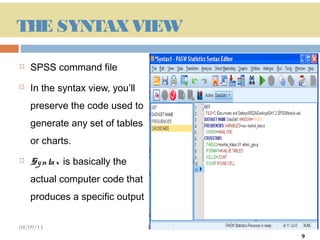
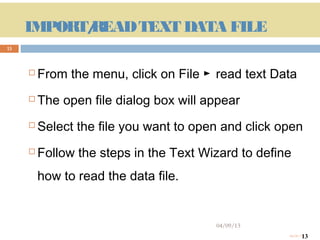

This document provides an introduction and overview of SPSS (Statistical Package for the Social Sciences), a statistical software package used for data management and analysis. It describes the key components of SPSS including the data editor for entering and viewing data, the output window for viewing analysis results, the syntax window for viewing code, and menus for accessing commands. It also provides basic instructions for starting SPSS, opening data files from various sources, and quitting the program.


![SPSS Lecture_1 [Autosaved].pptx](https://cdn.slidesharecdn.com/ss_thumbnails/spsslecture1autosaved-231105165336-b29c7b18-thumbnail.jpg?width=640&height=640&fit=bounds)


