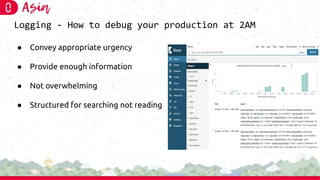
Download as PDF, PPTX


![Tracing SDK Concepts
● Sampler , controls the number of traces capture and send to backend
○ Sampling Decision Values [ DROP | RECORD_ONLY |
RECORD_AND_SAMPLE ]
○ SDK Built In Samplers [ AlwaysOn | AlwaysOff |
TraceIDRatioBased ]
● SpanProcessor , hook for span start and stop invocation
○ SDK Built In Processor [ ExportFormatConverter | Batcher ]
○ Only invoked when isRecording is true
● SpanExporter, defines interfaces for specific backend exporters (ex :
Jaeger, OTLP, Lighstep, Datadog)](https://image.slidesharecdn.com/introductiontoopentelemetry-211218024936/85/Introduction-to-Open-Telemetry-as-Observability-Library-15-320.jpg)
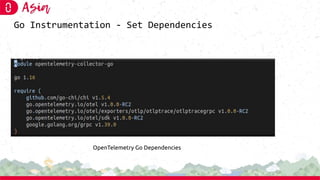
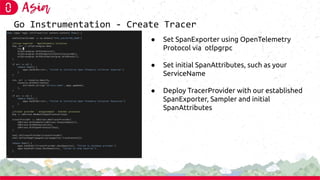
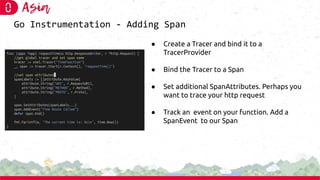
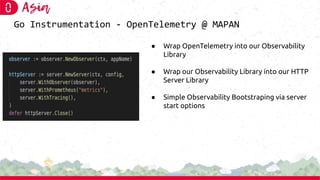


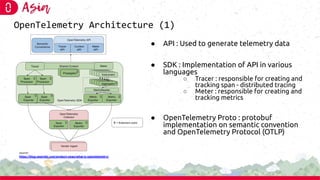
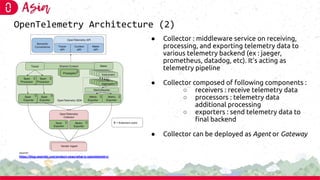
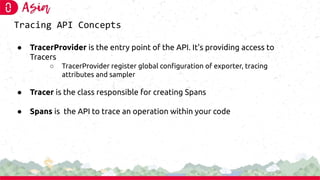
- OpenTelemetry is a unified observability library that provides APIs, SDKs, and middleware for generating and exporting traces, metrics, and logs. It combines OpenCensus and OpenTracing into a single open source project. - The OpenTelemetry architecture includes APIs, SDKs, a collector, and exporters. The SDK implements the API to generate traces and metrics. The collector receives telemetry data from the SDK and exports it to backends like Jaeger and Prometheus. - The document demonstrates how to instrument a Go application with OpenTelemetry tracing by creating spans from HTTP requests and exporting them to Jaeger for analysis.


![Jacob Marble [InfluxData] | Observability with InfluxDB IOx and OpenTelemetry...](https://cdn.slidesharecdn.com/ss_thumbnails/influxdbioxandopentelemetry-27-oct-2021jmarble-211022195239-thumbnail.jpg?width=640&height=640&fit=bounds)