Cloud-Native Monitoring
With Prometheus
Valentina Contenti
Kubernets Solutions Engineer
valentina@sighup.io
What is Prometheus?
Community Driven Open-source Monitoring and
Alerting stack, ships a time series database, an
alerting entity and a number of integration tools to
expose metrics.
Made for dynamic cloud environments.
What is Prometheus made for?
• Instrumentation for applications and
systems
• Metrics collection and storage
• Querying, alerting, dashboarding
What is Prometheus not made for?
• Logging or tracing
• Automatic anomaly detection
• Scalable or durable storage
A brief but distinguished history
Started in 2012 as a SoundCloud
internal project
Second project to join CNCF after
Kubernetes
Prometheus v1.0.0 released in 2016
Prometheus v2.0.0 released in 2017
Core features
• Simplicity + efficiency
• Dimensional data model
• Powerful query language - PromQL
• Service discovery integration
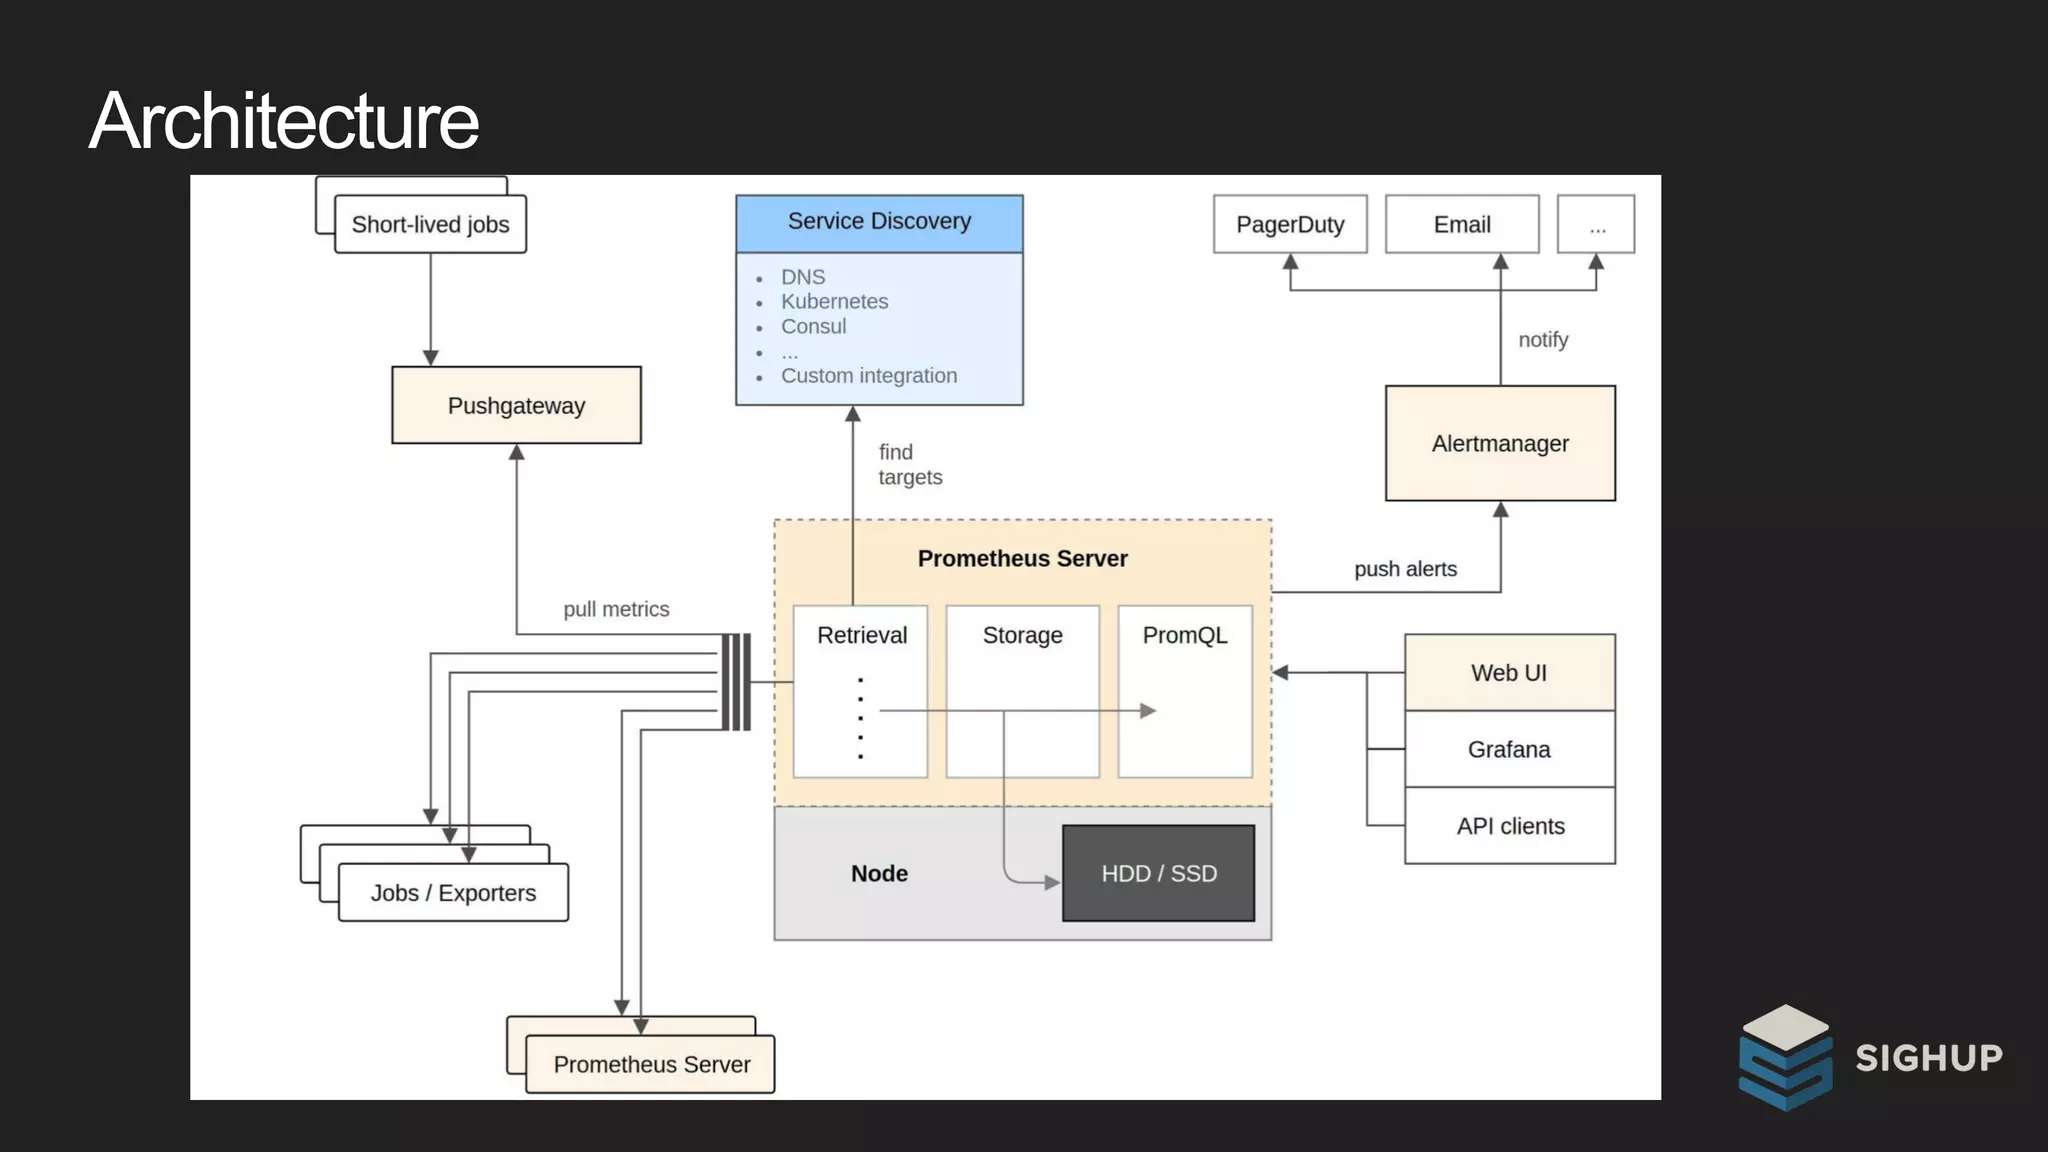
Architecture
Simplicity + efficiency:
• Local storage, no clustering
• 1 million+ samples/s
• Millions of series
• 1-2 bytes per sample
• HA by running two
• Go: static binary
Data model
https://prometheus.io/docs/concepts/data_model/
• Prometheus stores all data as time series: streams
of timestamped values belonging to the same metric
and the same set of labeled dimensions.
• Every time series is uniquely identified by its metric
name and optional key-value pairs called labels.
• The metric name specifies the general feature of a
system that is measured
Time series with labels
node_cpu_seconds_total{cpu="0",instance="demo.robustperception.io:9100",job="nod
e",mode="idle"} 14838327.84
metric name labels
• Flexible
• No hierarchy
• Explicit dimensions
Time series with labels
• Time series: tuple {time, value}
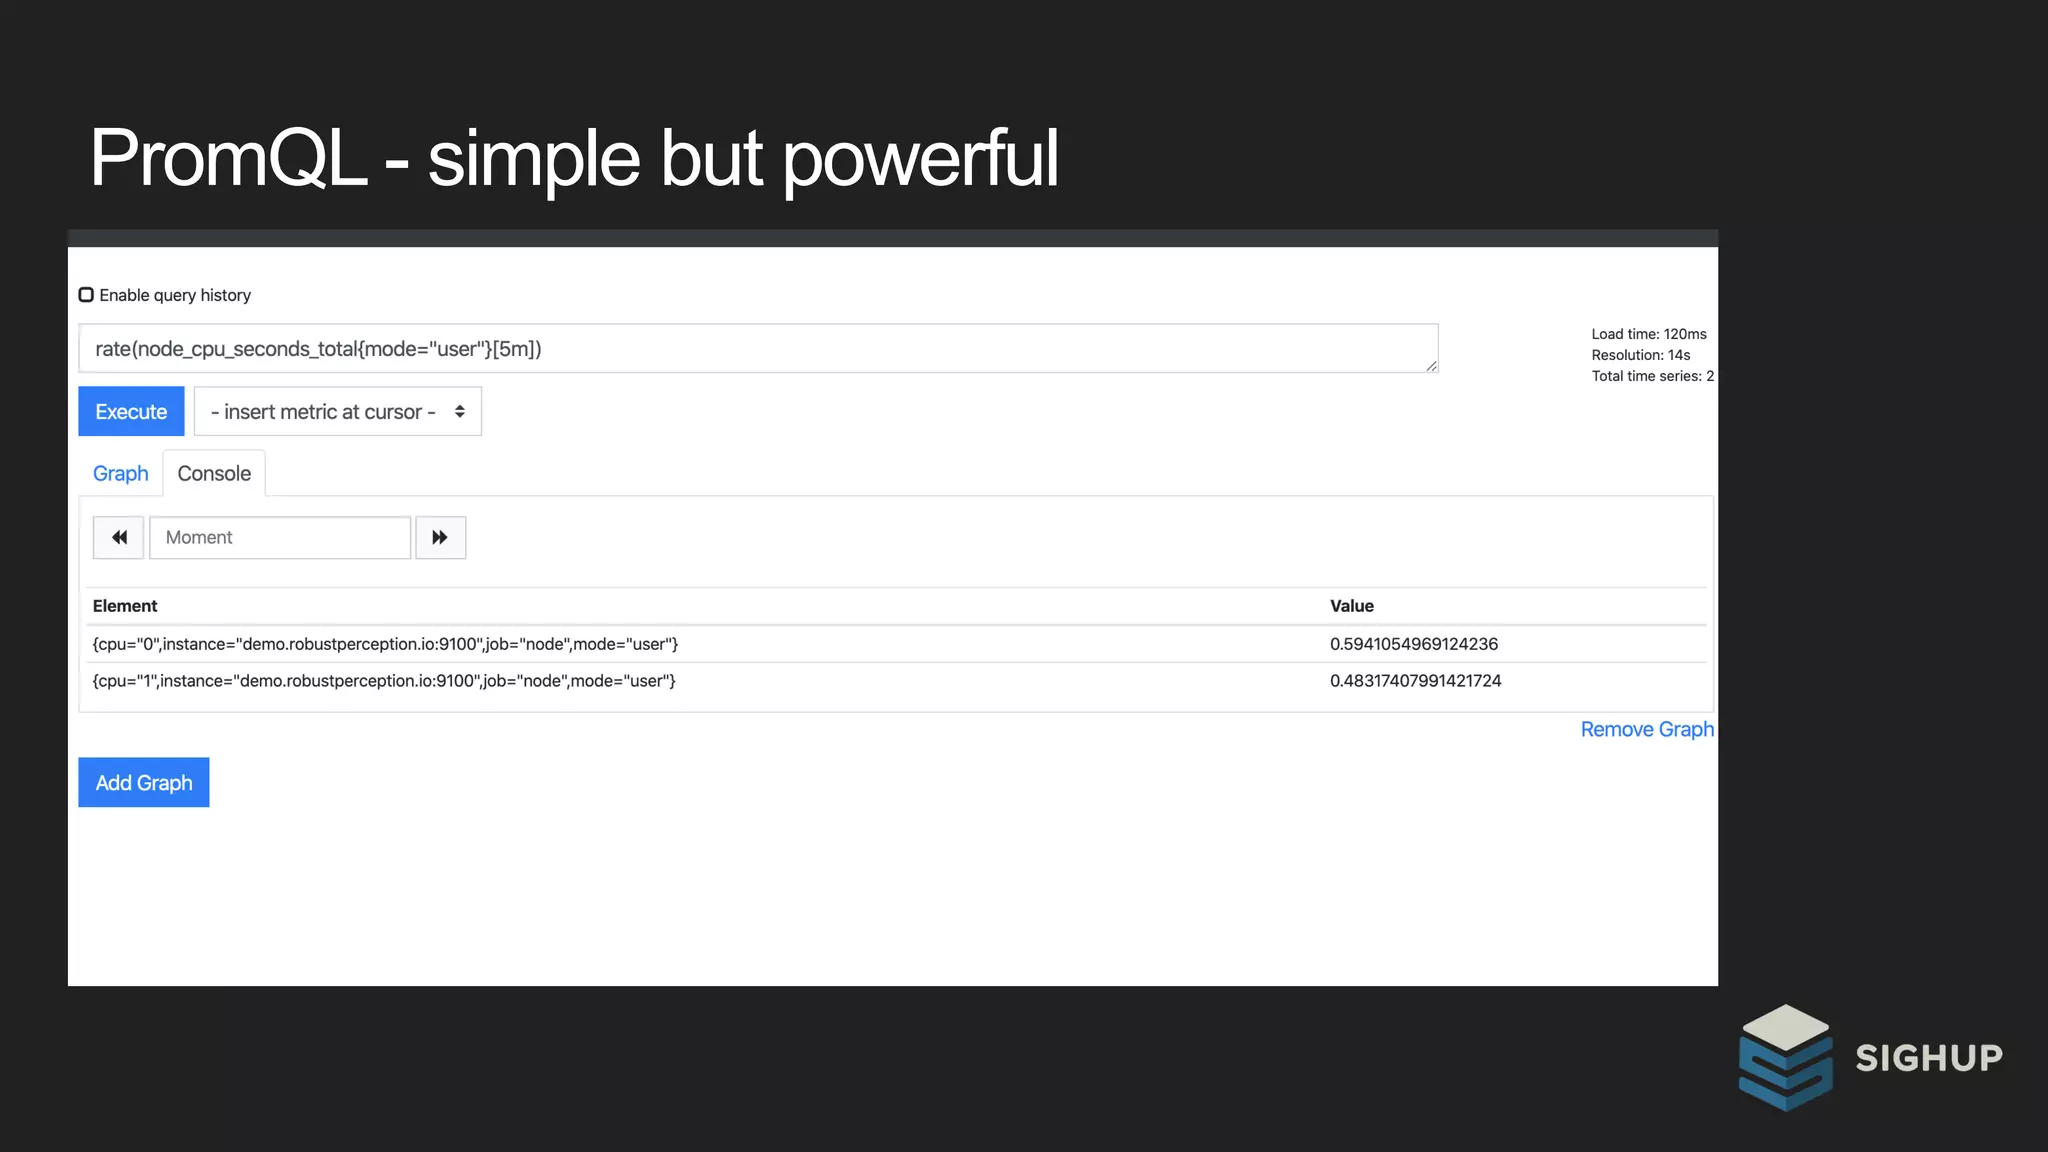
PromQL - simple but powerful
Queries in action
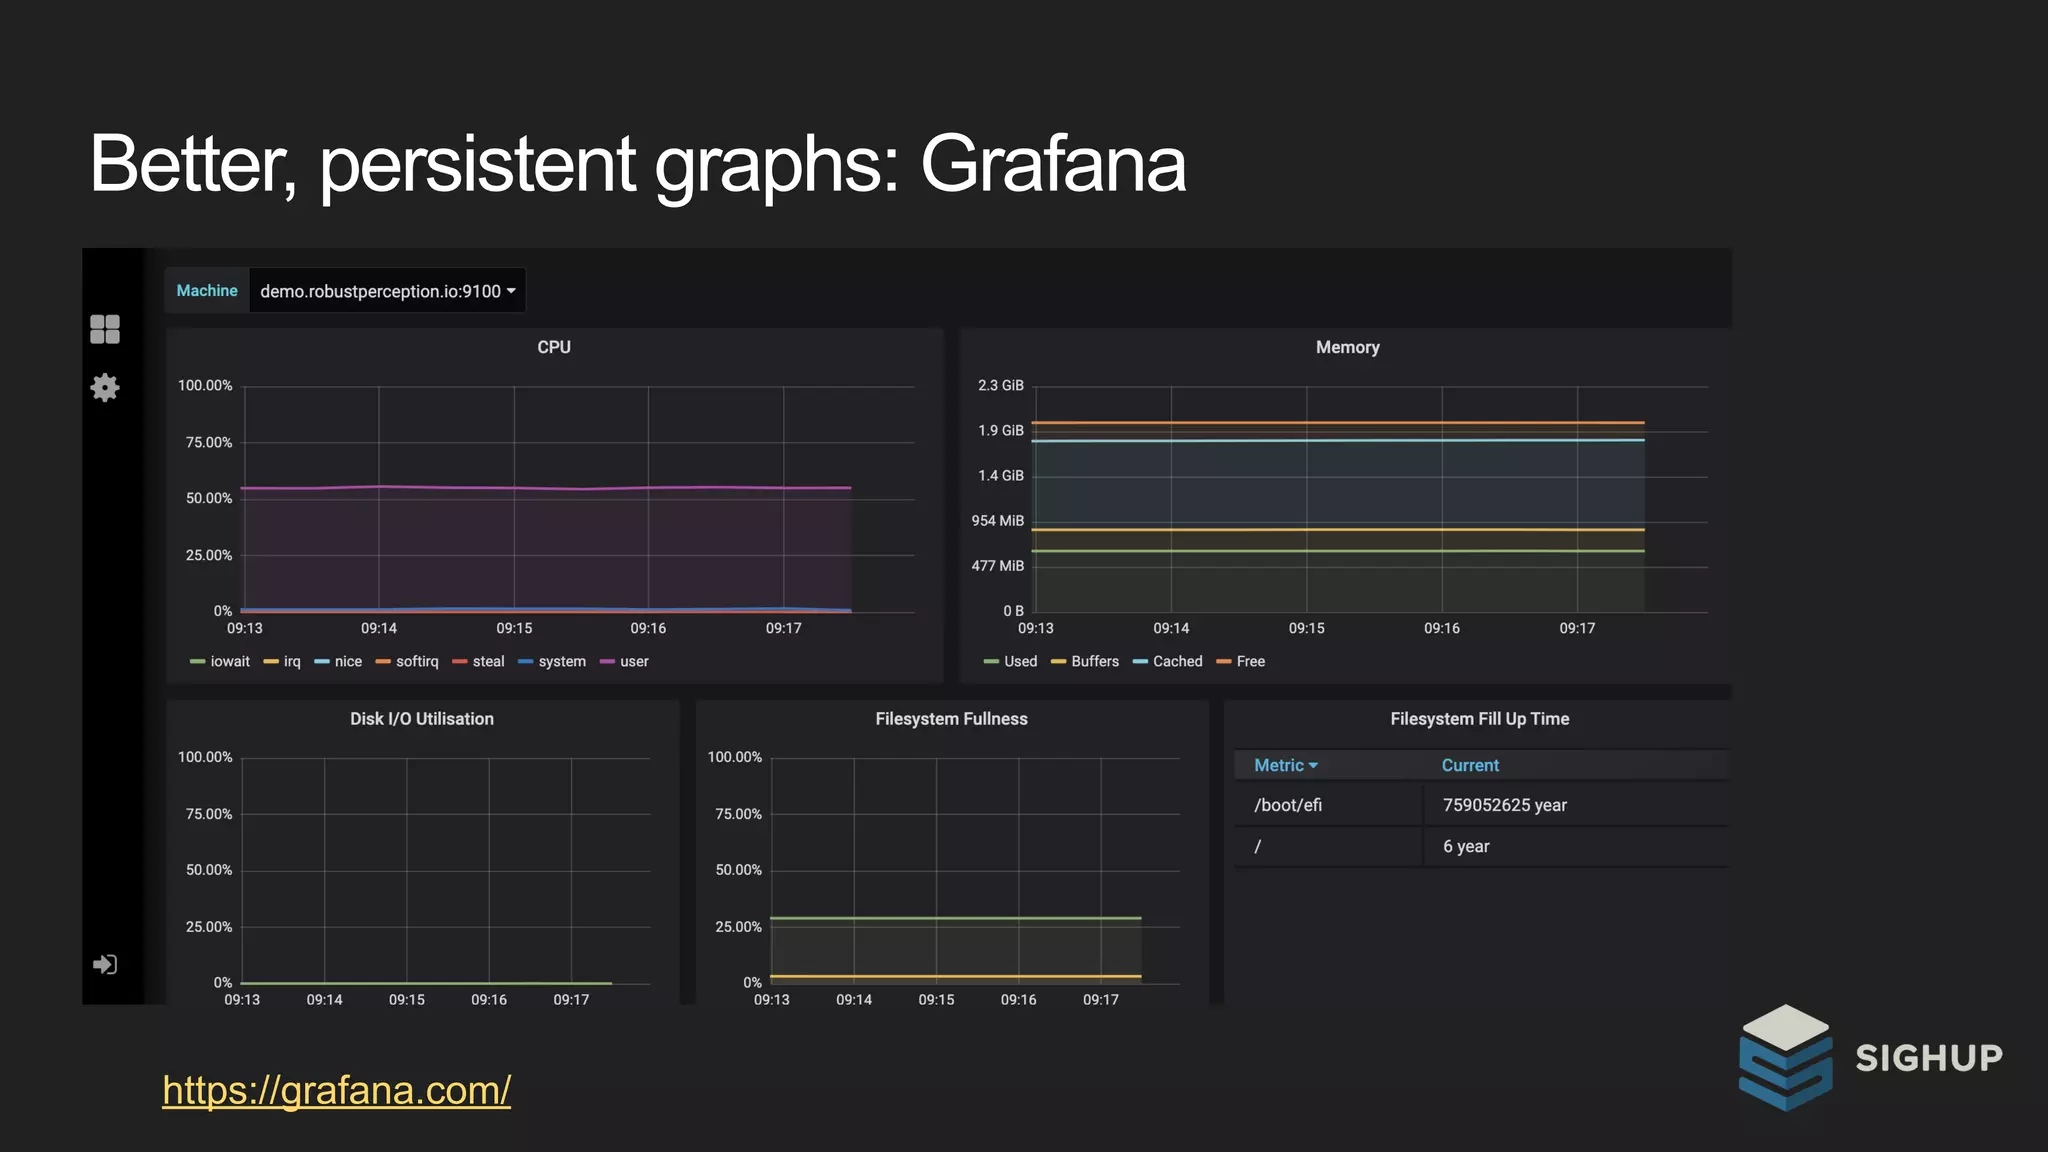
Better, persistent graphs: Grafana
https://grafana.com/
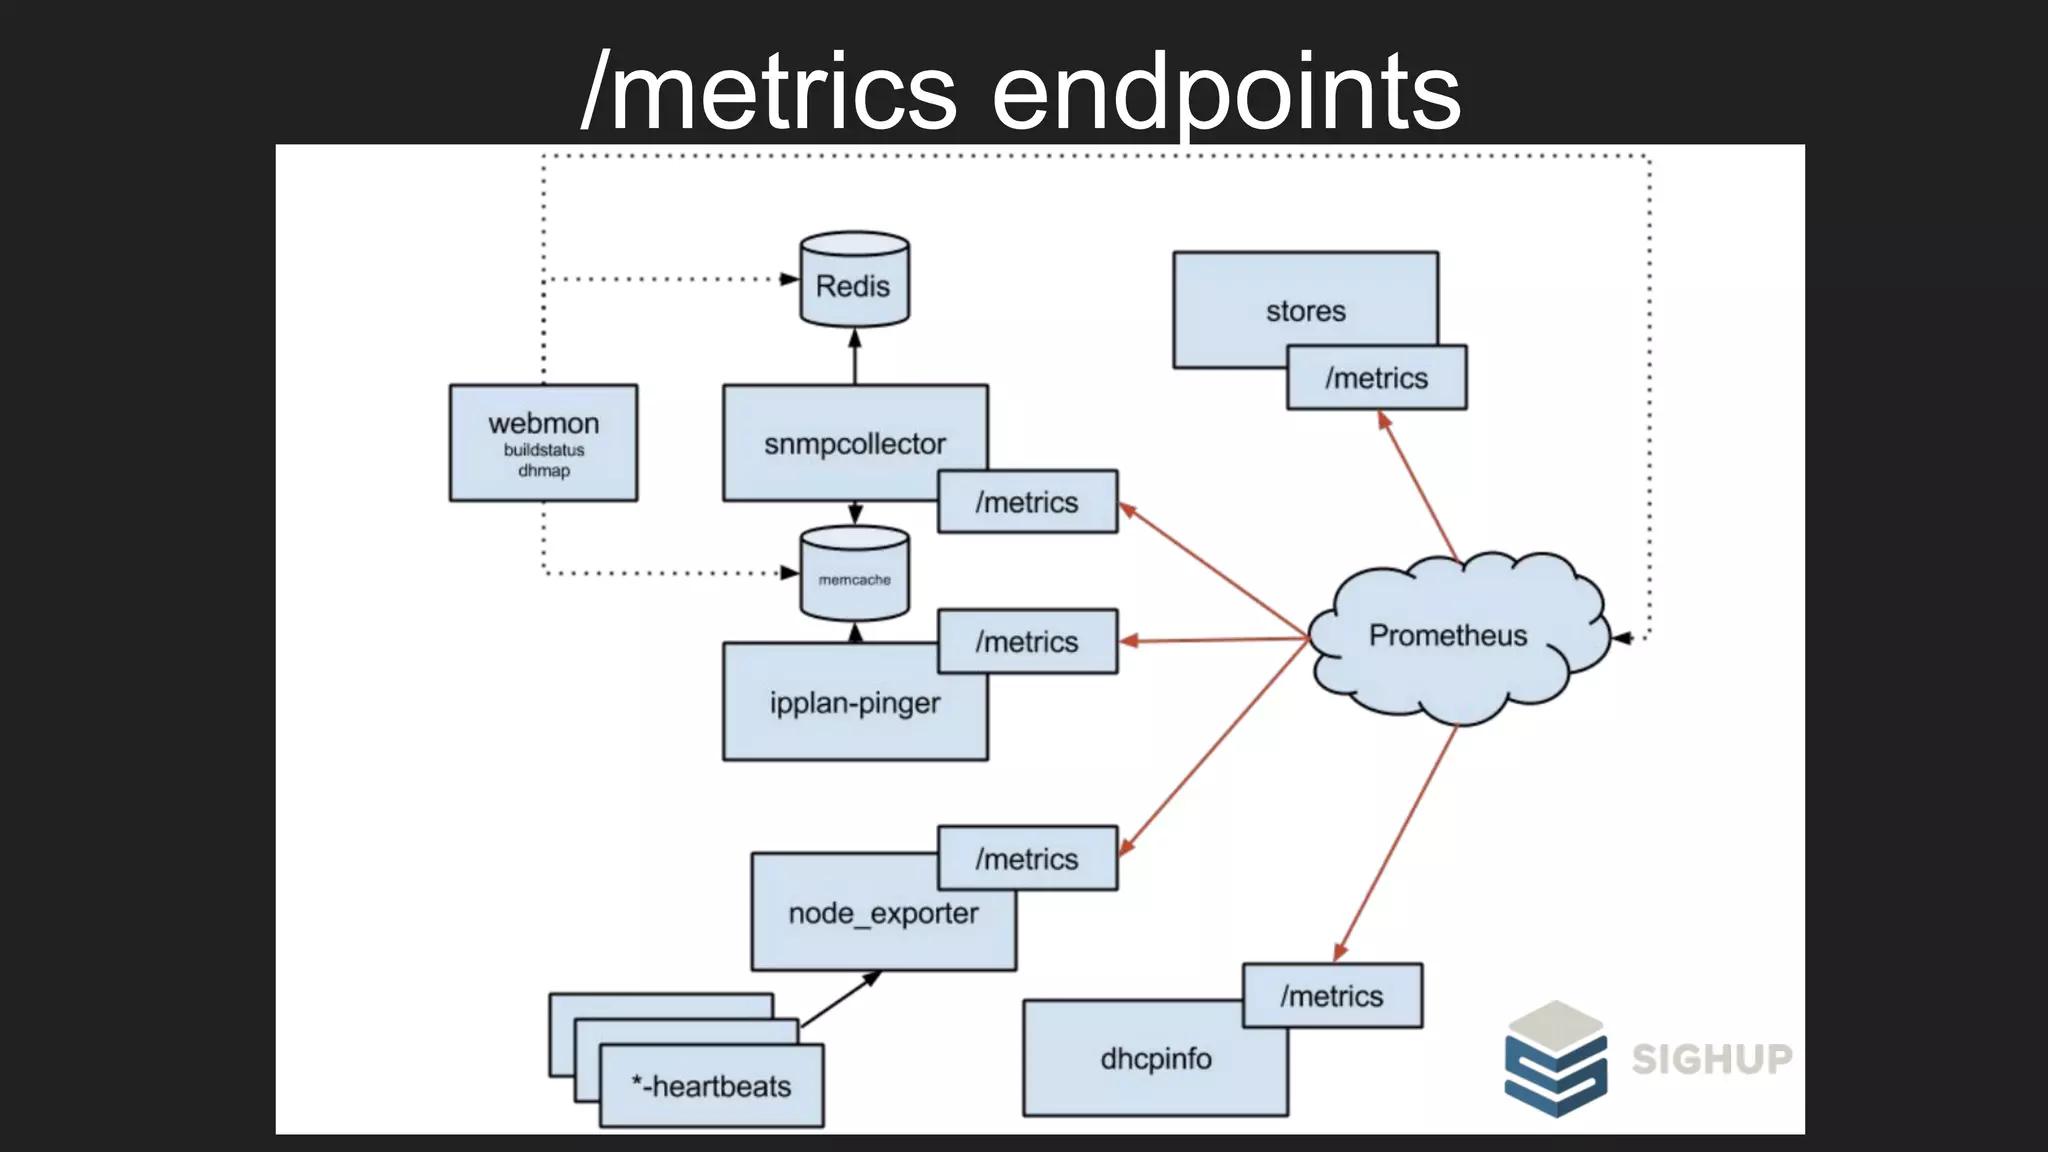
Pulling metrics
How do you expose those metrics?
• Exporters
• Language specific client libraries
• Service Discovery
/metrics endpoints
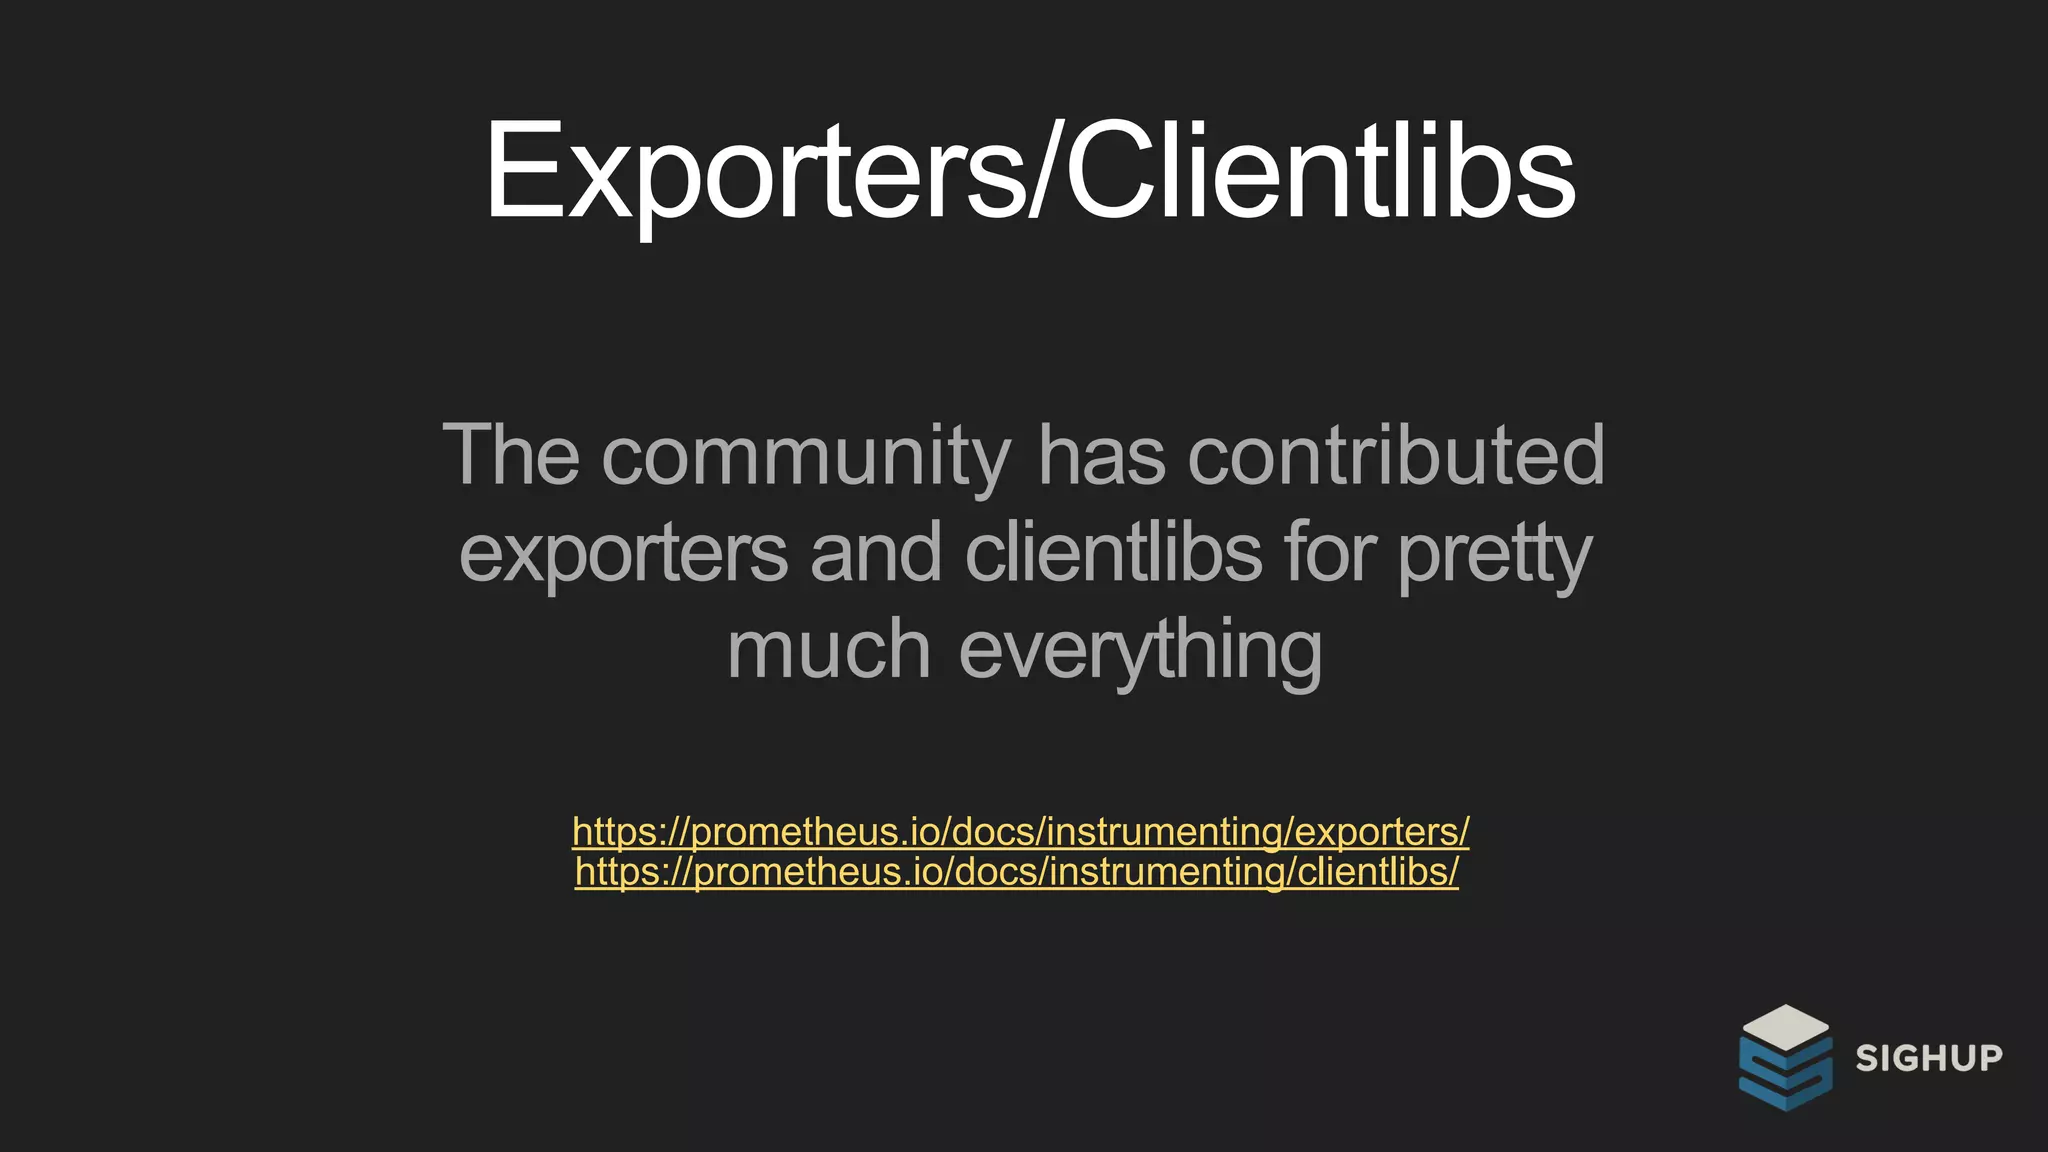
Exporters/Clientlibs
The community has contributed
exporters and clientlibs for pretty
much everything
https://prometheus.io/docs/instrumenting/exporters/
https://prometheus.io/docs/instrumenting/clientlibs/
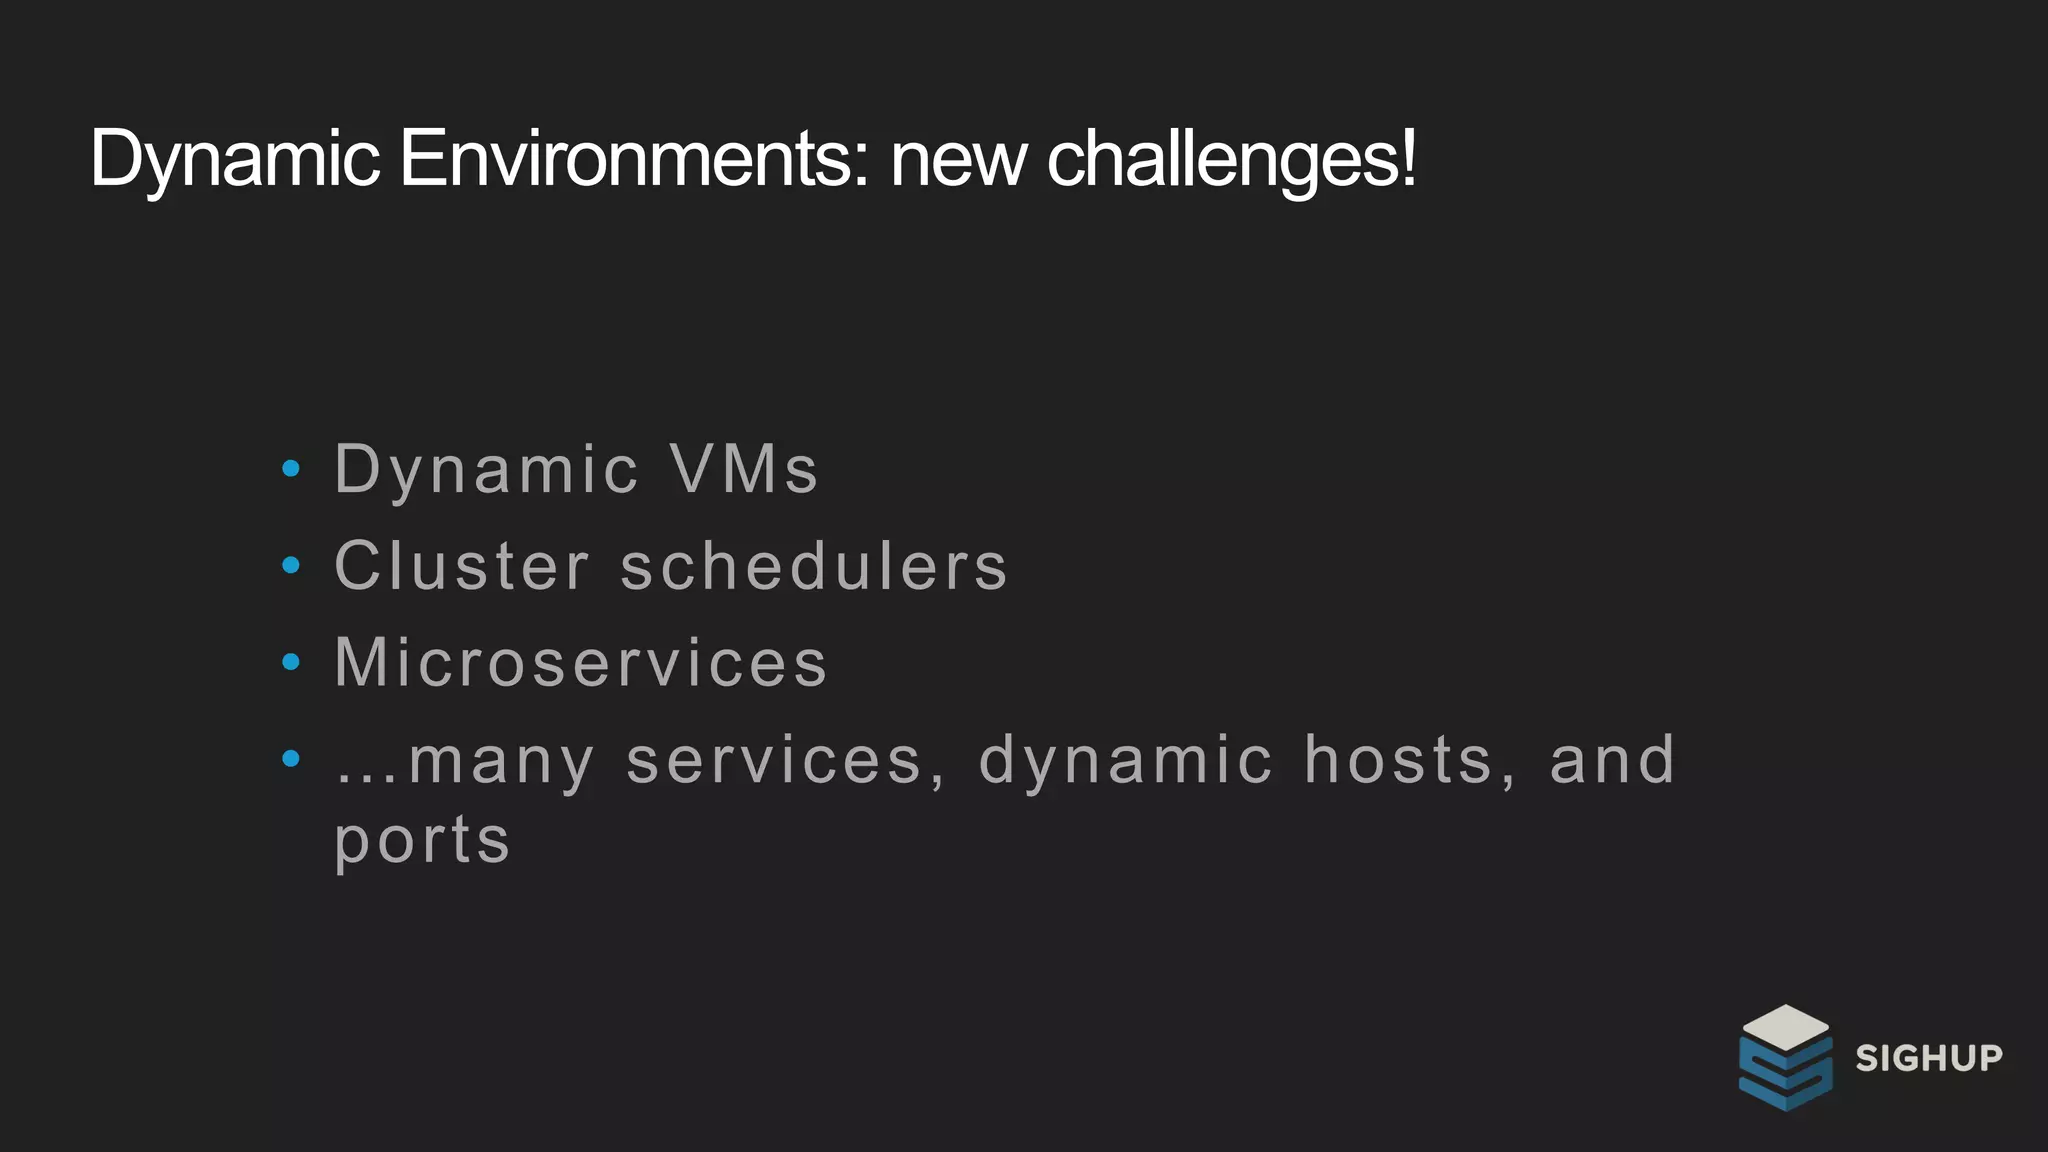
Dynamic Environments: new challenges!
• Dynamic VMs
• Cluster schedulers
• Microservices
• …many services, dynamic hosts, and
ports
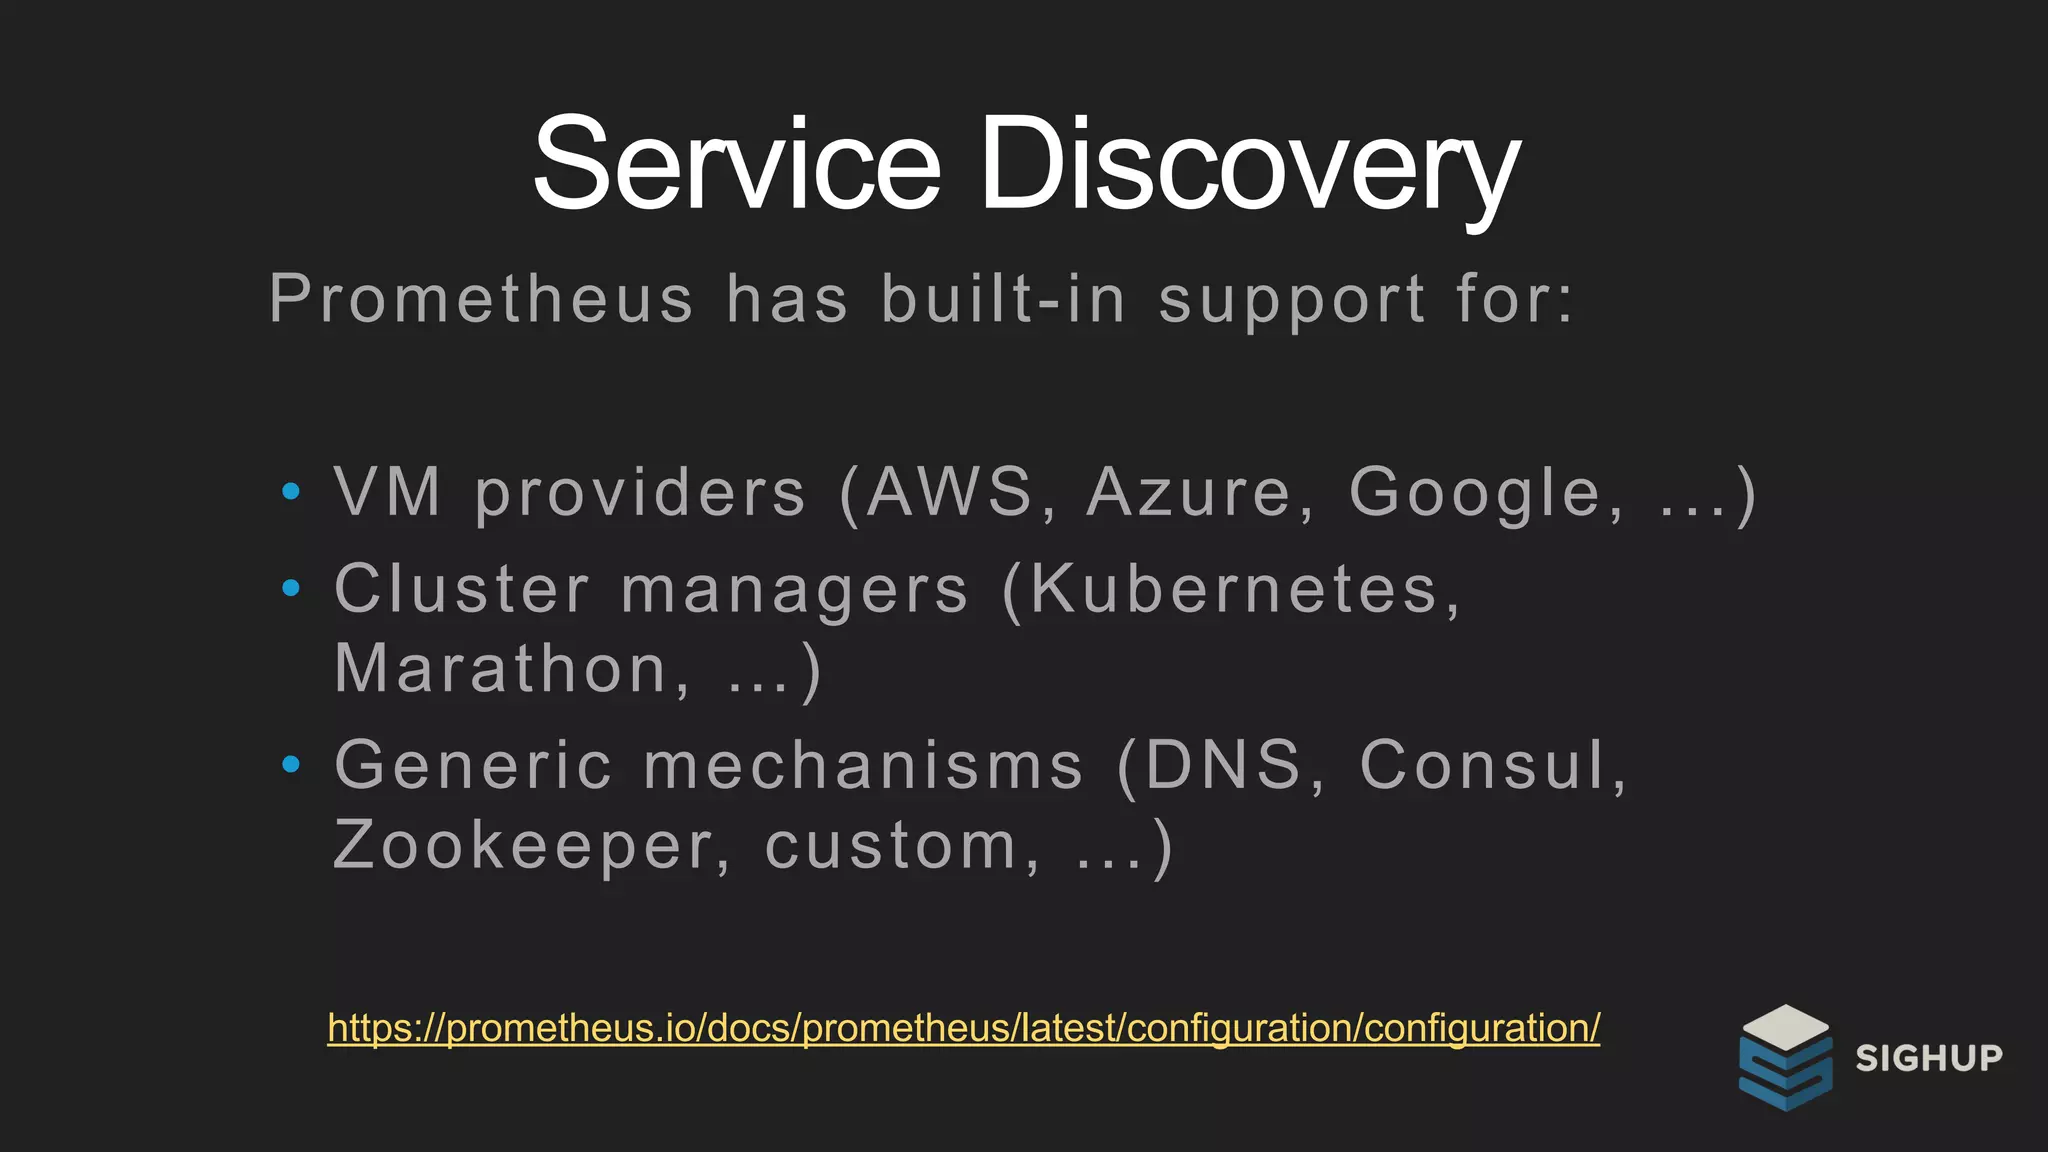
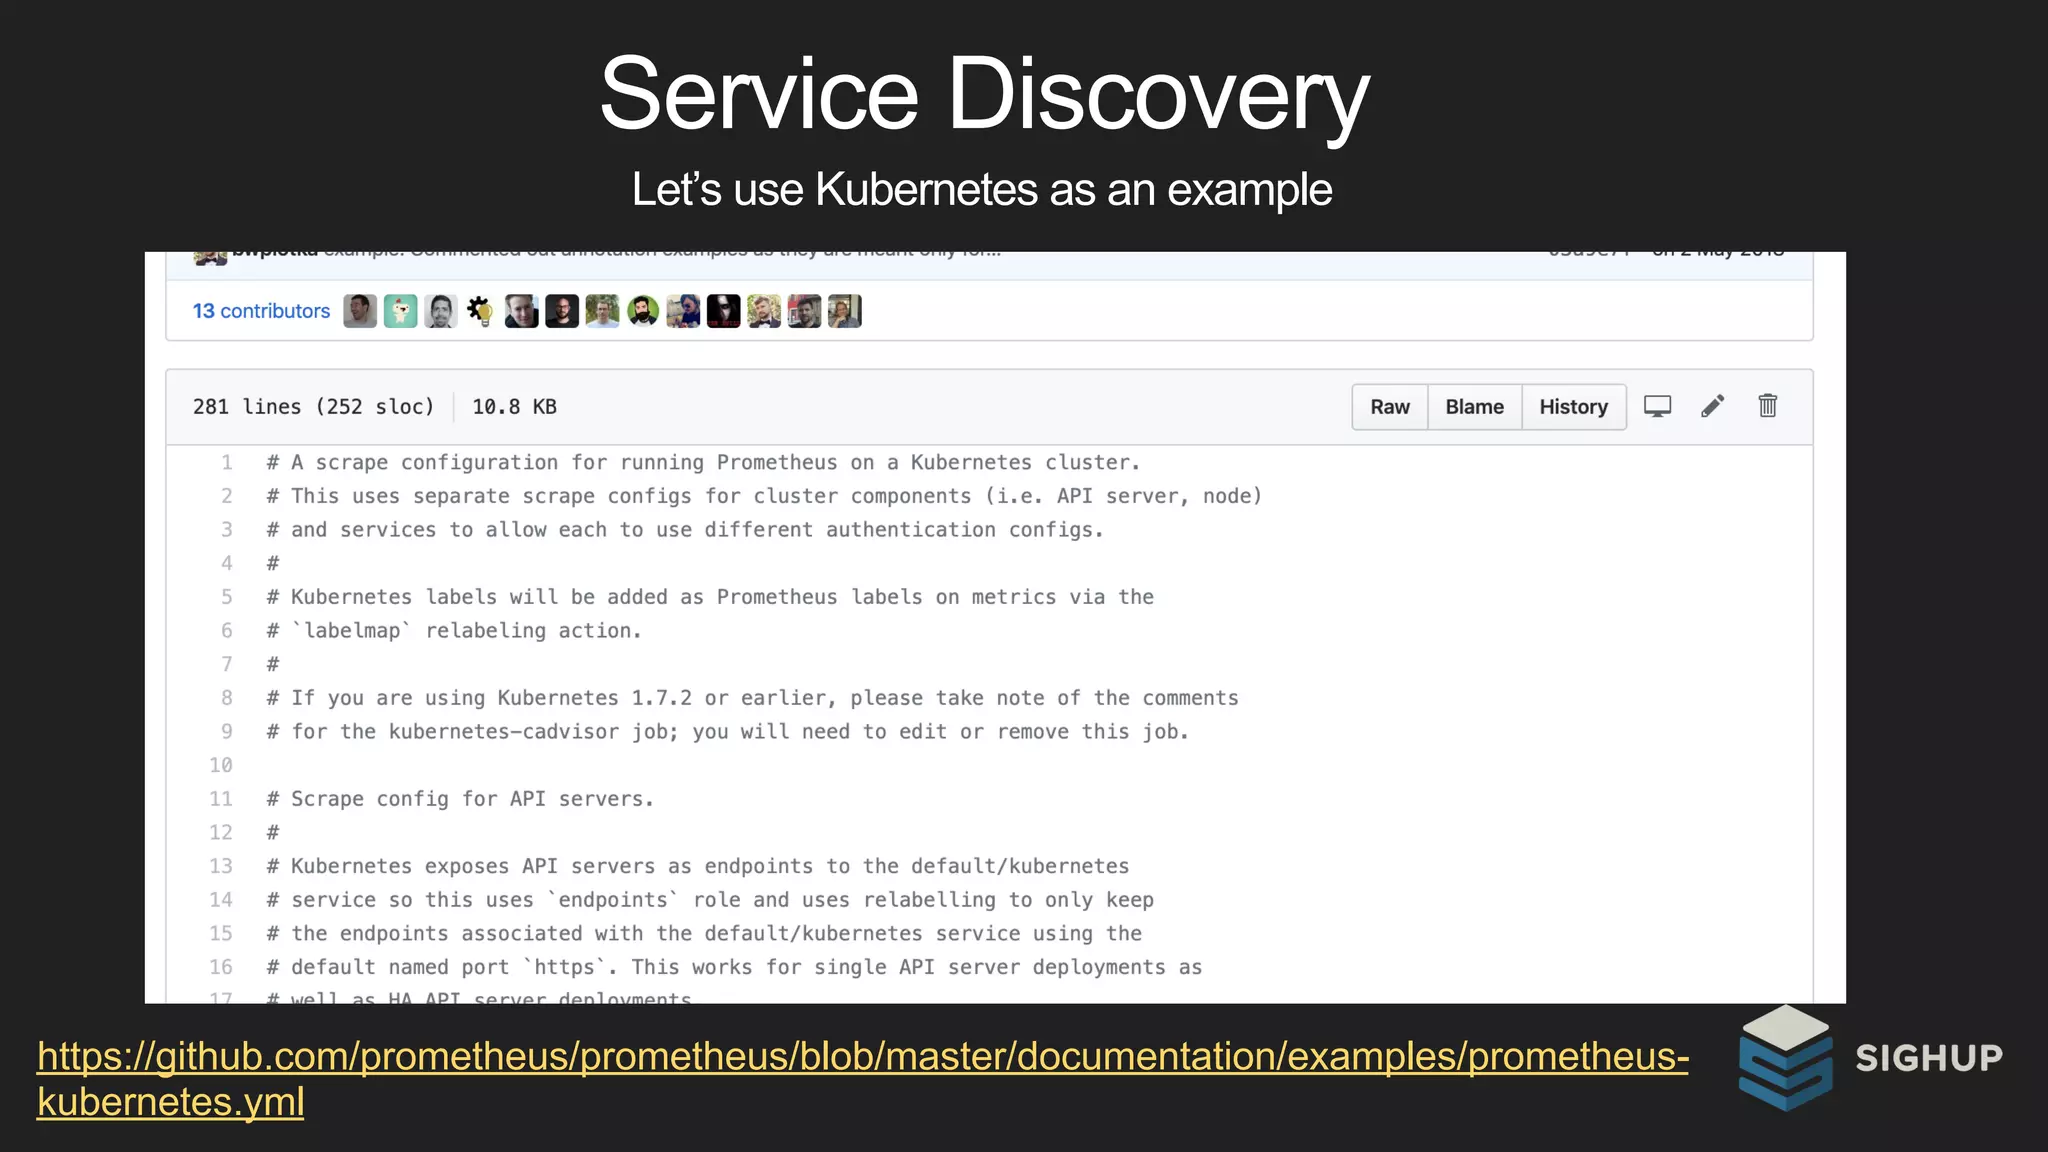
Service Discovery
https://prometheus.io/docs/prometheus/latest/configuration/configuration/
Prometheus has built-in support for:
• VM providers (AWS, Azure, Google, ...)
• Cluster managers (Kubernetes,
Marathon, …)
• Generic mechanisms (DNS, Consul,
Zookeeper, custom, ...)
Service Discovery
https://github.com/prometheus/prometheus/blob/master/documentation/examples/prometheus-
kubernetes.yml
Let’s use Kubernetes as an example
Alerting
https://prometheus.io/docs/practices/alerting/
You can write your own alerting rules.
(of course, the community has
examples/projects)
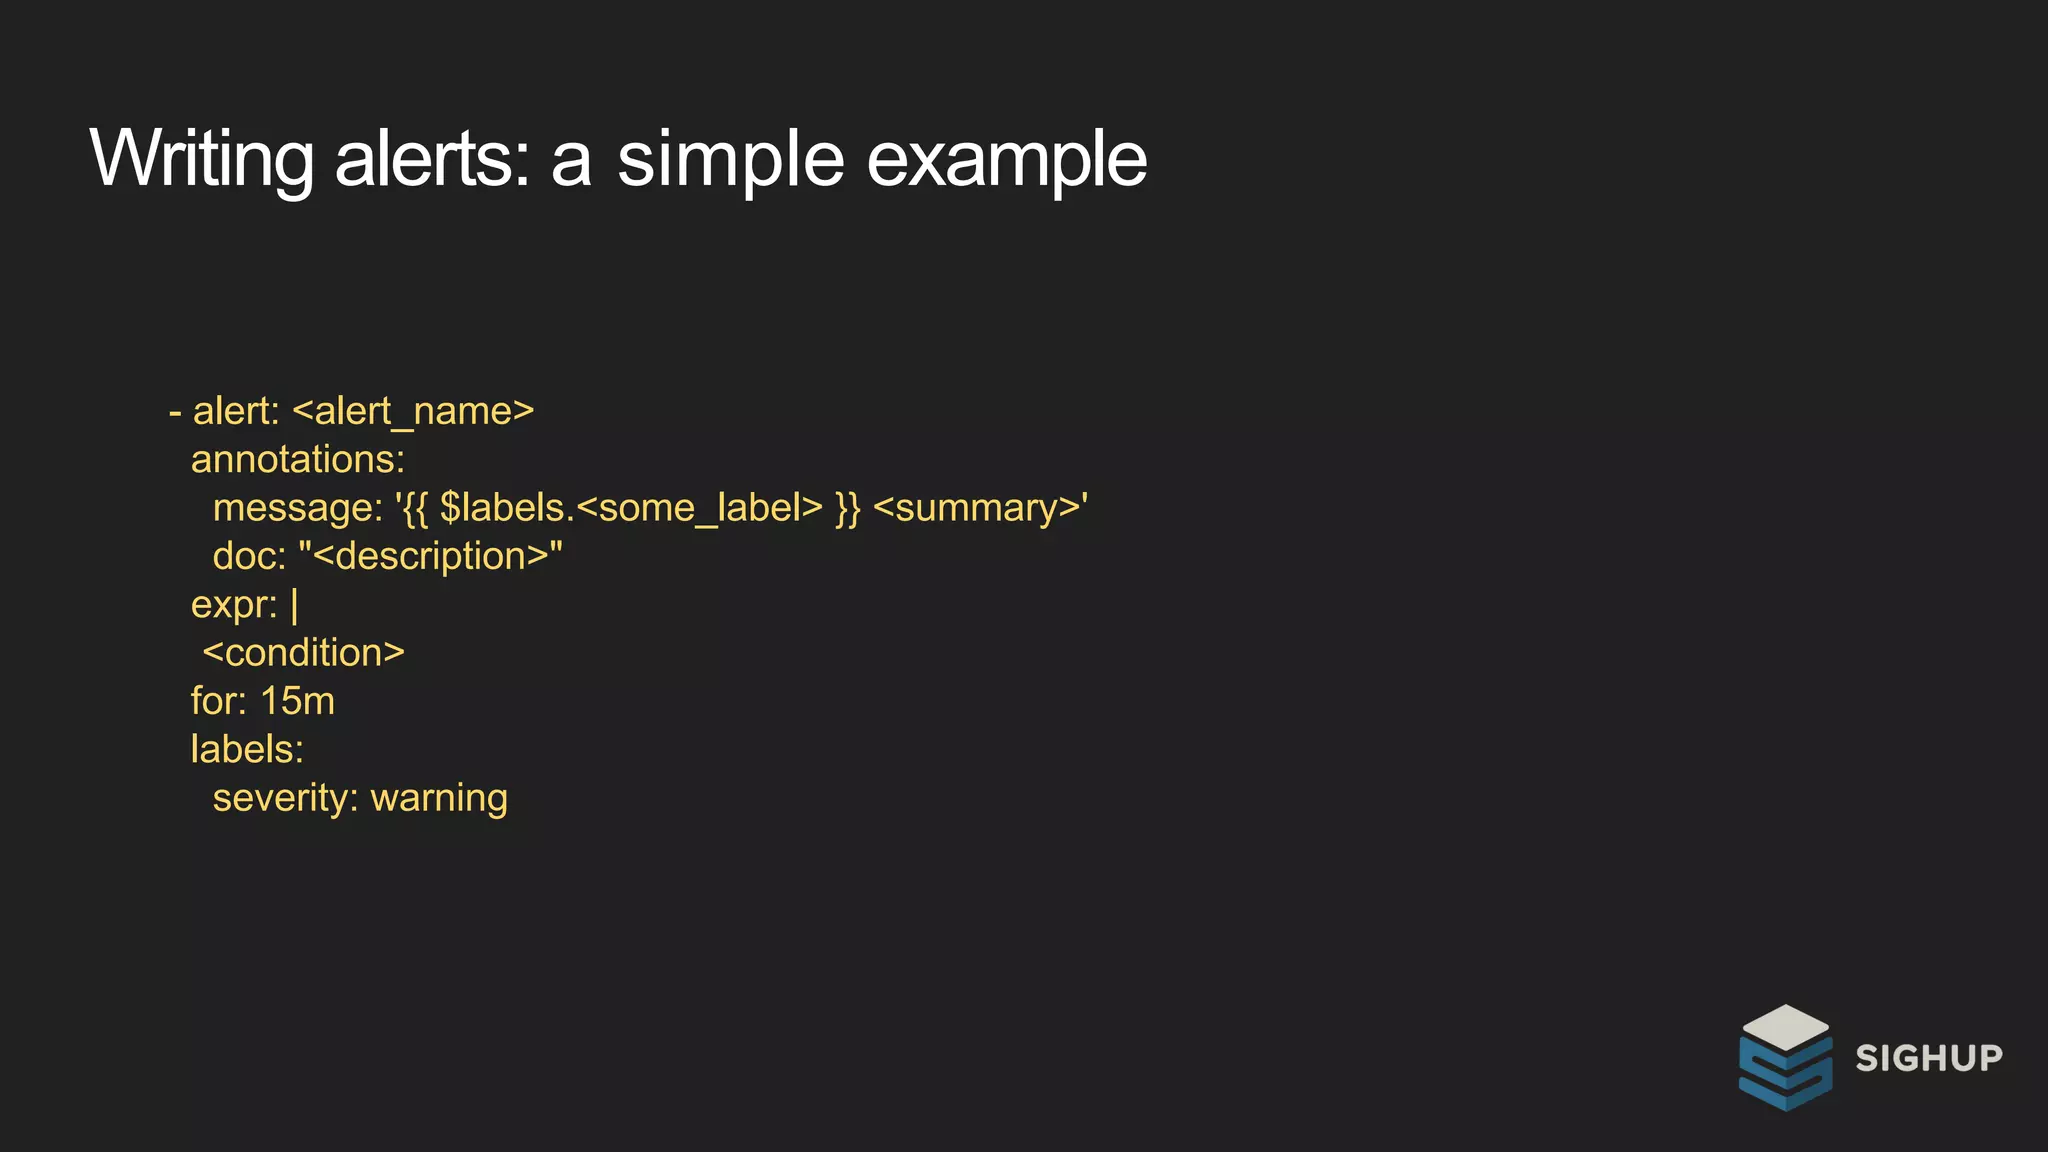
Writing alerts: a simple example
- alert: <alert_name>
annotations:
message: '{{ $labels.<some_label> }} <summary>'
doc: "<description>"
expr: |
<condition>
for: 15m
labels:
severity: warning
Writing alerts: a real-world example
- alert: NodeCPUStuckInIOWait
annotations:
message: '{{ $labels.instance }} spent more than half its CPU time in
IOWait in the last 5 minutes'
doc: "This alert fires if CPU time in IOWait mode calculated on a 5
minutes window for a given instance was more than 50% in the last 15
minutes."
expr: |
rate(node_cpu_seconds_total{mode="iowait"}[5m]) > 0.5
for: 15m
labels:
severity: warning
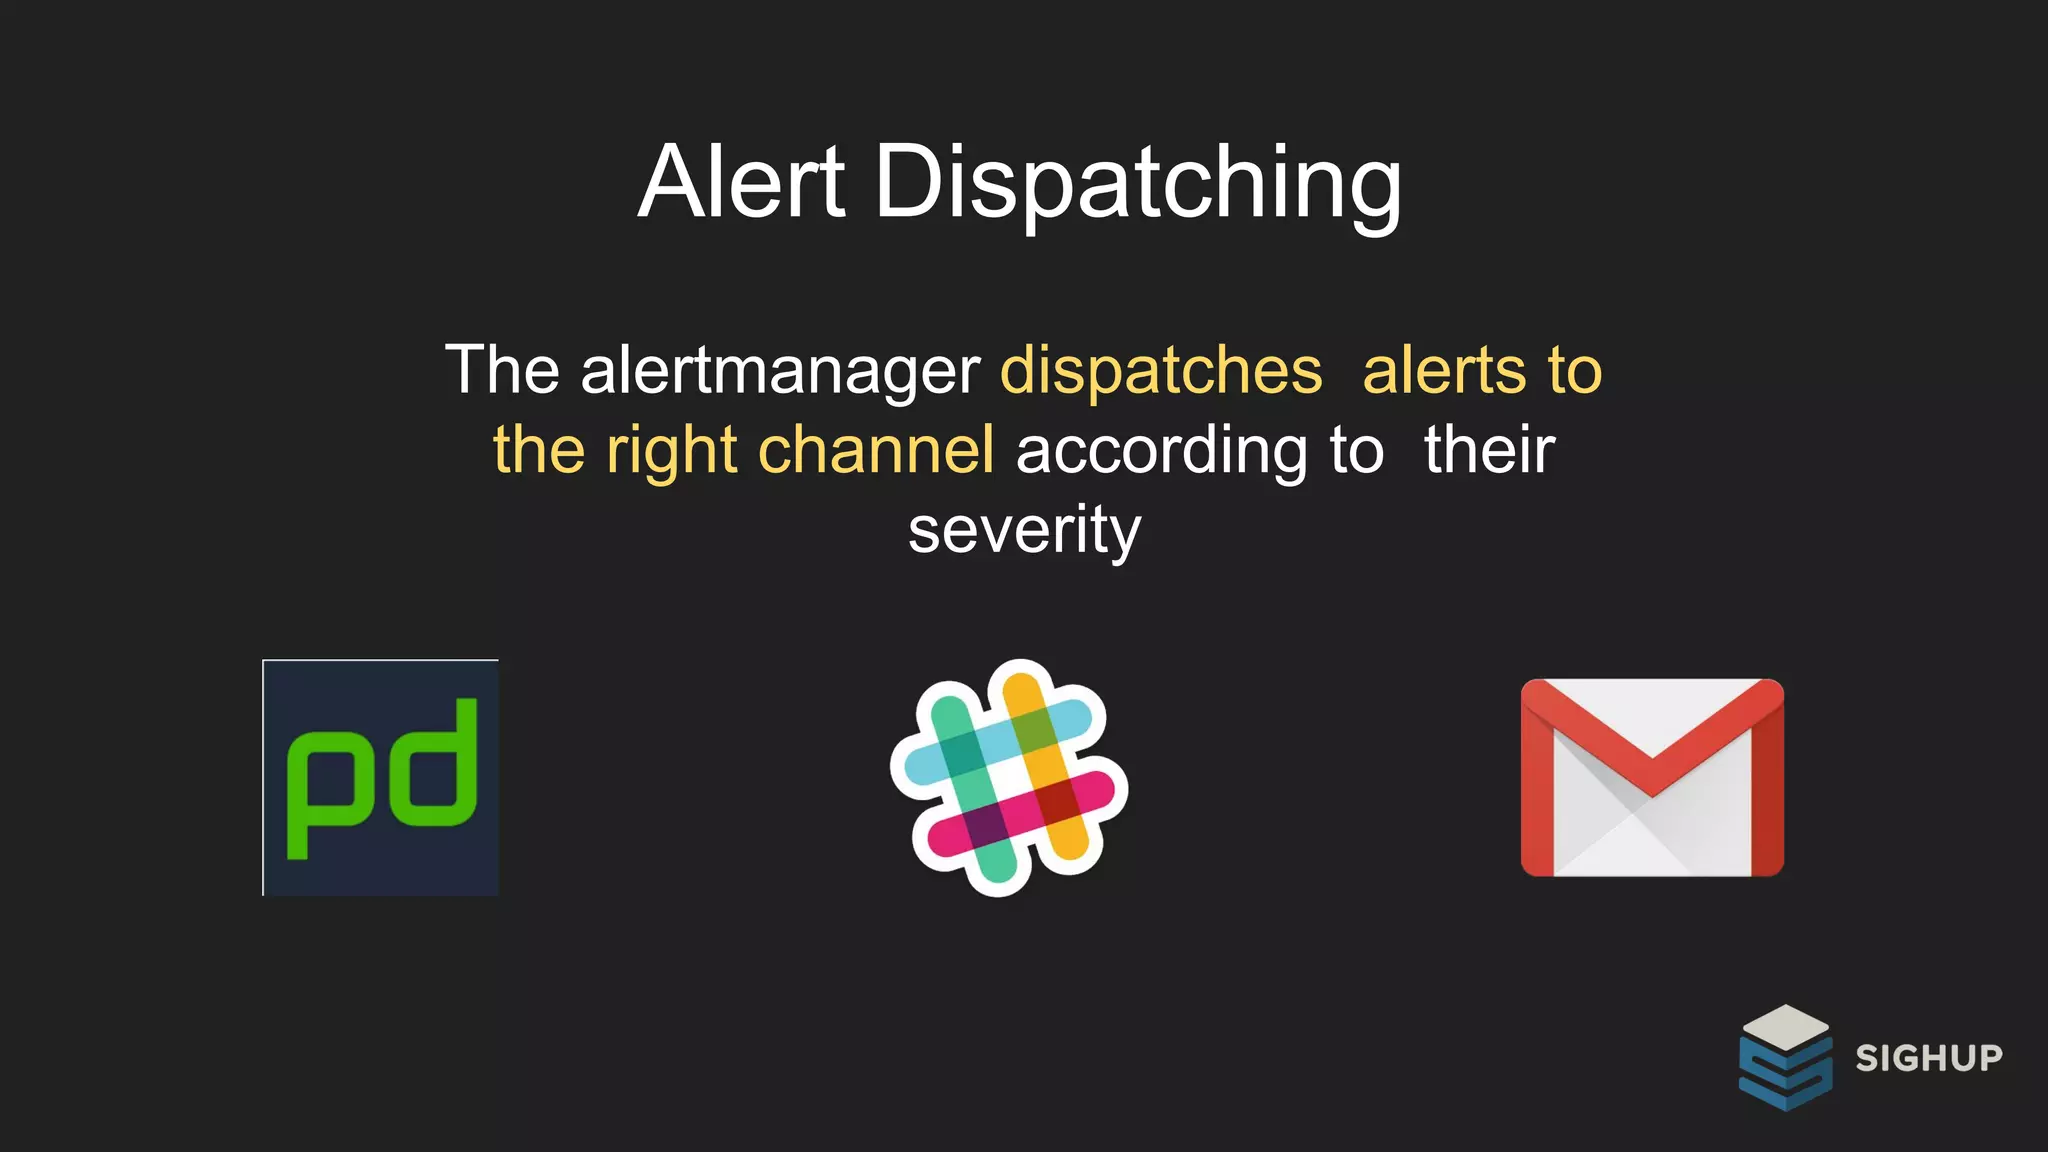
Alert Dispatching
The alertmanager dispatches alerts to
the right channel according to their
severity
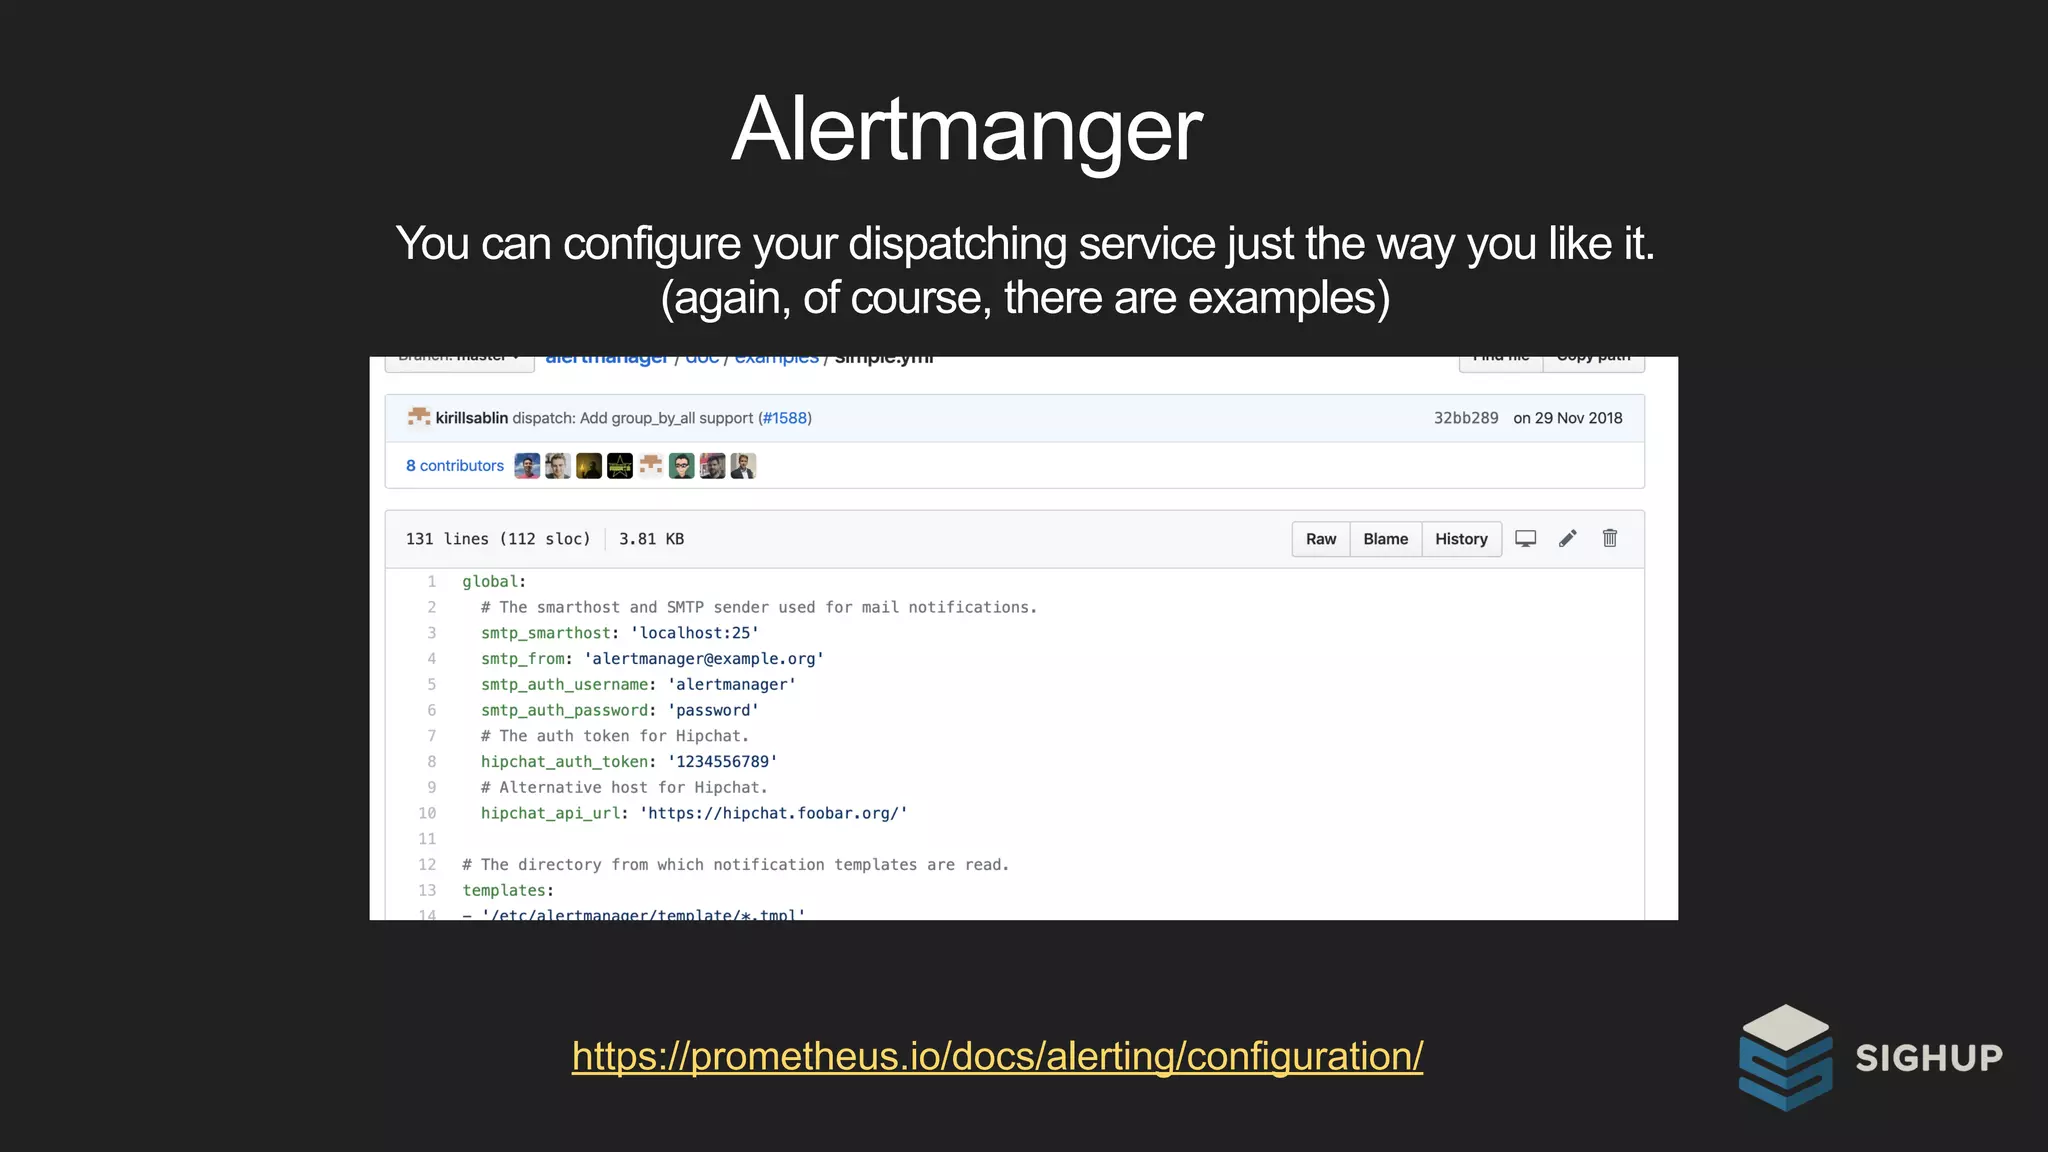
Alertmanger
https://prometheus.io/docs/alerting/configuration/
You can configure your dispatching service just the way you like it.
(again, of course, there are examples)
To recap:
• Simplicity + efficiency
• Dimensional data model
• Powerful query language
• Service discovery integration
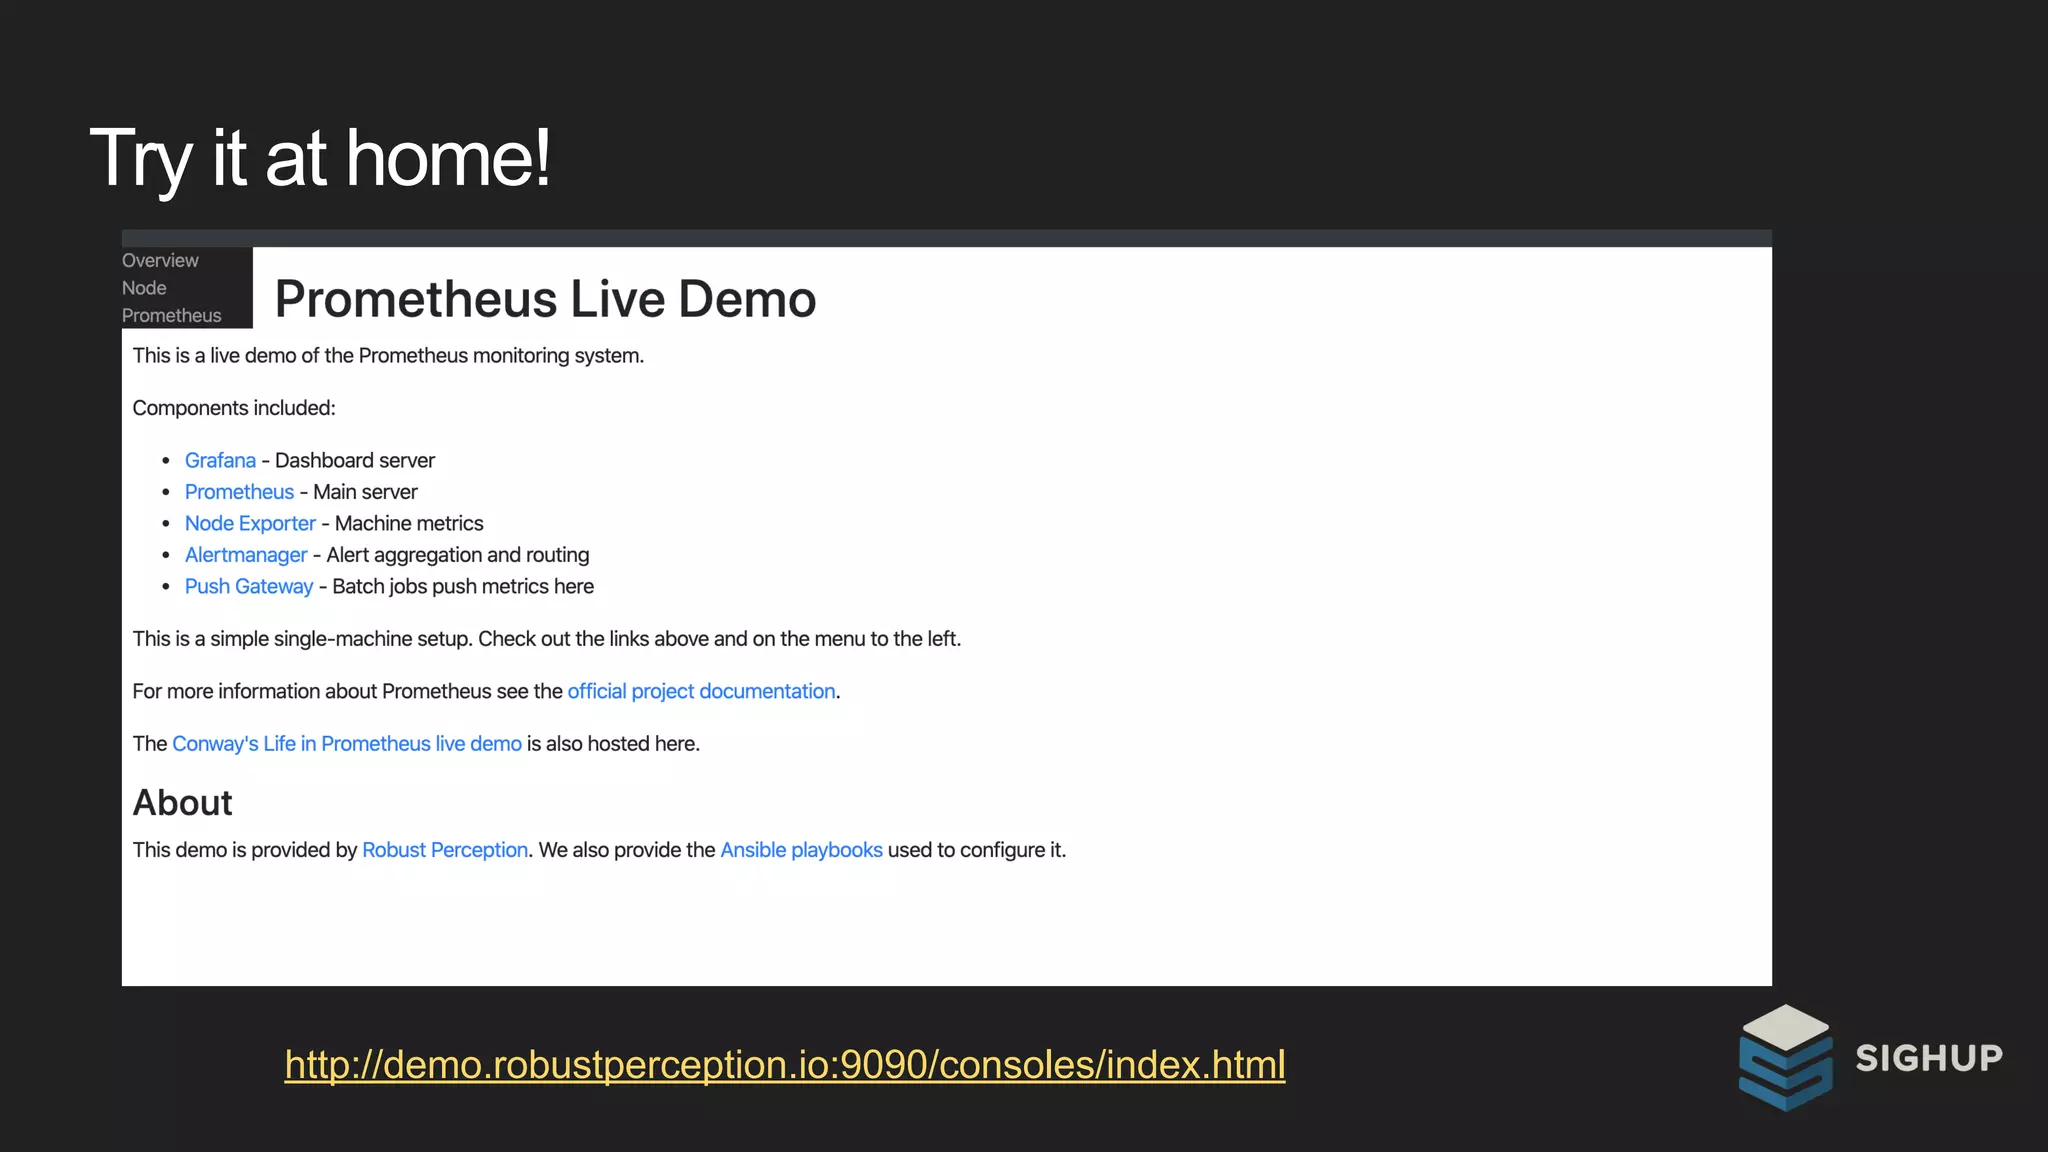
Try it at home!
http://demo.robustperception.io:9090/consoles/index.html

Prometheus - basics