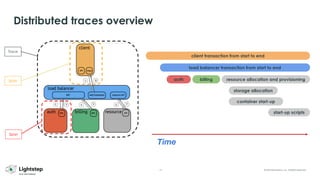
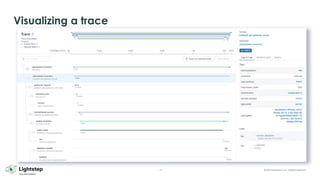
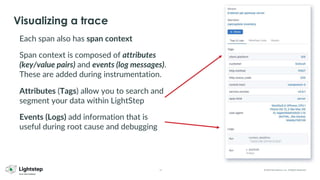
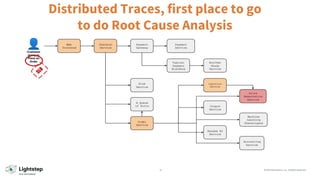
This document discusses OpenTelemetry, an open source project for collecting and managing traces, metrics, and logs in a vendor-agnostic way. It provides an overview of distributed tracing and explains why distributed traces are useful for root cause analysis. It also describes how to enable distributed tracing by instrumenting services, using a collector, and configuring pipelines in the OpenTelemetry Collector to receive, process, and export telemetry data.


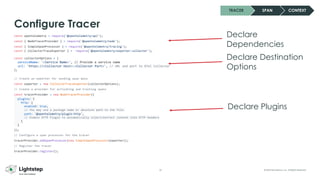
![15 © 2023 ServiceNow, Inc. All Rights Reserved.
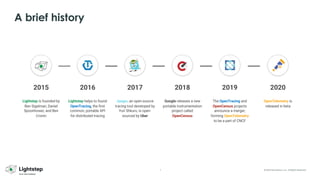
Lab 3.1: Example of trace span
JSON formatted info, output when span.end() was called.
"SpanContext": {
"TraceID": "9850b11fa09d4b5fa4dd48dd37f3683b",
"SpanID": "1113d149cfffa942",
"TraceFlags": 1
},
"ParentSpanID": "e1e1624830d2378e",
"SpanKind": "internal",
"Name": "dbHandler/database",
"StartTime": "2019-11-03T10:52:56.903919262Z",
"EndTime": "2019-11-03T10:52:56.903923338Z",
"Attributes": [],
"MessageEvents": null,
"Links": null,
"Status": 0,
"HasRemoteParent": false,
"DroppedAttributeCount": 0,
"DroppedMessageEventCount": 0,
"DroppedLinkCount": 0,
"ChildSpanCount": 0](https://image.slidesharecdn.com/2307-devbcn-otel101compressed-230710072321-e971e771/85/2307-DevBCN-Otel-101_compressed-pdf-15-320.jpg)
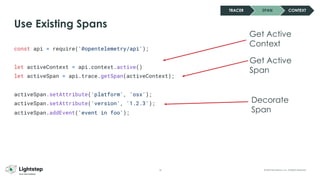
![16 © 2023 ServiceNow, Inc. All Rights Reserved.
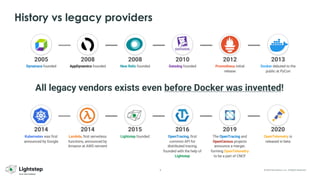
Lab 3.2: Example of trace attributes and log events
"Attributes": [
{
"Key": "http.host",
"Value": {
"Type": "STRING",
"Value": "opentelemetry-instructor.glitch.me"
}
},
{
"Key": "http.status_code",
"Value": {
"Type": "INT64",
"Value": 200
}
}
],
"MessageEvents": [
{
"Message": "annotation within span",
"Attributes": null,
"Time": "2019-11-03T10:52:56.903914029Z"
}
],](https://image.slidesharecdn.com/2307-devbcn-otel101compressed-230710072321-e971e771/85/2307-DevBCN-Otel-101_compressed-pdf-16-320.jpg)


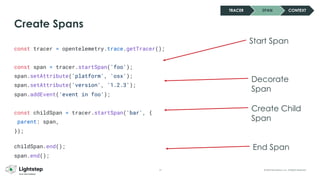
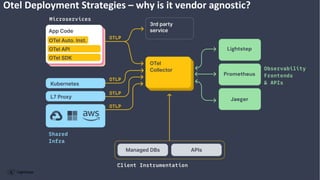
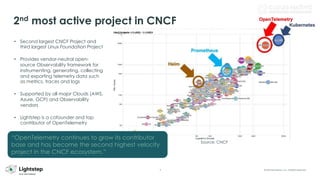
![33 © 2023 ServiceNow, Inc. All Rights Reserved.
receivers:
otlp:
protocols:
grpc:
endpoint: "0.0.0.0:55680"
http:
endpoint: "0.0.0.0:55681"
processors:
batch:
queued_retry:
extensions:
health_check: {}
exporters:
otlp:
endpoint: "ingest.lightstep.com:443"
headers:
"lightstep-access-token": "{{ .Values.lightstepKey }}"
service:
extensions: [health_check, zpages]
pipelines:
traces:
receivers: [otlp]
processors: [batch, queued_retry]
exporters: [otlp]
This can be any receiver, not just
OTLP. Remember, receivers can be
part of multiple pipelines!
Batch and Retry processors are
recommended to reduce
connections and decrease size of
outgoing reports.
Other export options include
compression (gzip), etc. If
satellites are in Single Project
mode, no headers needed, just
endpoint!
All configuration in single YAML file
Use Kubernetes Operator to deploy it:
https://github.com/open-telemetry/opentelemetry-operator](https://image.slidesharecdn.com/2307-devbcn-otel101compressed-230710072321-e971e771/85/2307-DevBCN-Otel-101_compressed-pdf-33-320.jpg)


![Jacob Marble [InfluxData] | Observability with InfluxDB IOx and OpenTelemetry...](https://cdn.slidesharecdn.com/ss_thumbnails/influxdbioxandopentelemetry-27-oct-2021jmarble-211022195239-thumbnail.jpg?width=640&height=640&fit=bounds)


