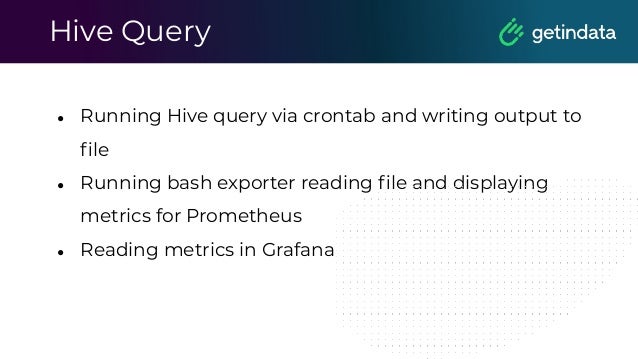
Download as PDF, PPTX


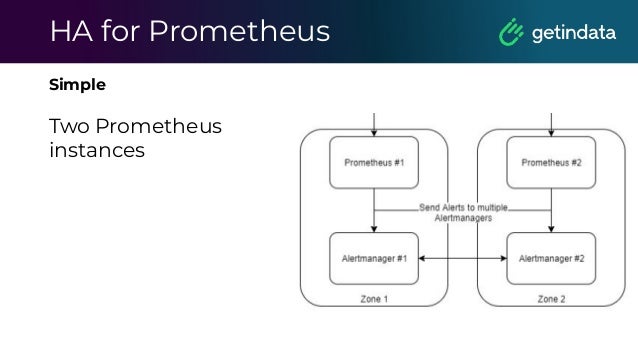


![LogQL
This example counts all the log lines within the last
five minutes for the MySQL job.
rate( ( {job="mysql"} |= "error" !=
"timeout)[10s] ) )
It counts the entries for each log stream
count_over_time({job="mysql"}[5m])](https://image.slidesharecdn.com/2020monitoringinbigdataplatform-220114111648/95/Monitoring-in-Big-Data-Platform-Albert-Lewandowski-GetInData-58-638.jpg)
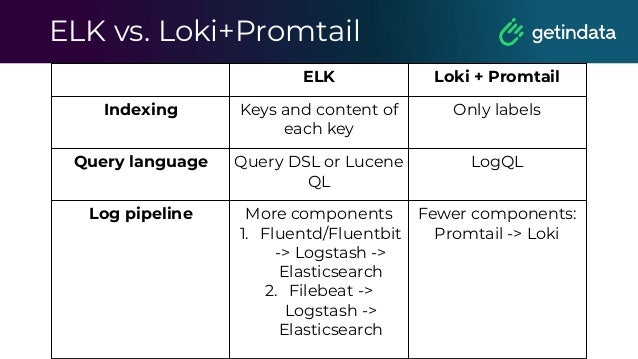


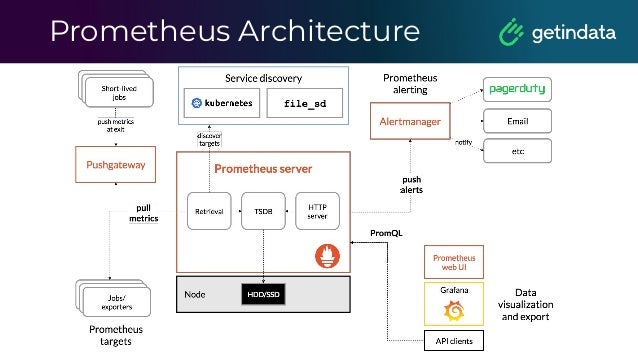
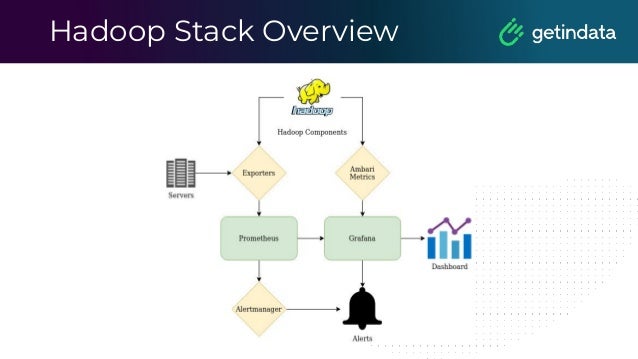
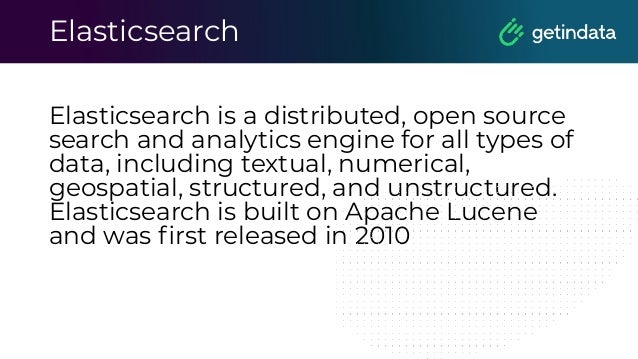
The document discusses monitoring in big data platforms, focusing on key concepts such as metrics, log analysis, and Prometheus architecture. It highlights differences between push and pull models, offers security insights for Prometheus components, and provides monitoring solutions for various systems including Kubernetes, Kafka, and Spark. Additionally, it explores log analytics tools like Elasticsearch and Loki, emphasizing their implementation for effective monitoring and observability.


![[DSC Europe 25] Vladimir Jelic - The AI-Driven Security Shift From Reactive D...](https://cdn.slidesharecdn.com/ss_thumbnails/6g5gj25mtjwayniqem1t-6-251209104645-7a5a5fc6-thumbnail.jpg?width=640&height=640&fit=bounds)
![[DSC Europe 25] Miodrag Pesovic & Vladislav Radonjic - Federated Data Archite...](https://cdn.slidesharecdn.com/ss_thumbnails/gsbe3y5it5uhndi4e08e-1-251212103249-f1008e0c-thumbnail.jpg?width=640&height=640&fit=bounds)
![[DSC Europe 25] Debmalya Biswas - Agentification: the art of transforming man...](https://cdn.slidesharecdn.com/ss_thumbnails/r5azlggvtqiaiiusrqdr-4-251212103249-5a12c89b-thumbnail.jpg?width=640&height=640&fit=bounds)

![[DSC Europe 25] Kaja Kandare - LLM as a judge.pptx](https://cdn.slidesharecdn.com/ss_thumbnails/arxyccaxsdsd1ba99wjw-7-251212104007-2b4e3f64-thumbnail.jpg?width=640&height=640&fit=bounds)


![[DSC Europe 25] Milan Sekuloski - Data, Defence, and Development: Cybersecuri...](https://cdn.slidesharecdn.com/ss_thumbnails/dfrkwwx4qly6atqpbl4z-4-251209104645-c3d4b0ca-thumbnail.jpg?width=640&height=640&fit=bounds)
![[DSC Europe 25] Aleksandra Dragicevic - AI-Boosted Research in Healthcare: Fr...](https://cdn.slidesharecdn.com/ss_thumbnails/iqwngszurf2r7pi1lnnj-4-aleksandra-dragicevic-ad-dsc-europe-conference-20-251208151905-37c3238a-thumbnail.jpg?width=640&height=640&fit=bounds)


