Downloaded 142 times

![Prometheus
Data Model
api_http_requests_total
method=POST
method=GET
method=...
path=/tracks
path=/users
path=...
status=200
status=404
status=...
job=api-server
job=node
job=...
instance=1.2.3.4:80
instance=1.2.3.4:81
instance=...
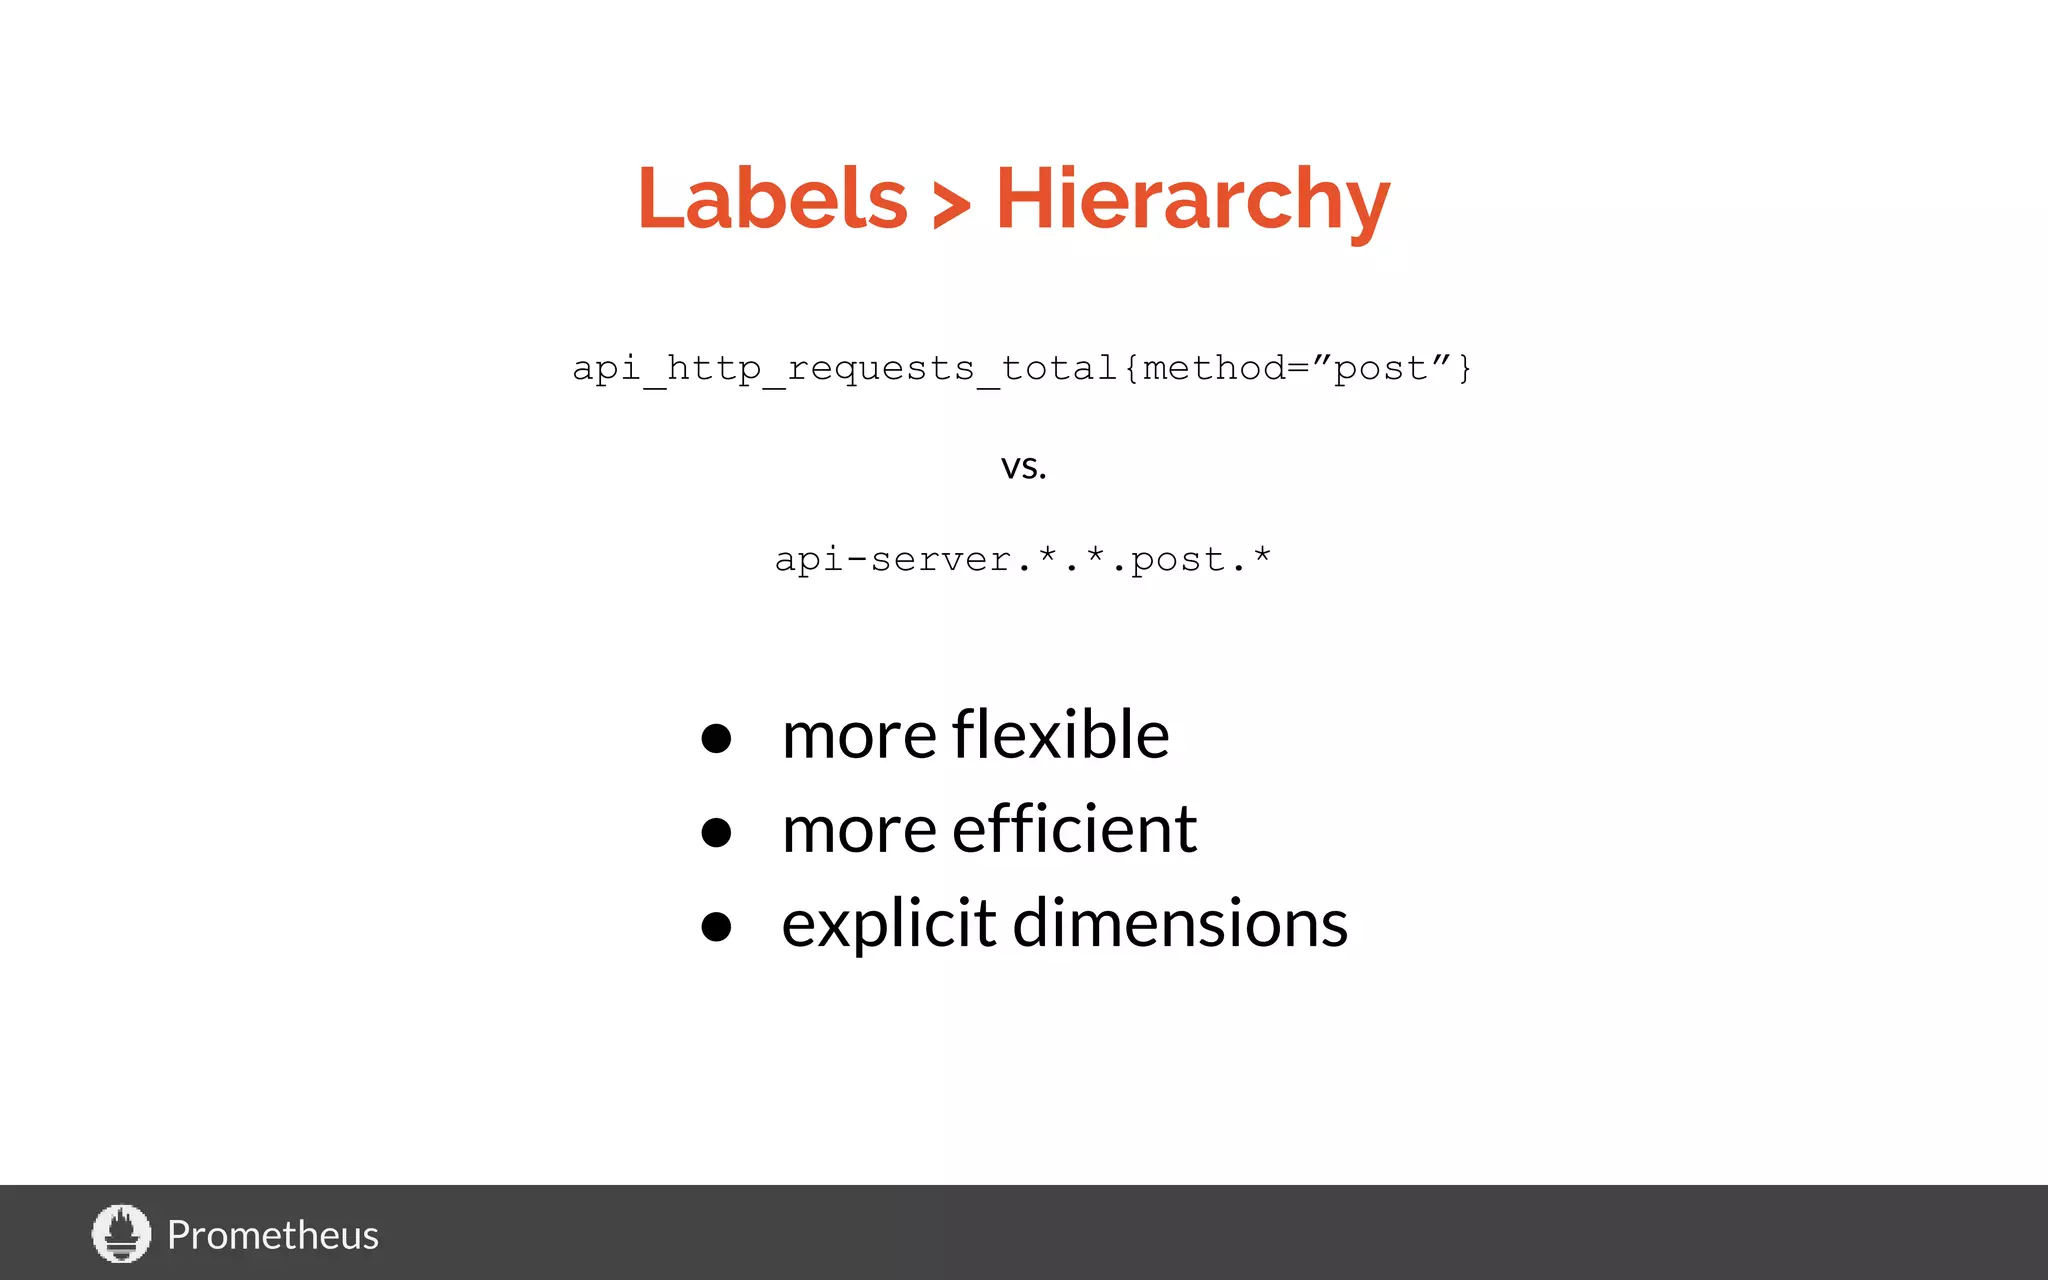
Labels > Hierarchy
api-server
1.2.3.4:80
/tracks
GET
200
404
[…]
POST
[…]
/users
[…]
1.2.3.4:81
/tracks
GET
200
[…]
[...]
/users
[...]
[...]](https://image.slidesharecdn.com/prometheusdesignandphilosophy-whyitisthewayitis-161010171121/75/Prometheus-design-and-philosophy-11-2048.jpg)
![Prometheus
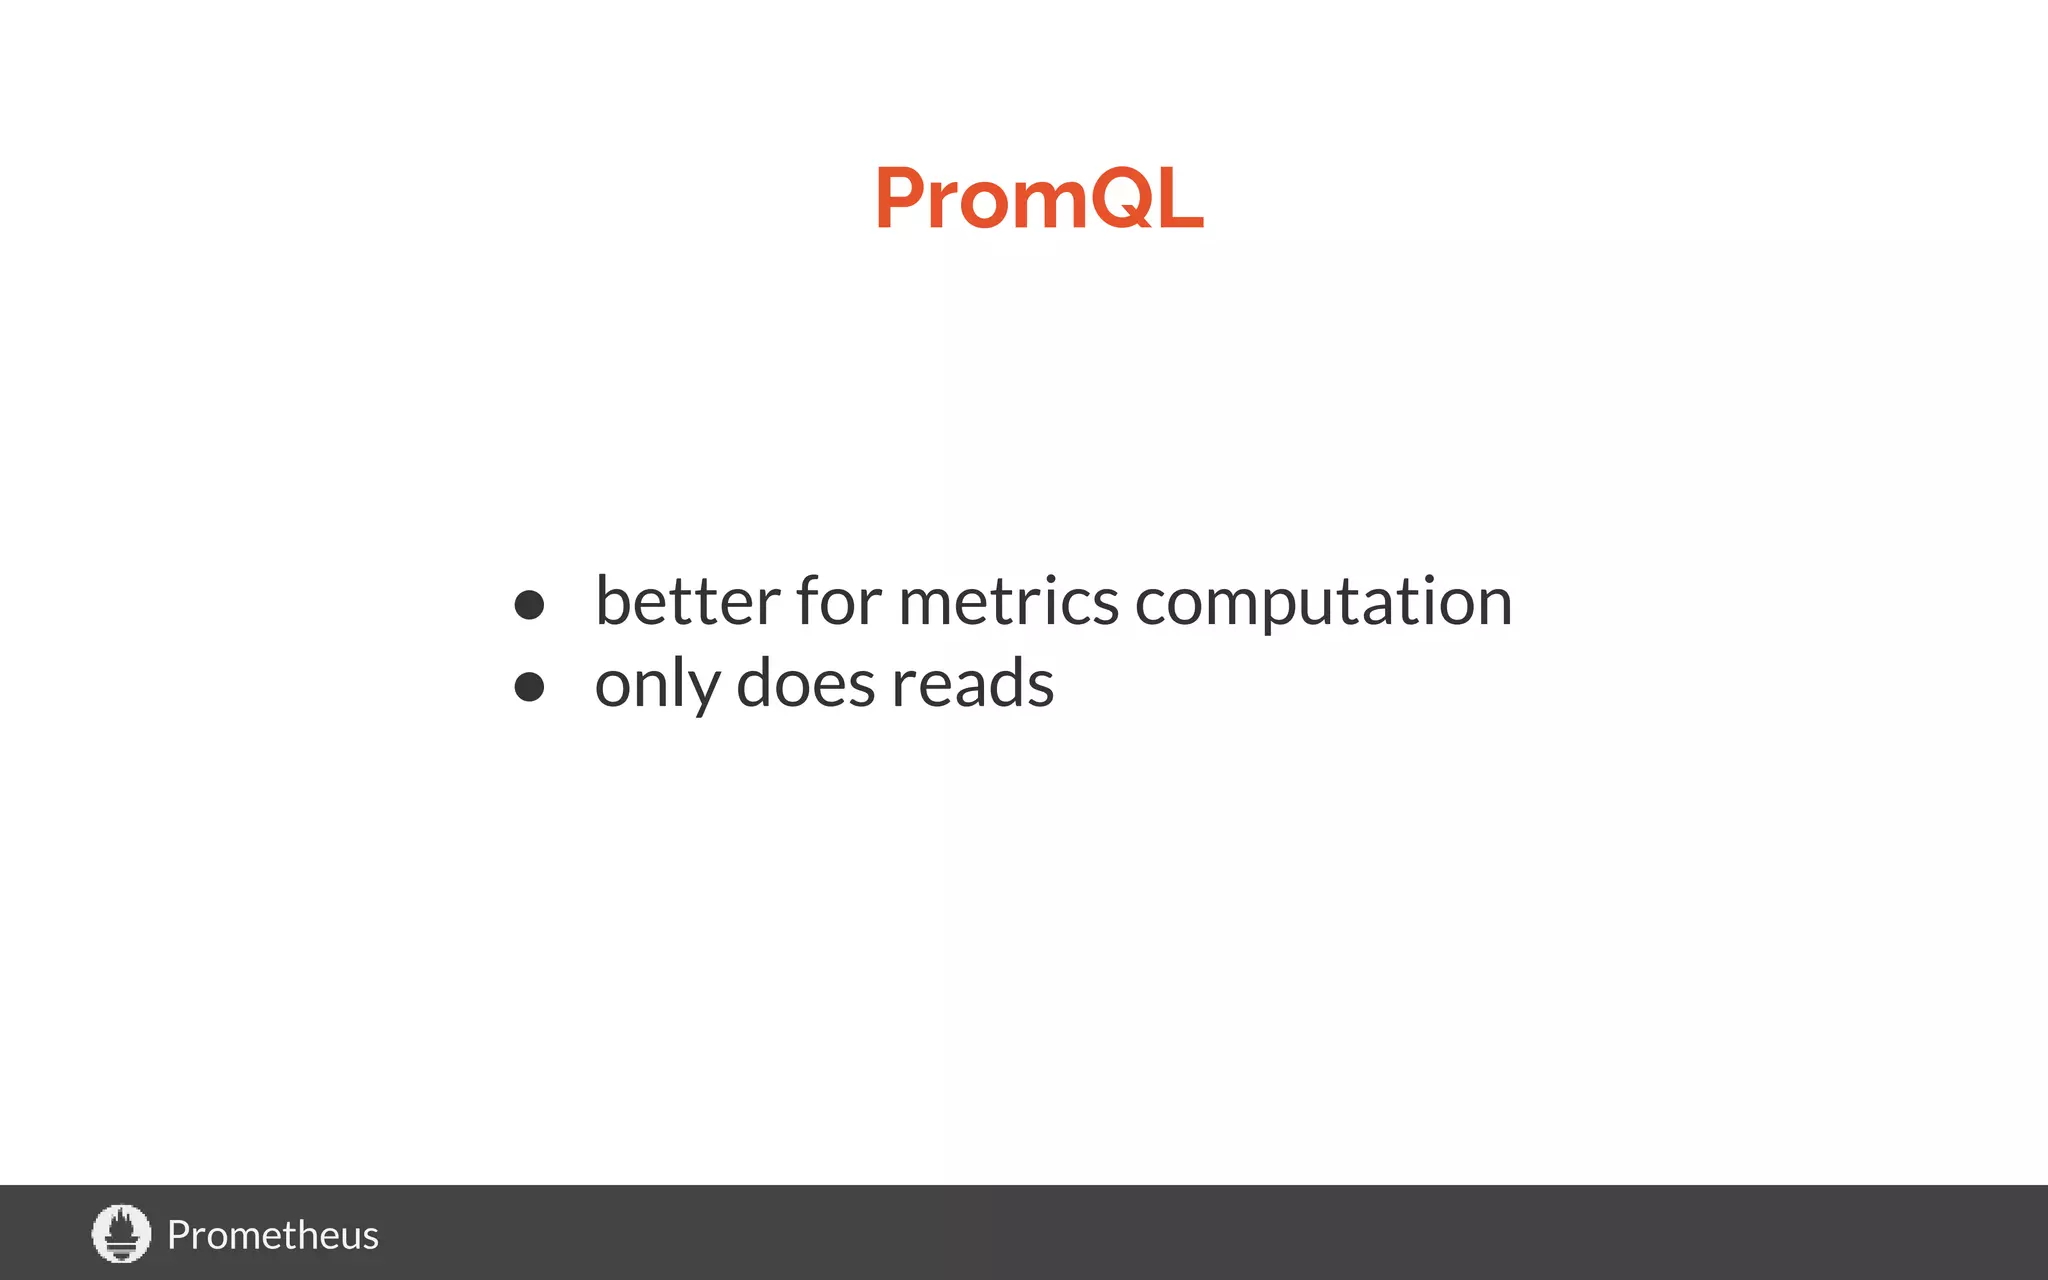
Non-SQL Query Language
PromQL: rate(api_http_requests_total[5m])
SQL: SELECT job, instance, method, status, path, rate(value, 5m) FROM api_http_requests_total
PromQL: avg by(city) (temperature_celsius{country=”germany”})
SQL: SELECT city, AVG(value) FROM temperature_celsius WHERE country=”germany” GROUP BY city
PromQL: rate(errors{job=”foo”}[5m]) / rate(total{job=”foo”}[5m])
SQL:
SELECT errors.job, errors.instance, […more labels…], rate(errors.value, 5m) /
rate(total.value, 5m) FROM errors JOIN total ON […all the label equalities…] WHERE
errors.job=”foo” AND total.job=”foo”](https://image.slidesharecdn.com/prometheusdesignandphilosophy-whyitisthewayitis-161010171121/75/Prometheus-design-and-philosophy-13-2048.jpg)


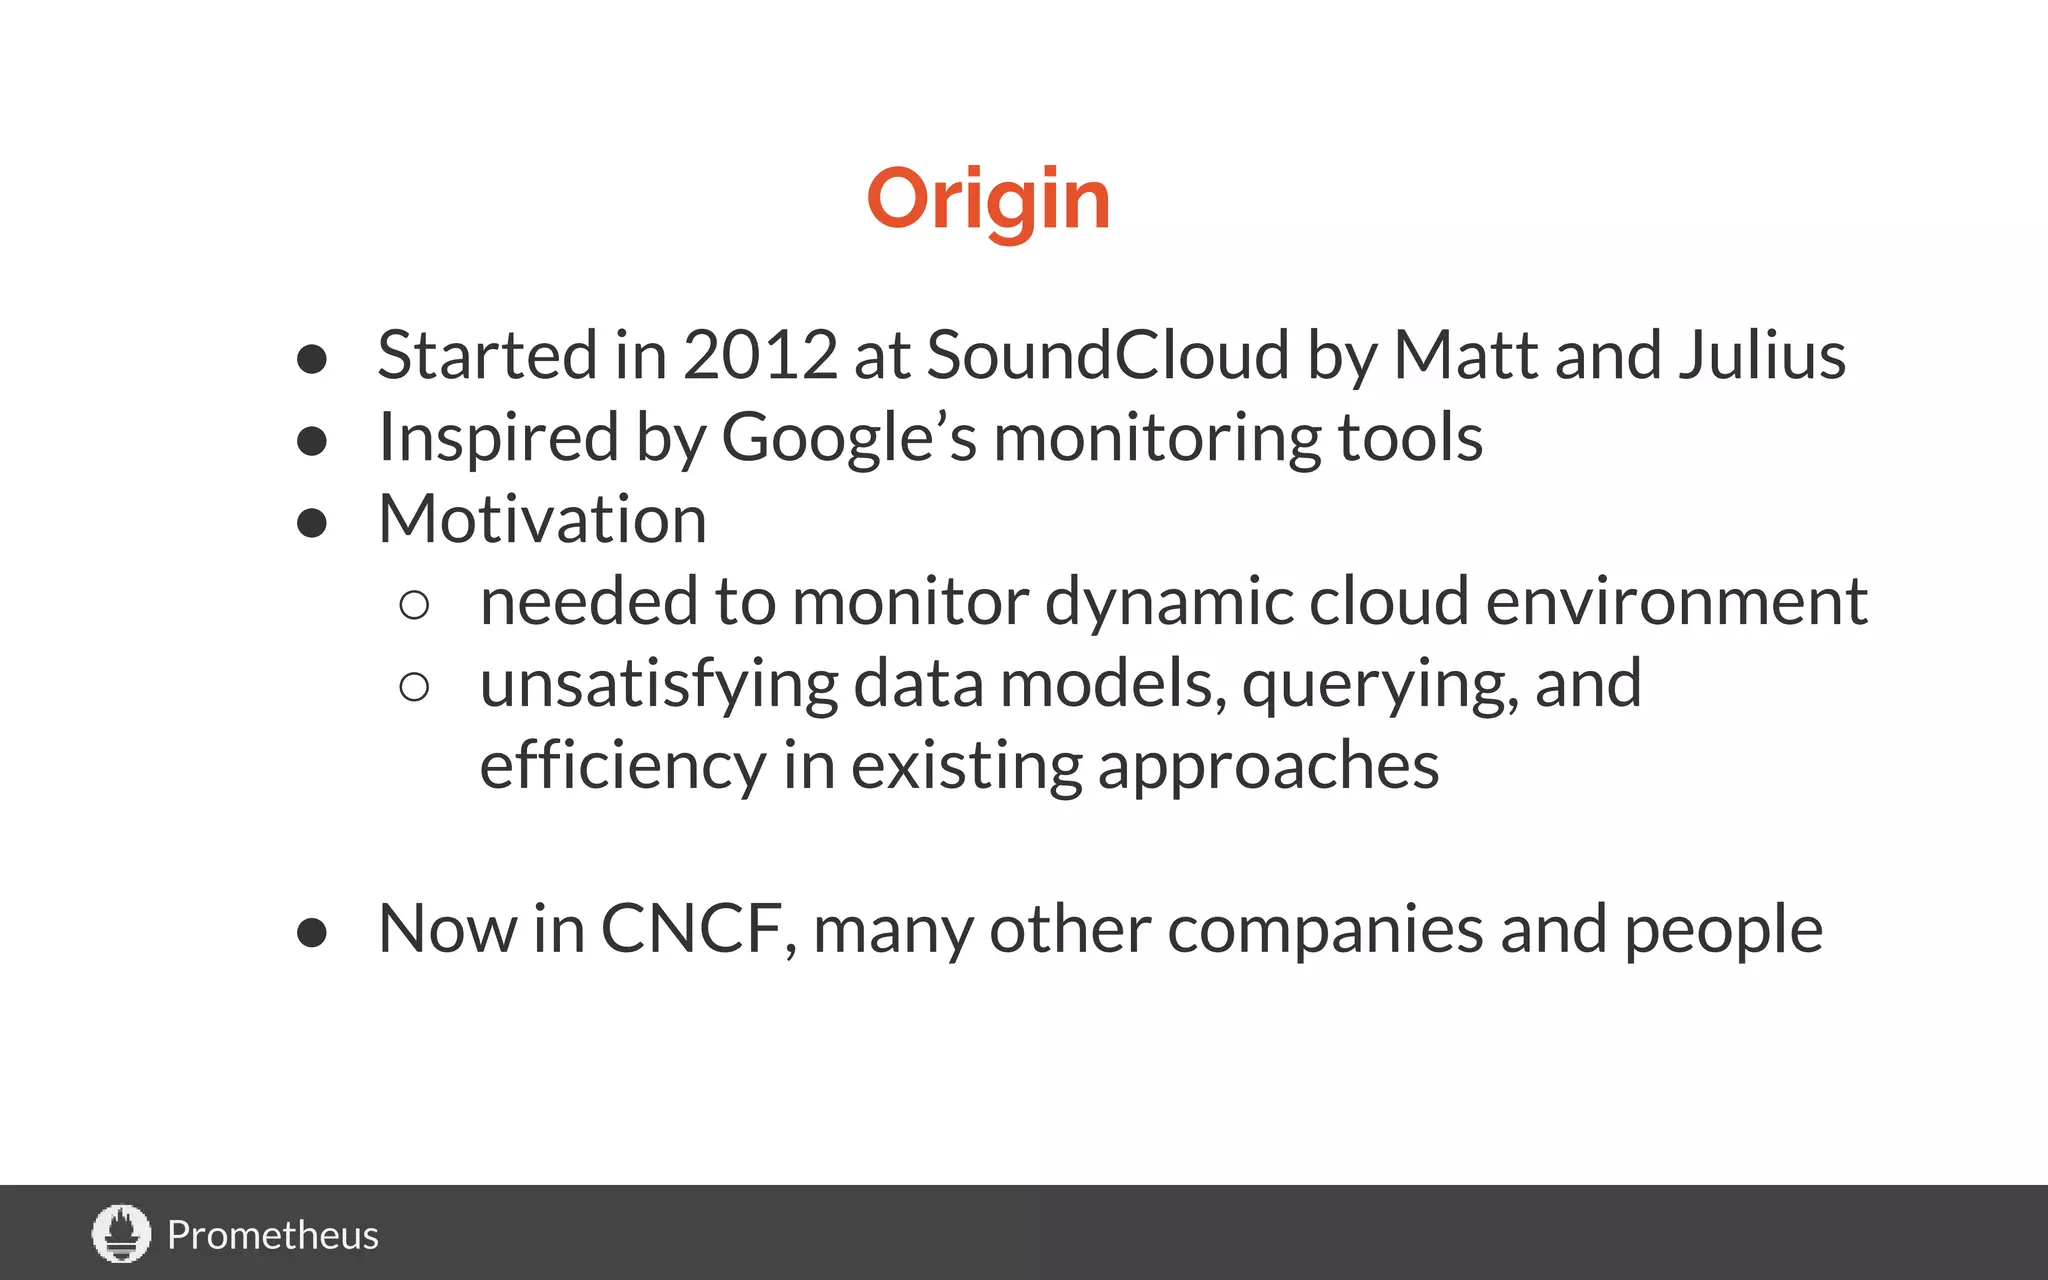
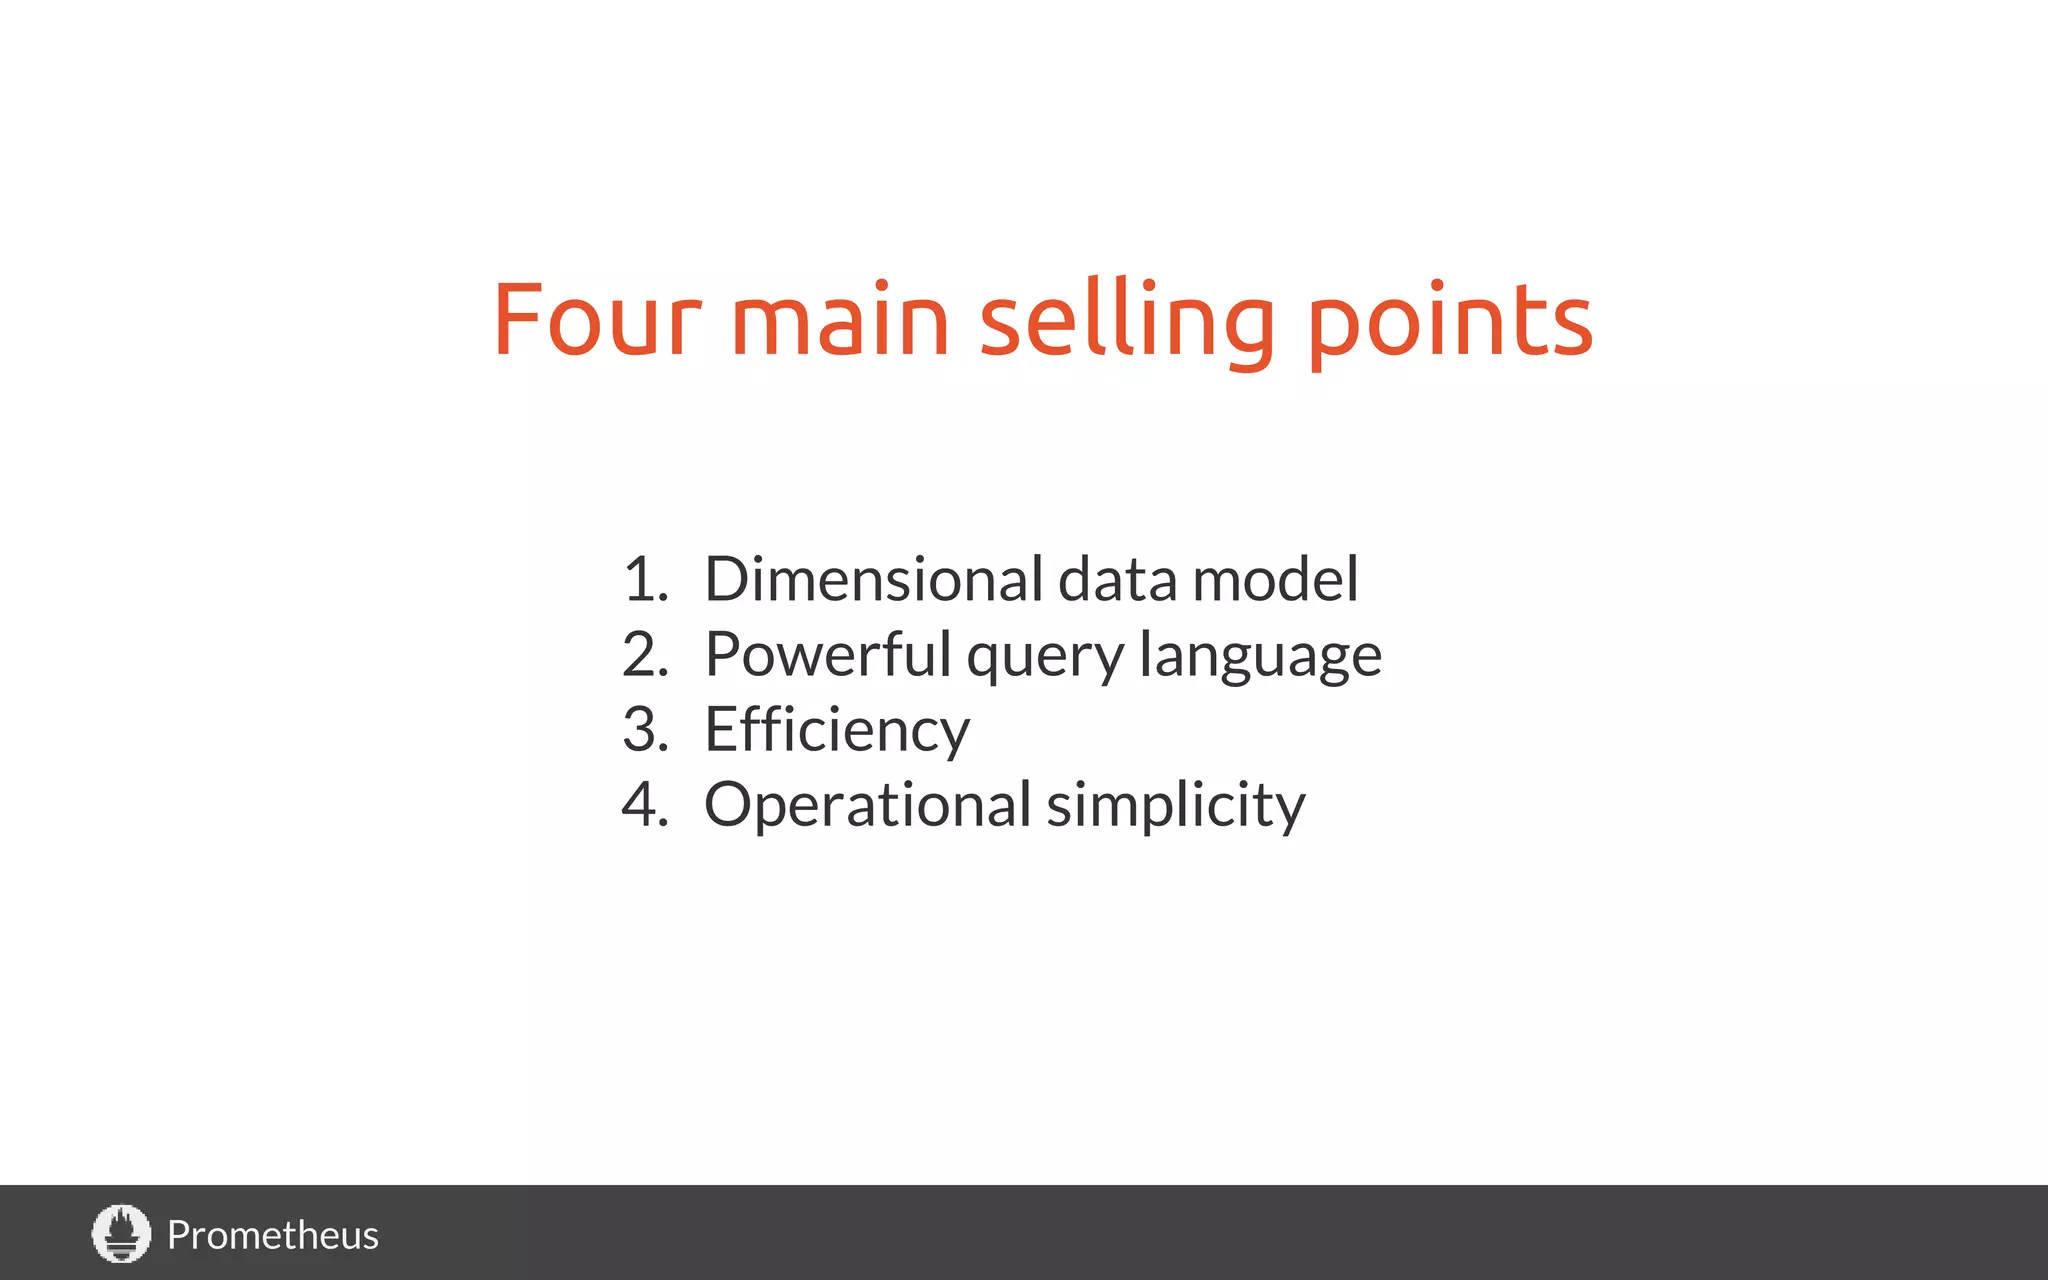
Prometheus is an opinionated monitoring system designed for dynamic cloud environments, initiated by SoundCloud in 2012, motivated by the need for efficient monitoring tools. Key features include a dimensional data model, powerful query language, and operational simplicity, while it does not support SQL-like queries and instead uses its own PromQL. The document discusses Prometheus's architecture, functionality, and alternative monitoring solutions, emphasizing best practices in monitoring.