Download as PDF, PPTX
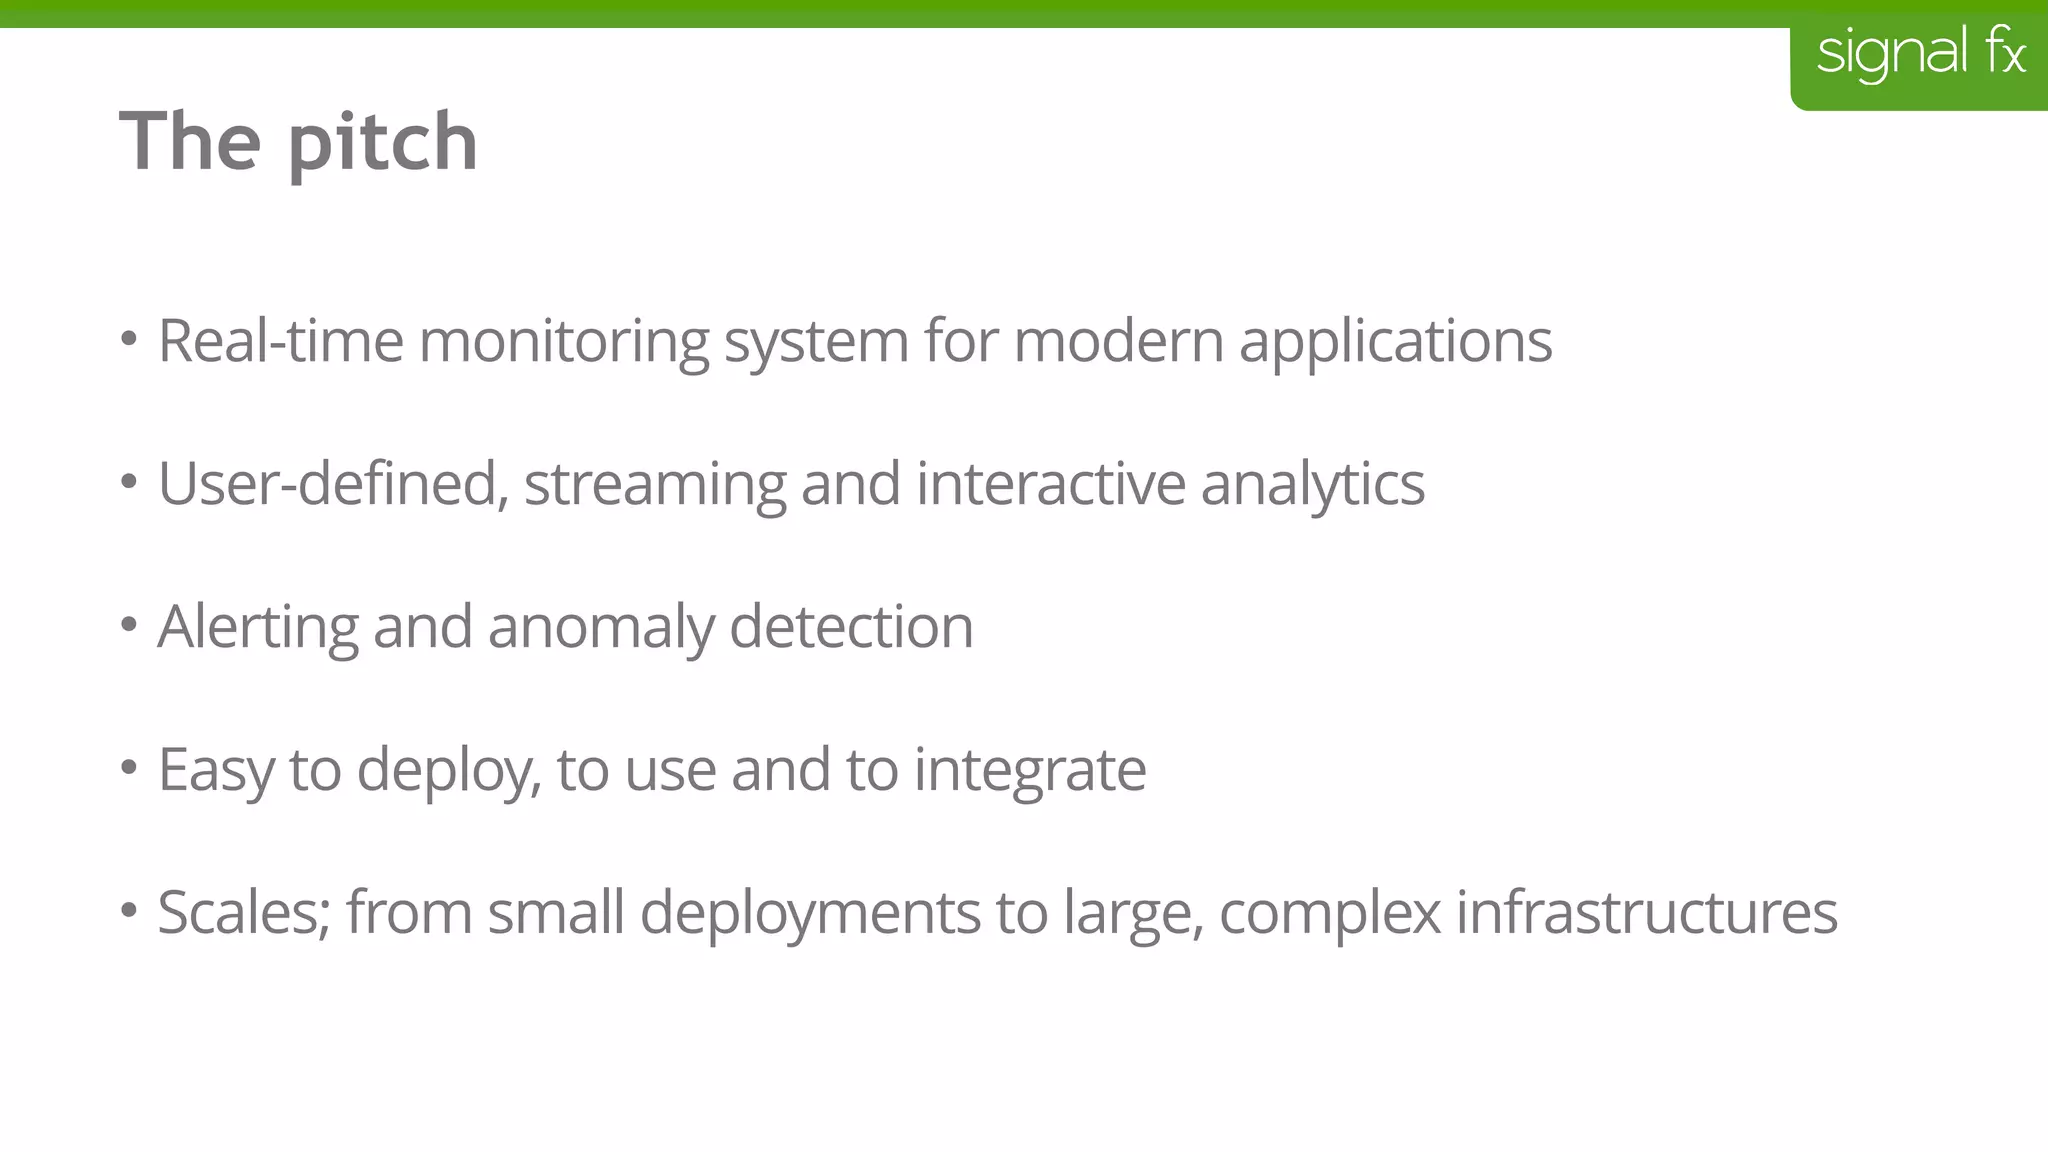
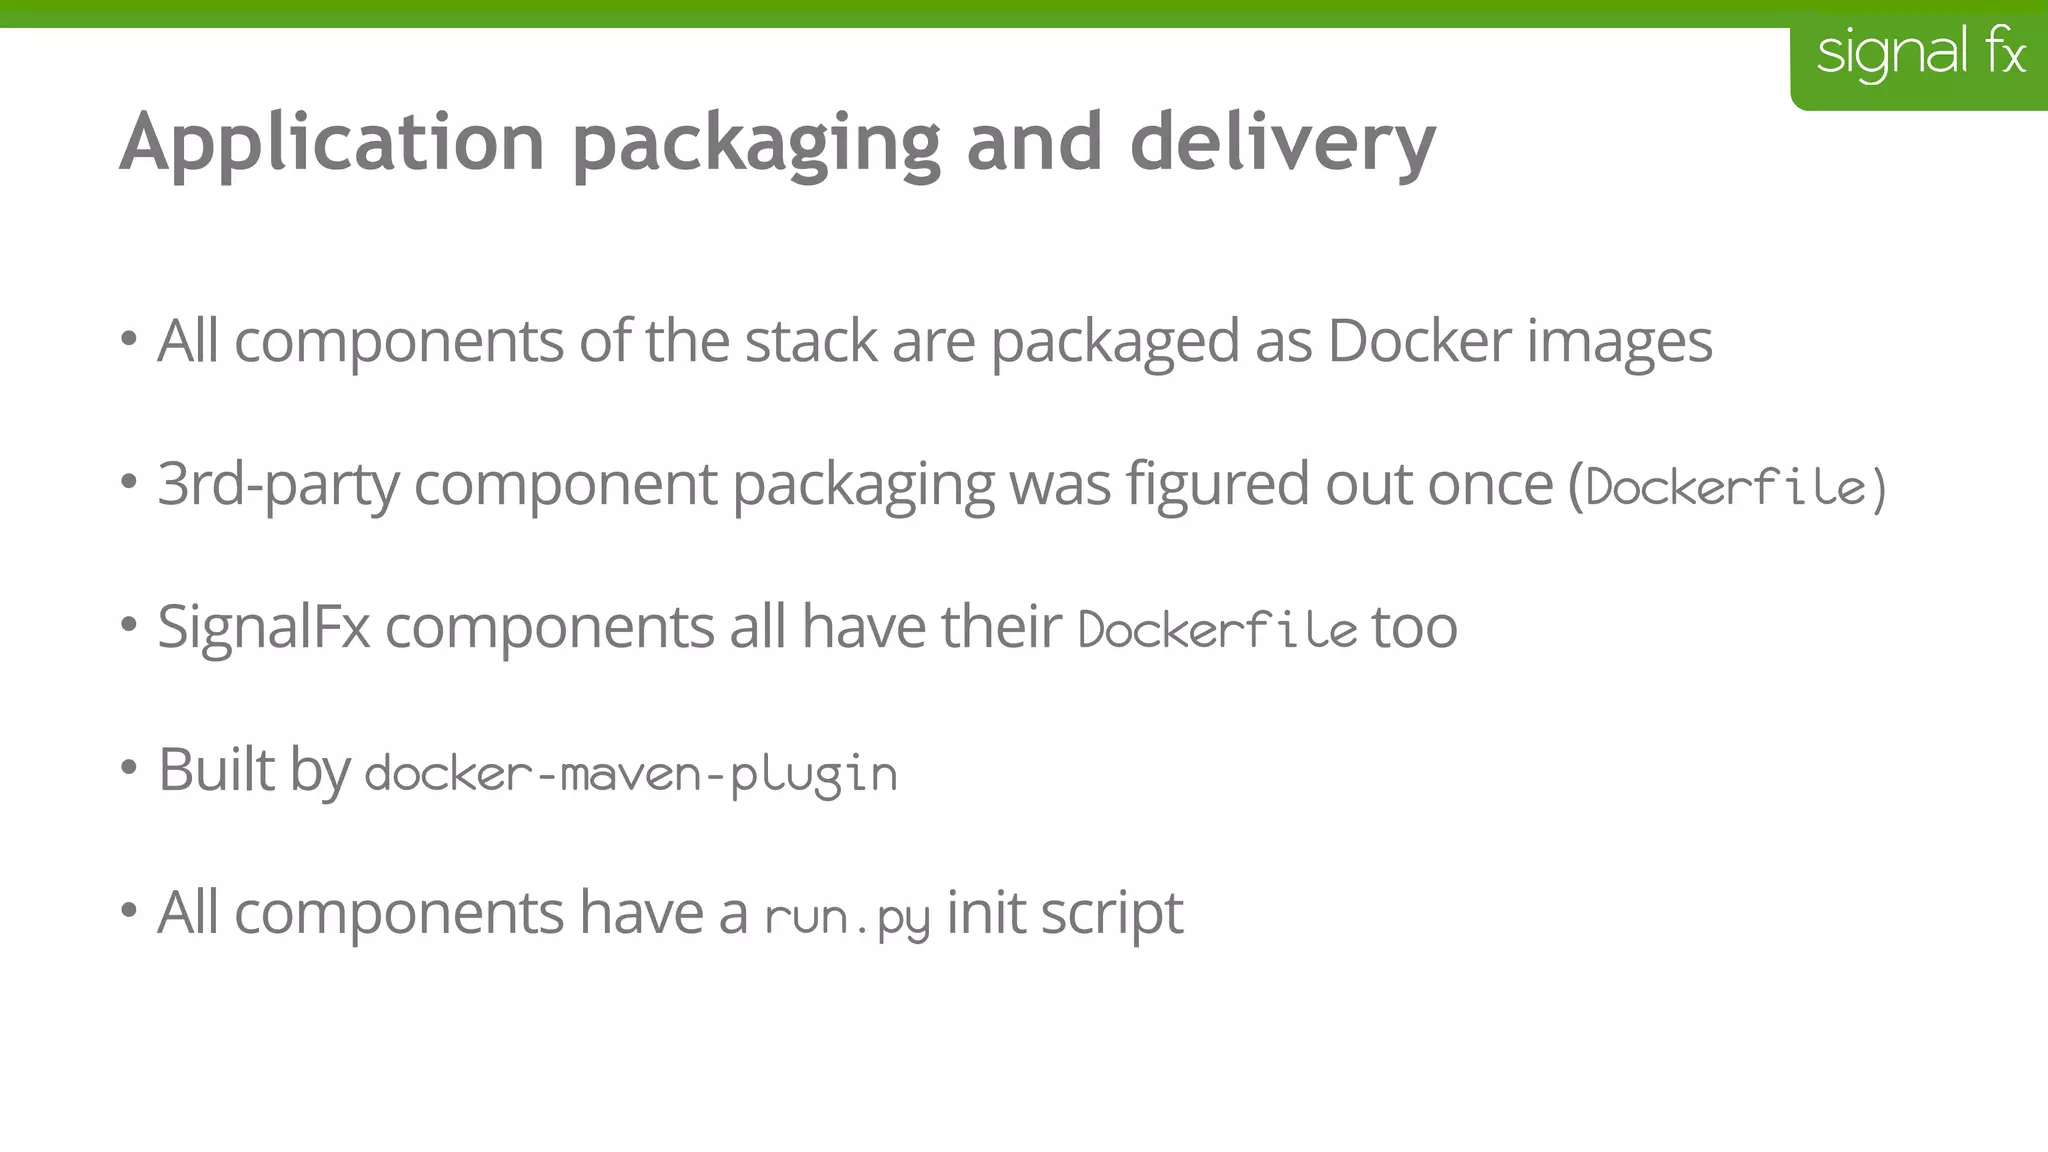
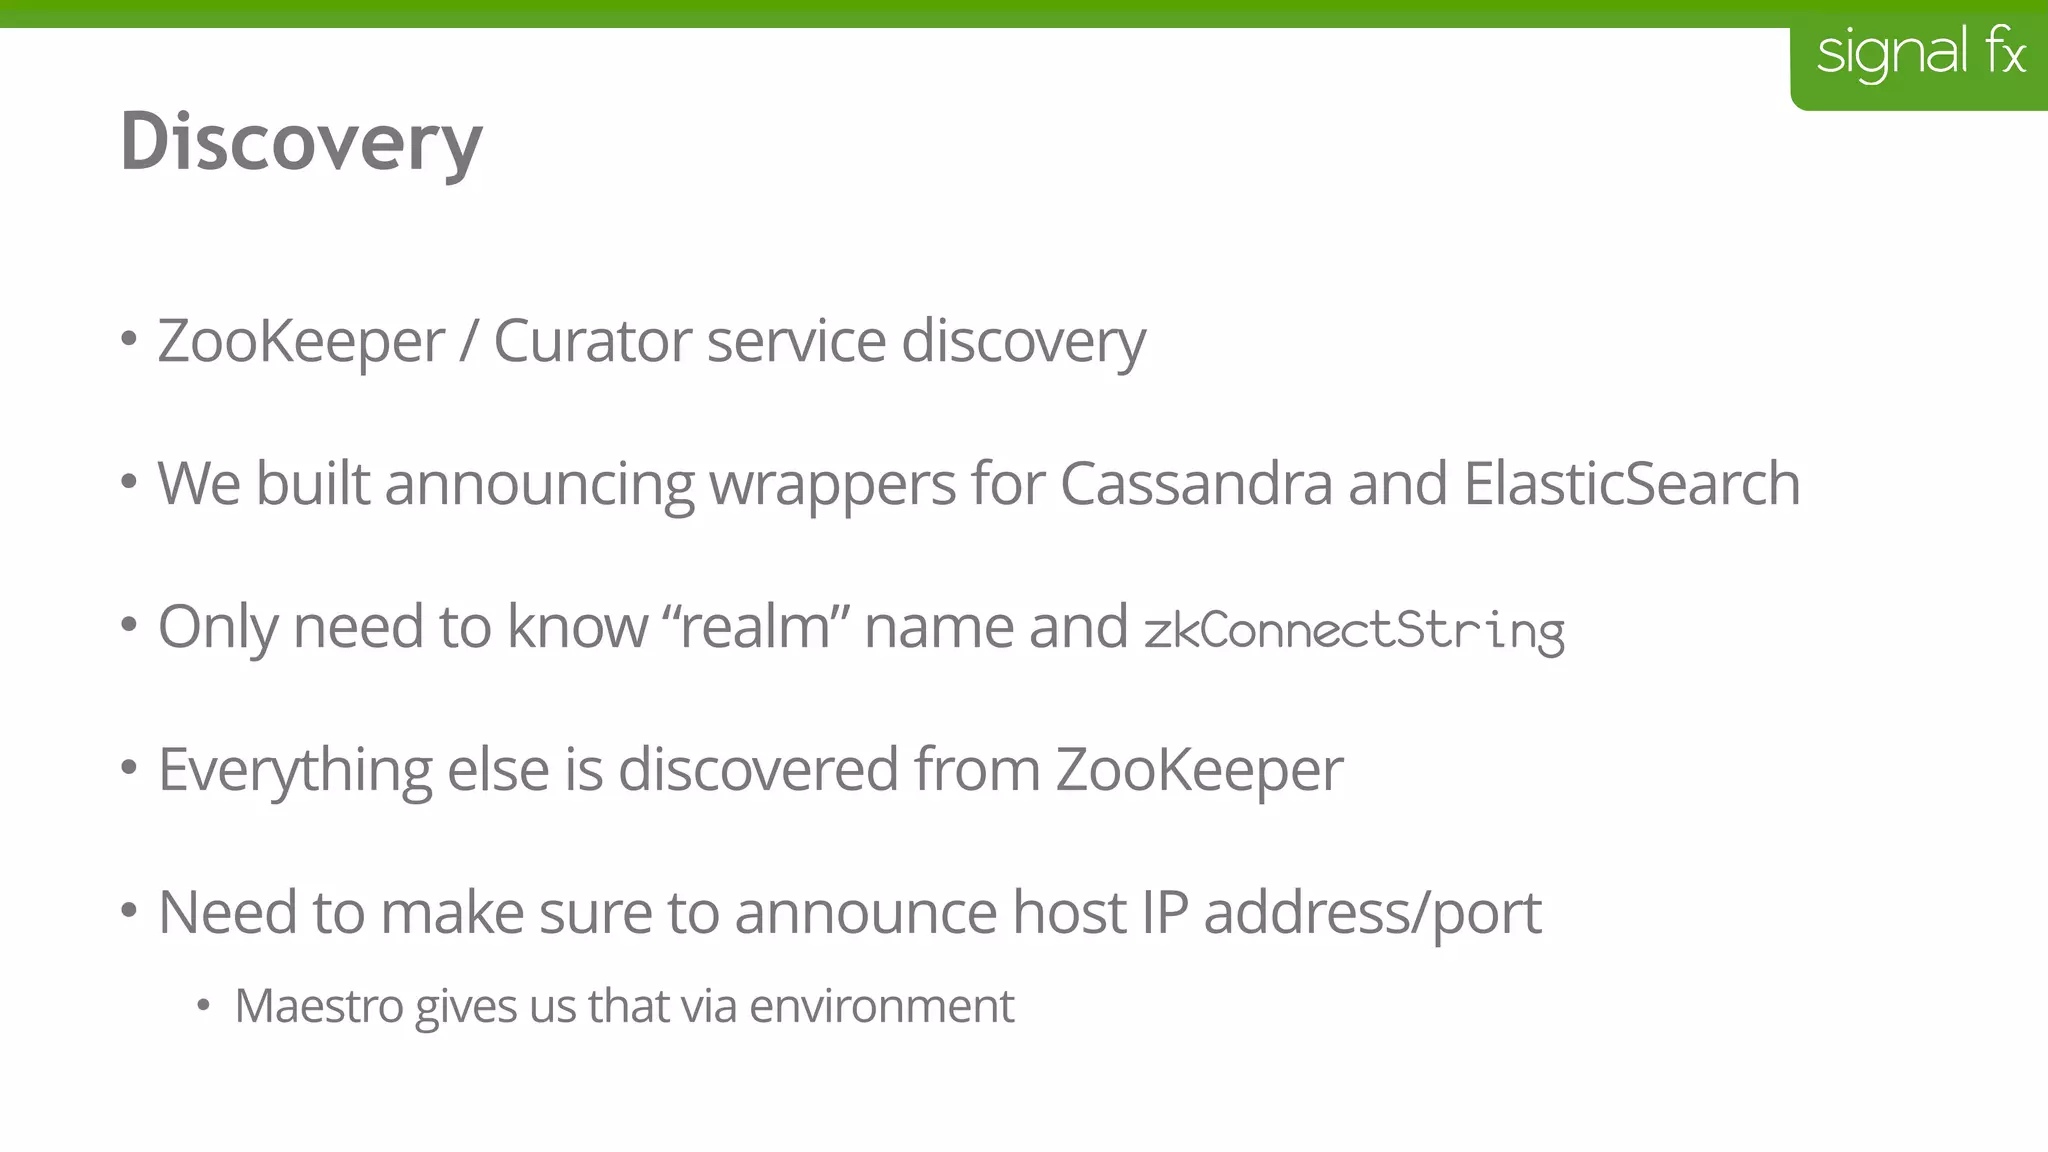
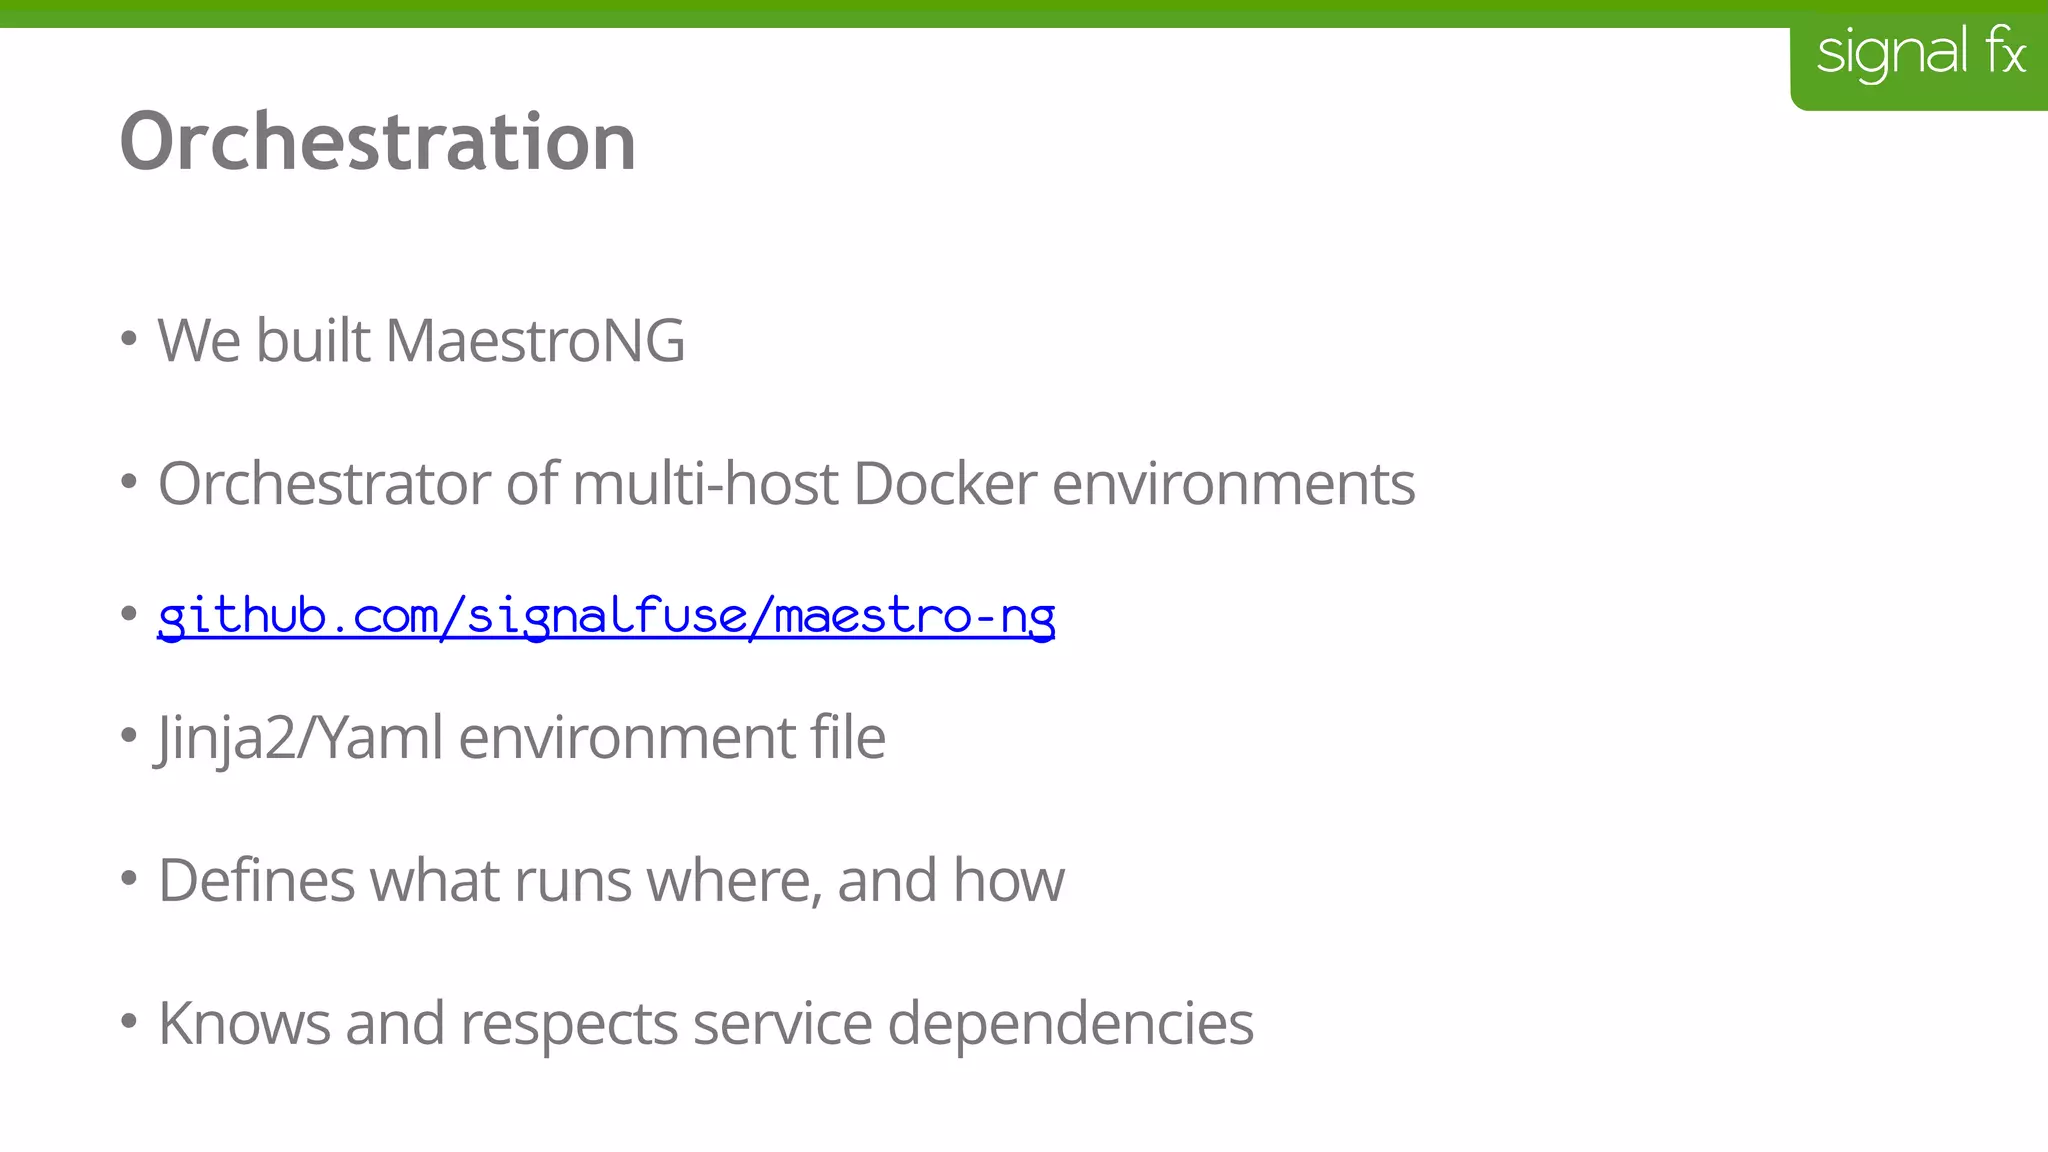

Maxime Petazzoni presented at the Palo Alto Docker Meetup on September 1, 2015, discussing SignalFx, a real-time monitoring system designed for modern applications. He outlined the use of Docker within SignalFx for containerization, application delivery, and infrastructure independence, emphasizing automated deployment and continuous integration processes. The talk also covered monitoring containers using SignalFx, the importance of metrics, and instrumentation for better visibility into system performance.


![[Draft] Fast Prototyping with DPDK and eBPF in Containernet](https://cdn.slidesharecdn.com/ss_thumbnails/draftfastprototypingwithdpdkandebpfincontainernet-180720185101-thumbnail.jpg?width=640&height=640&fit=bounds)


