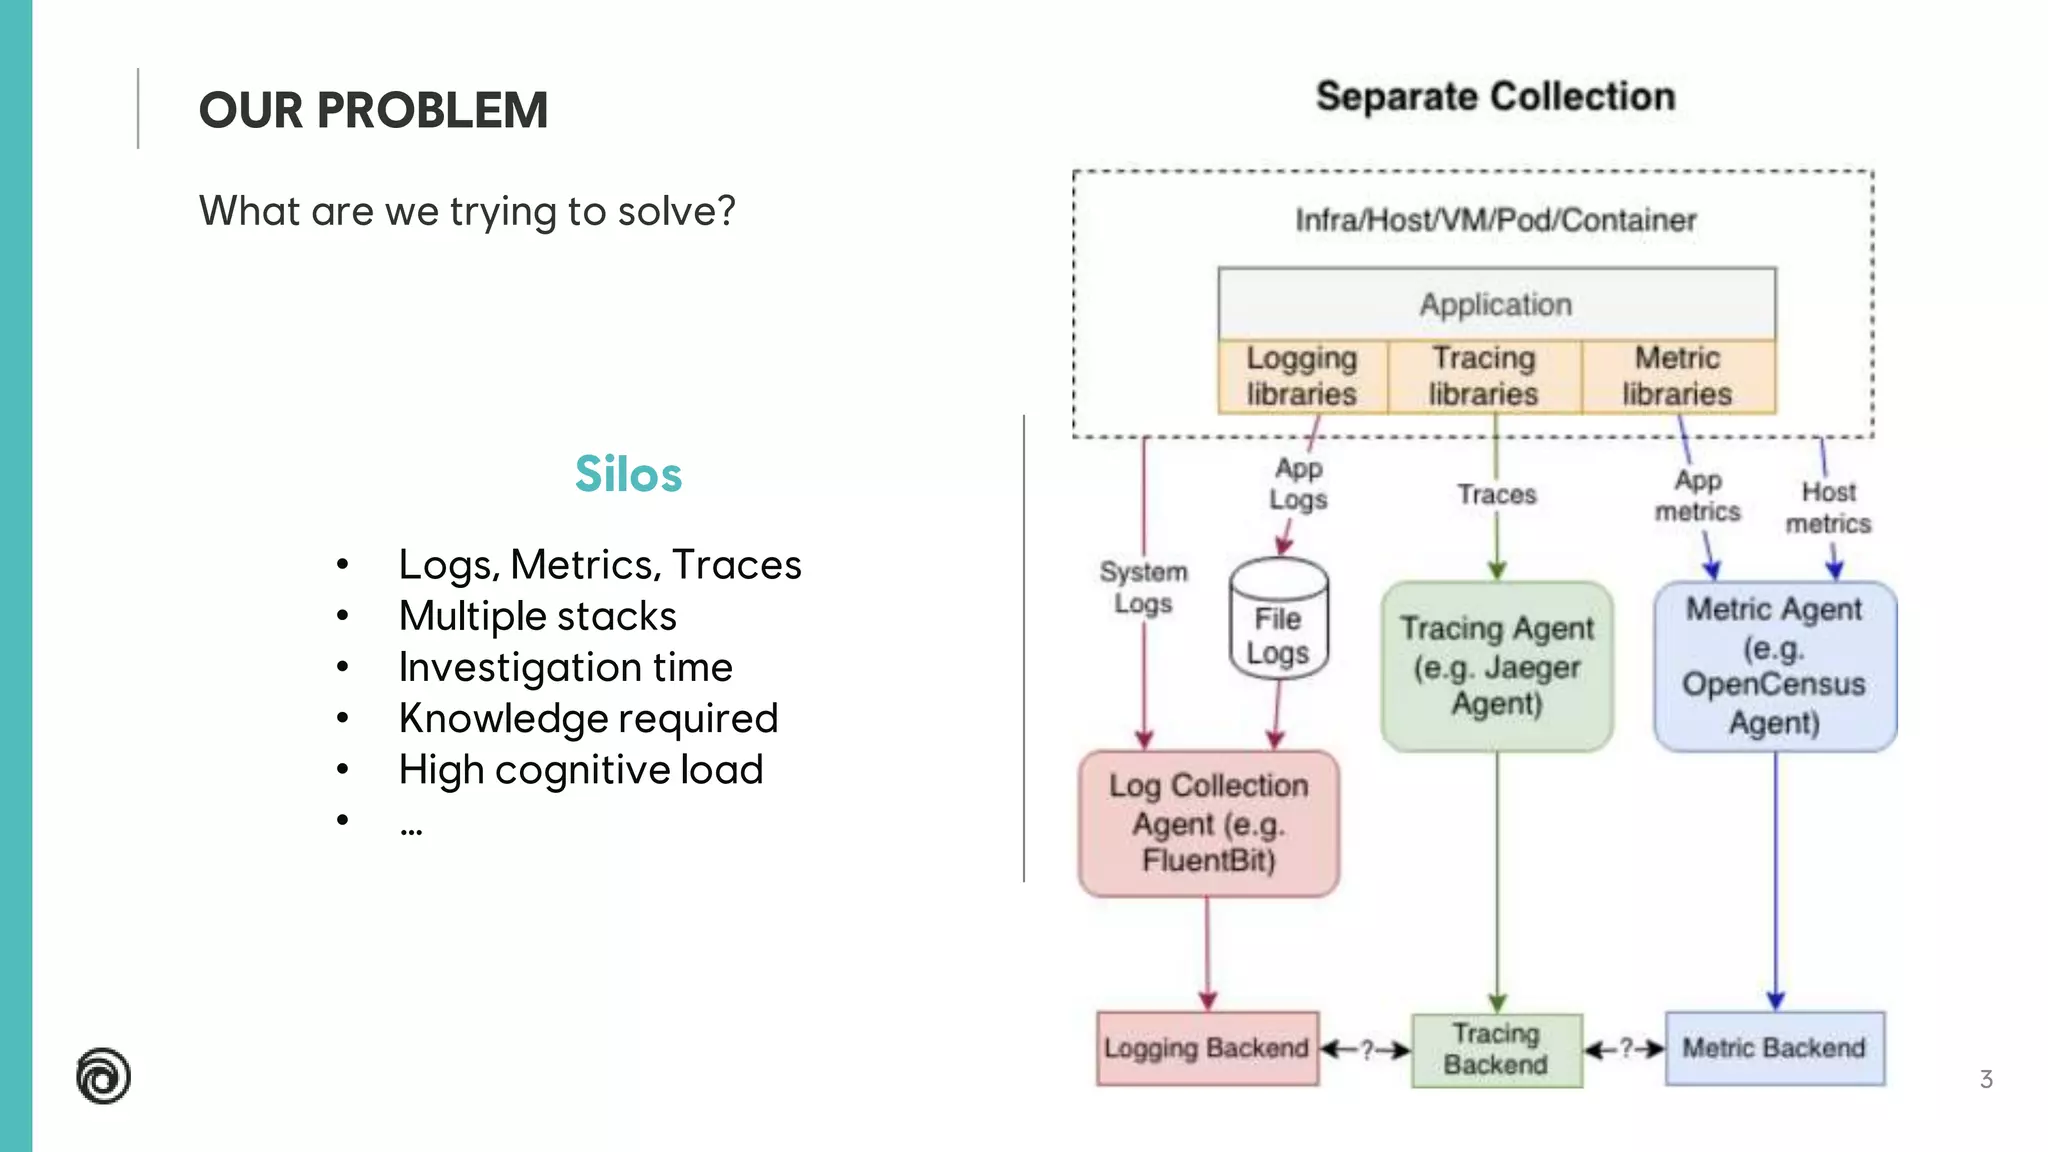
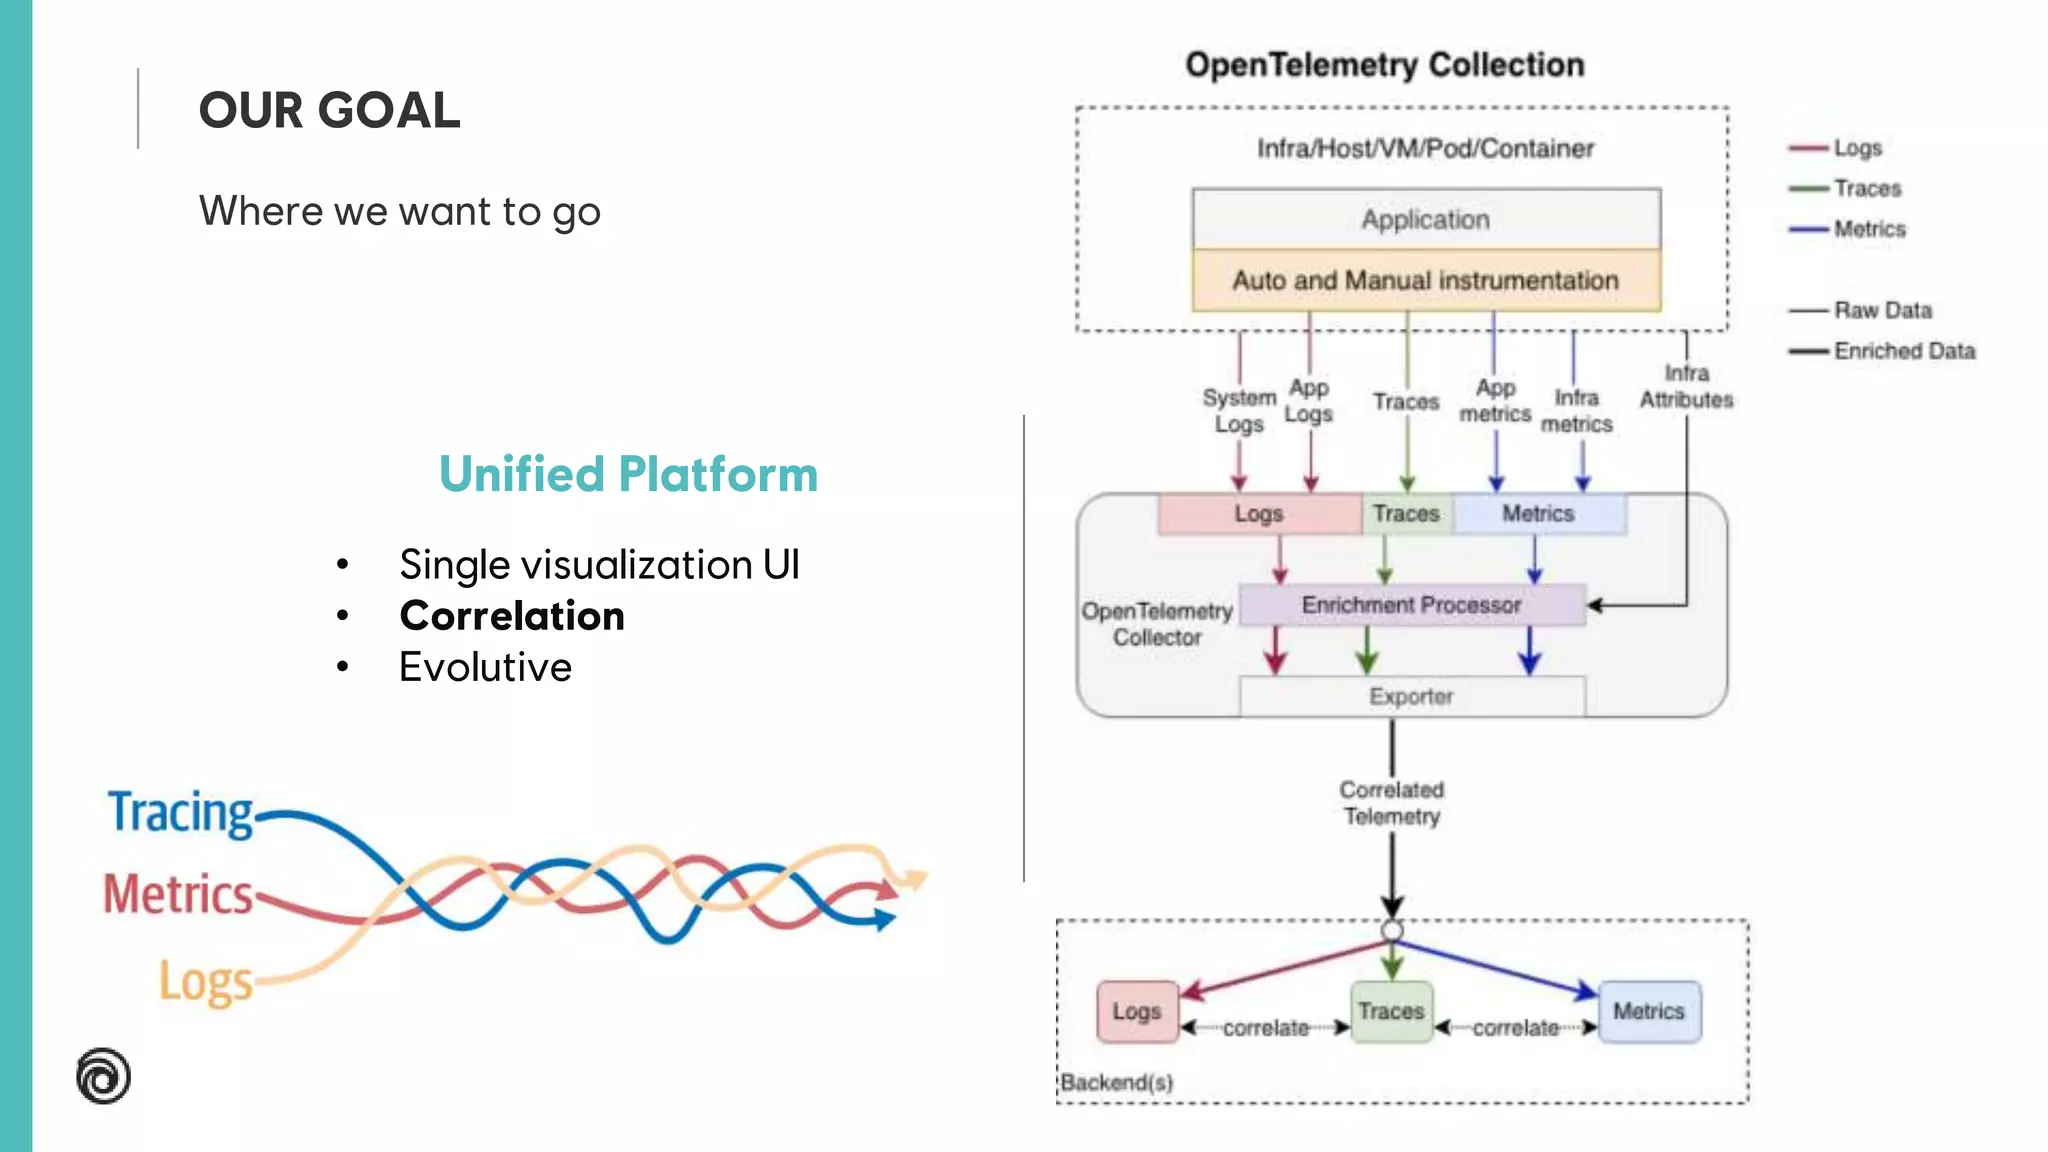
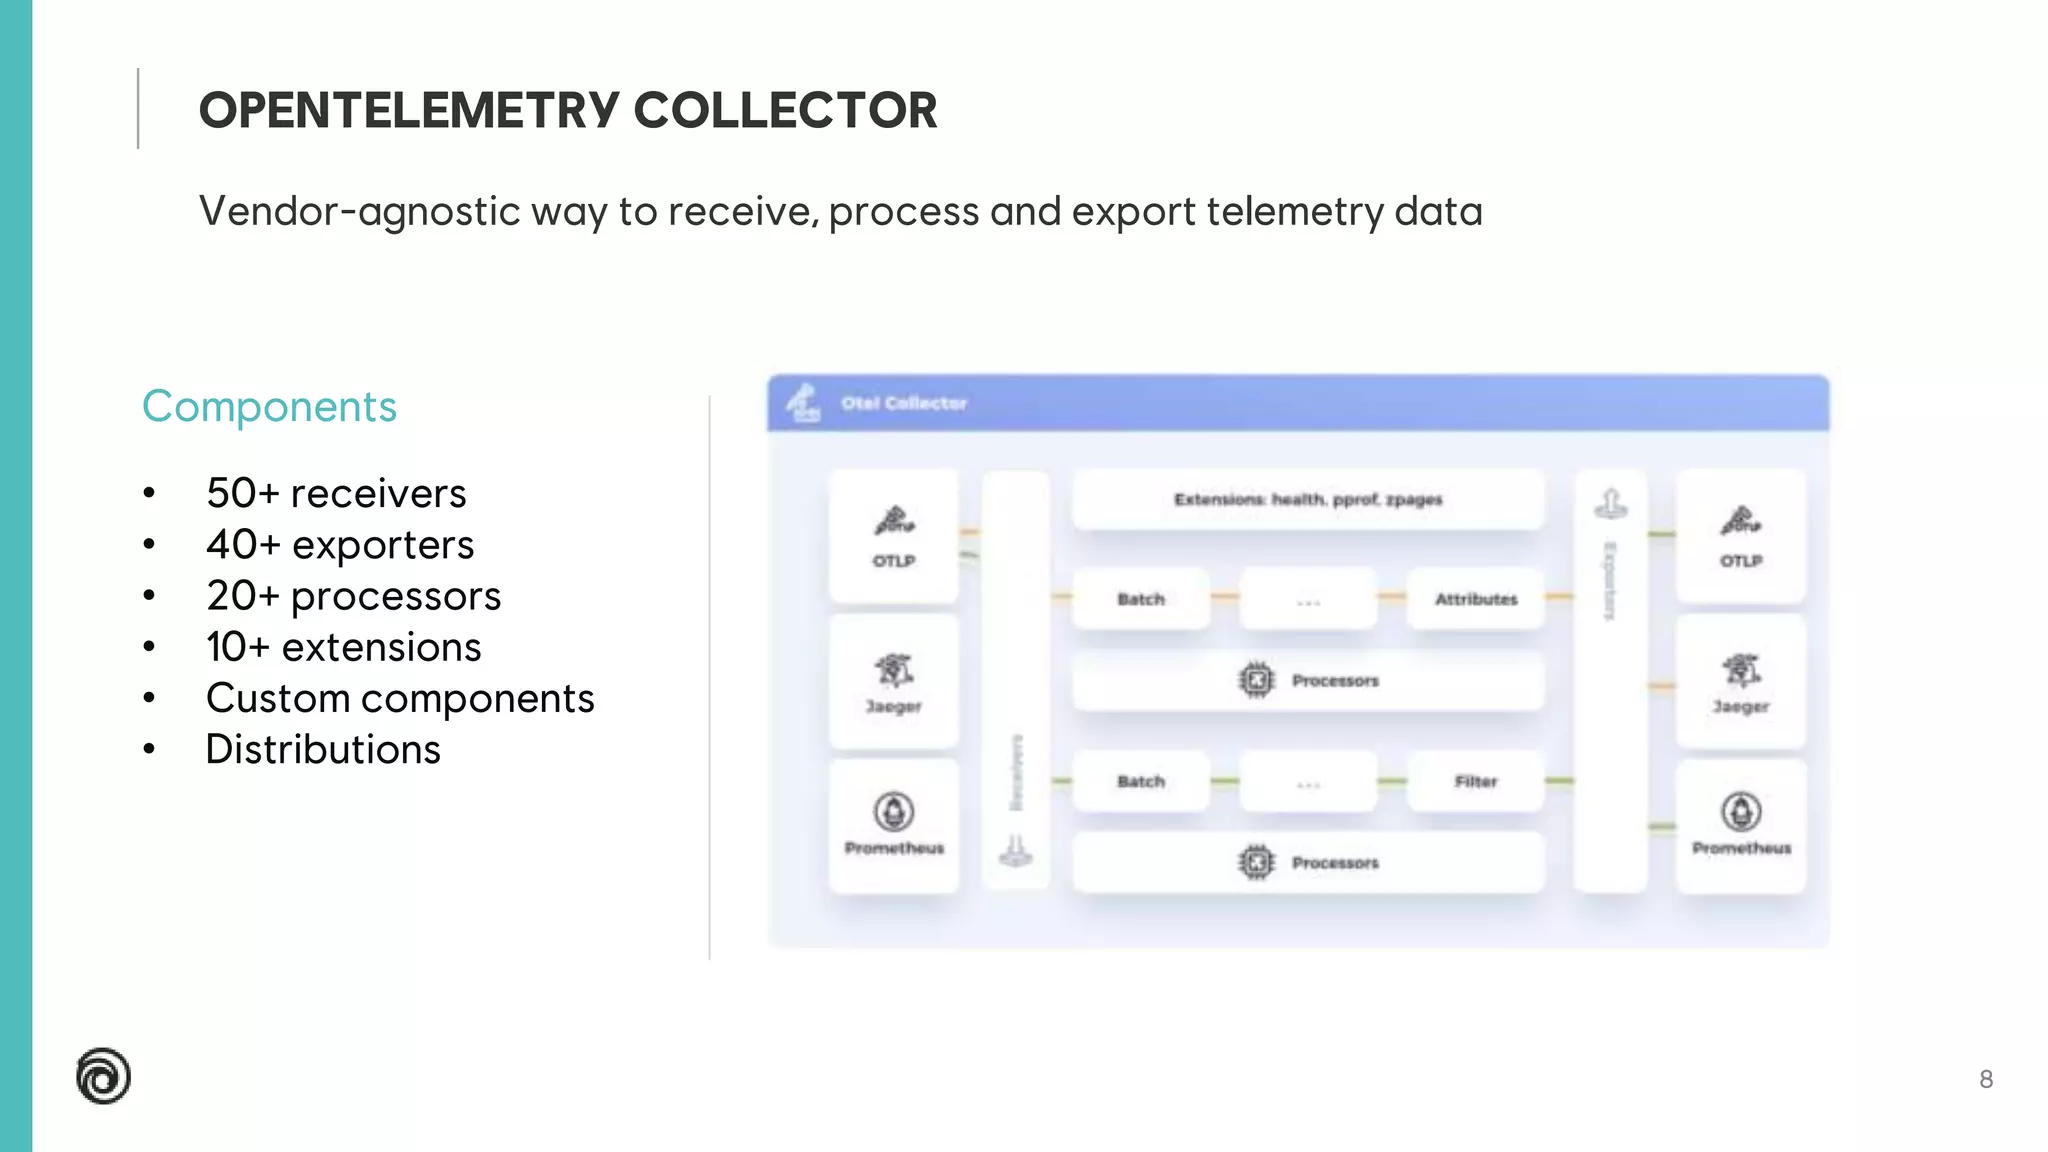
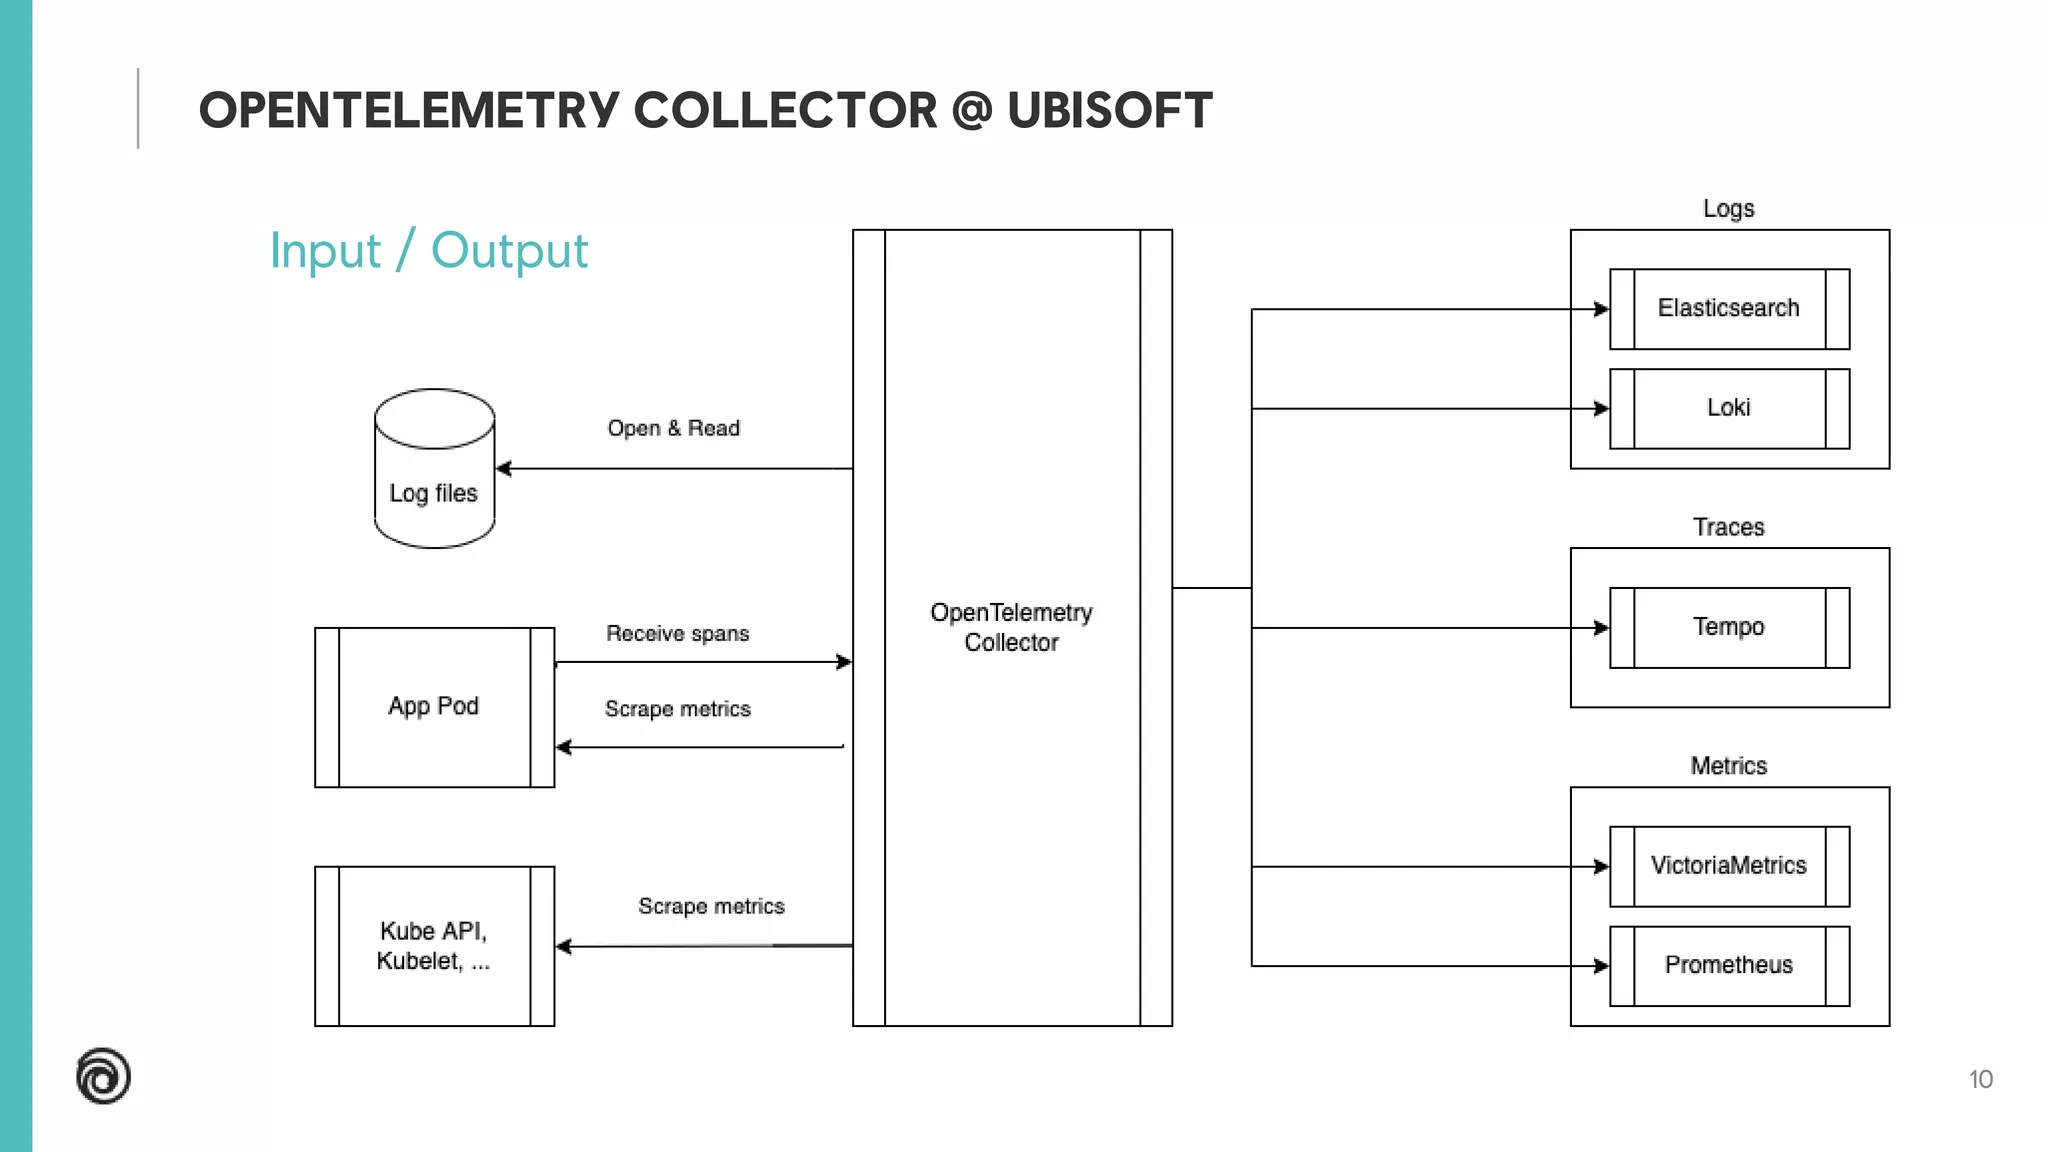
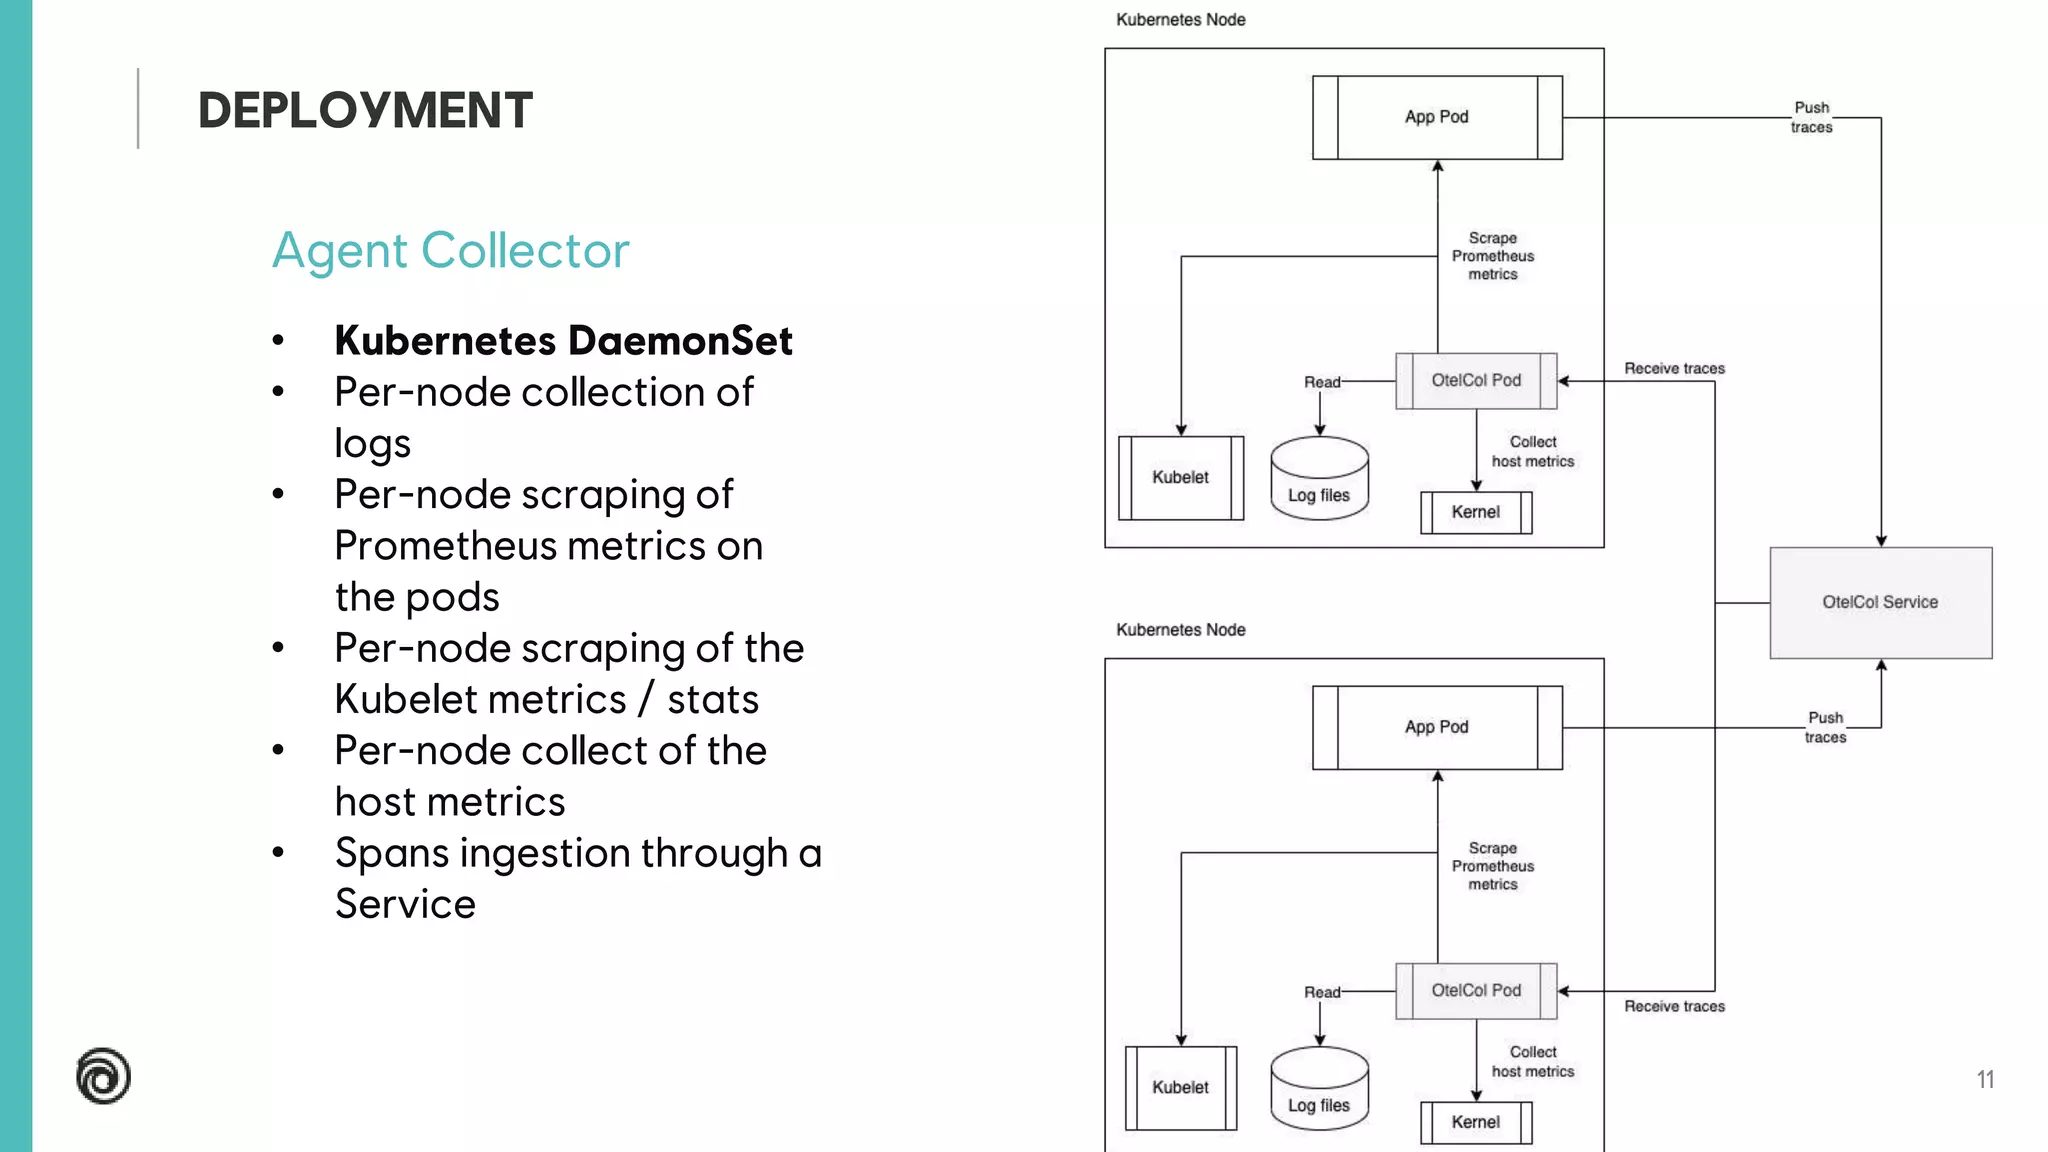
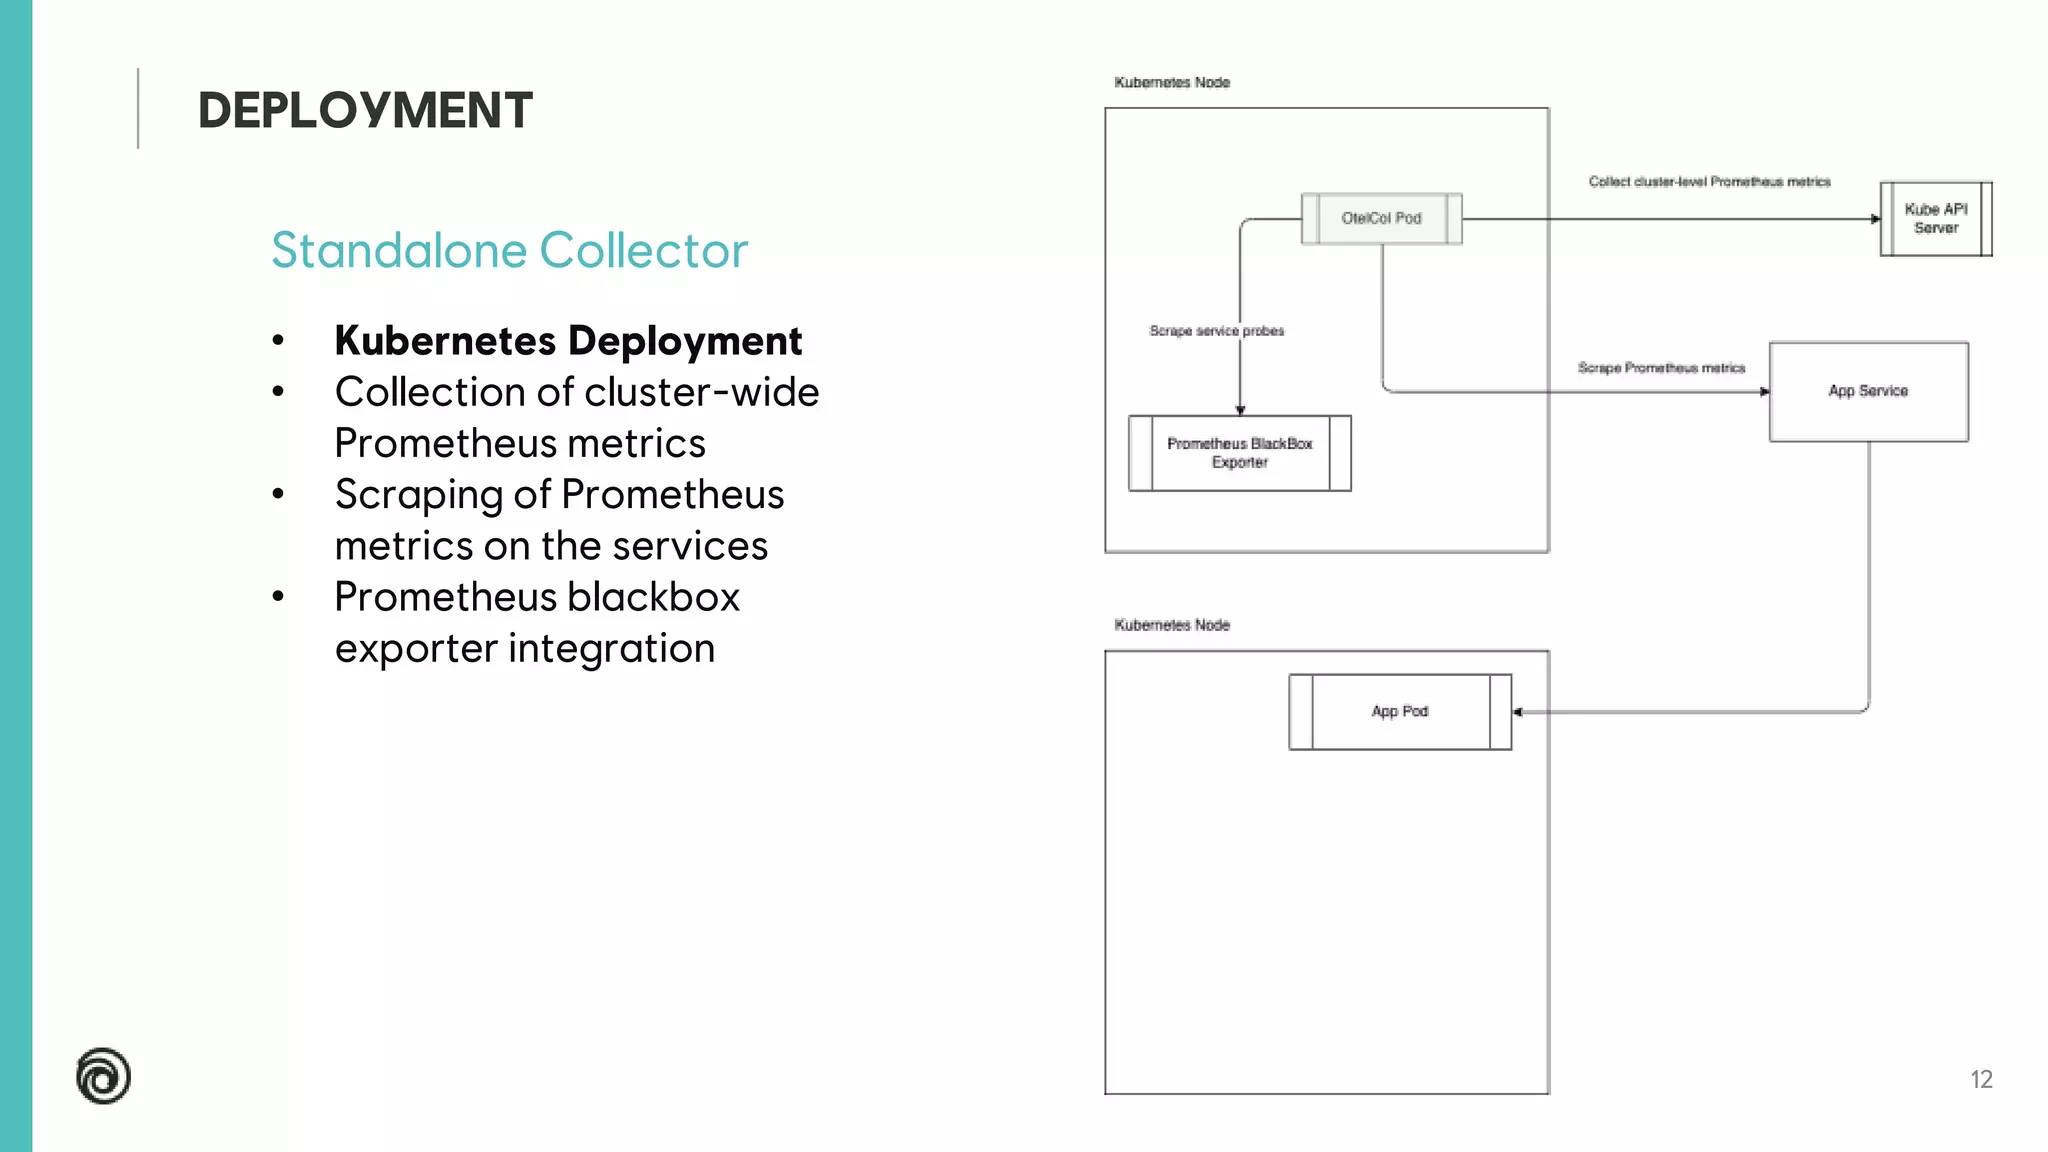
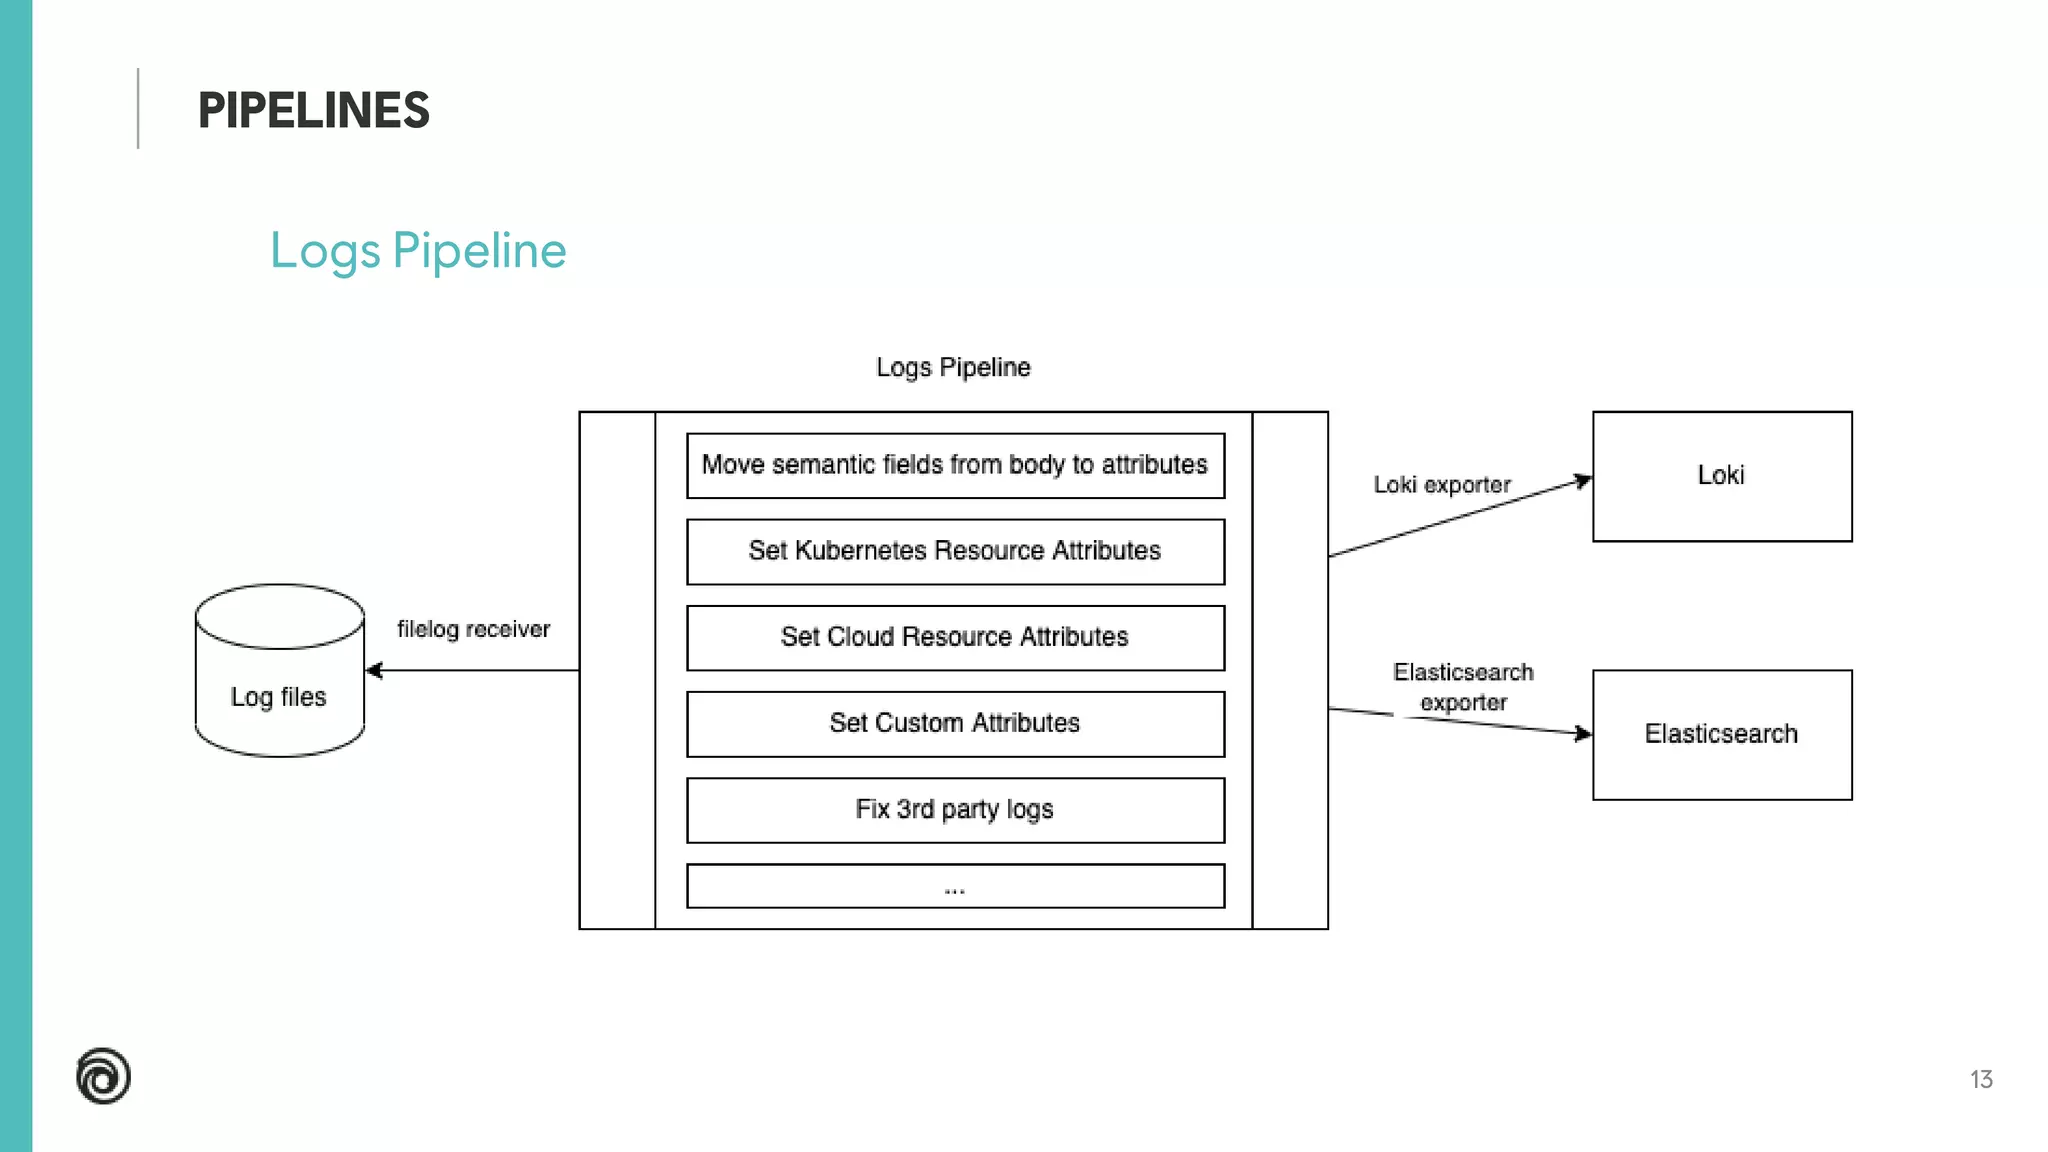
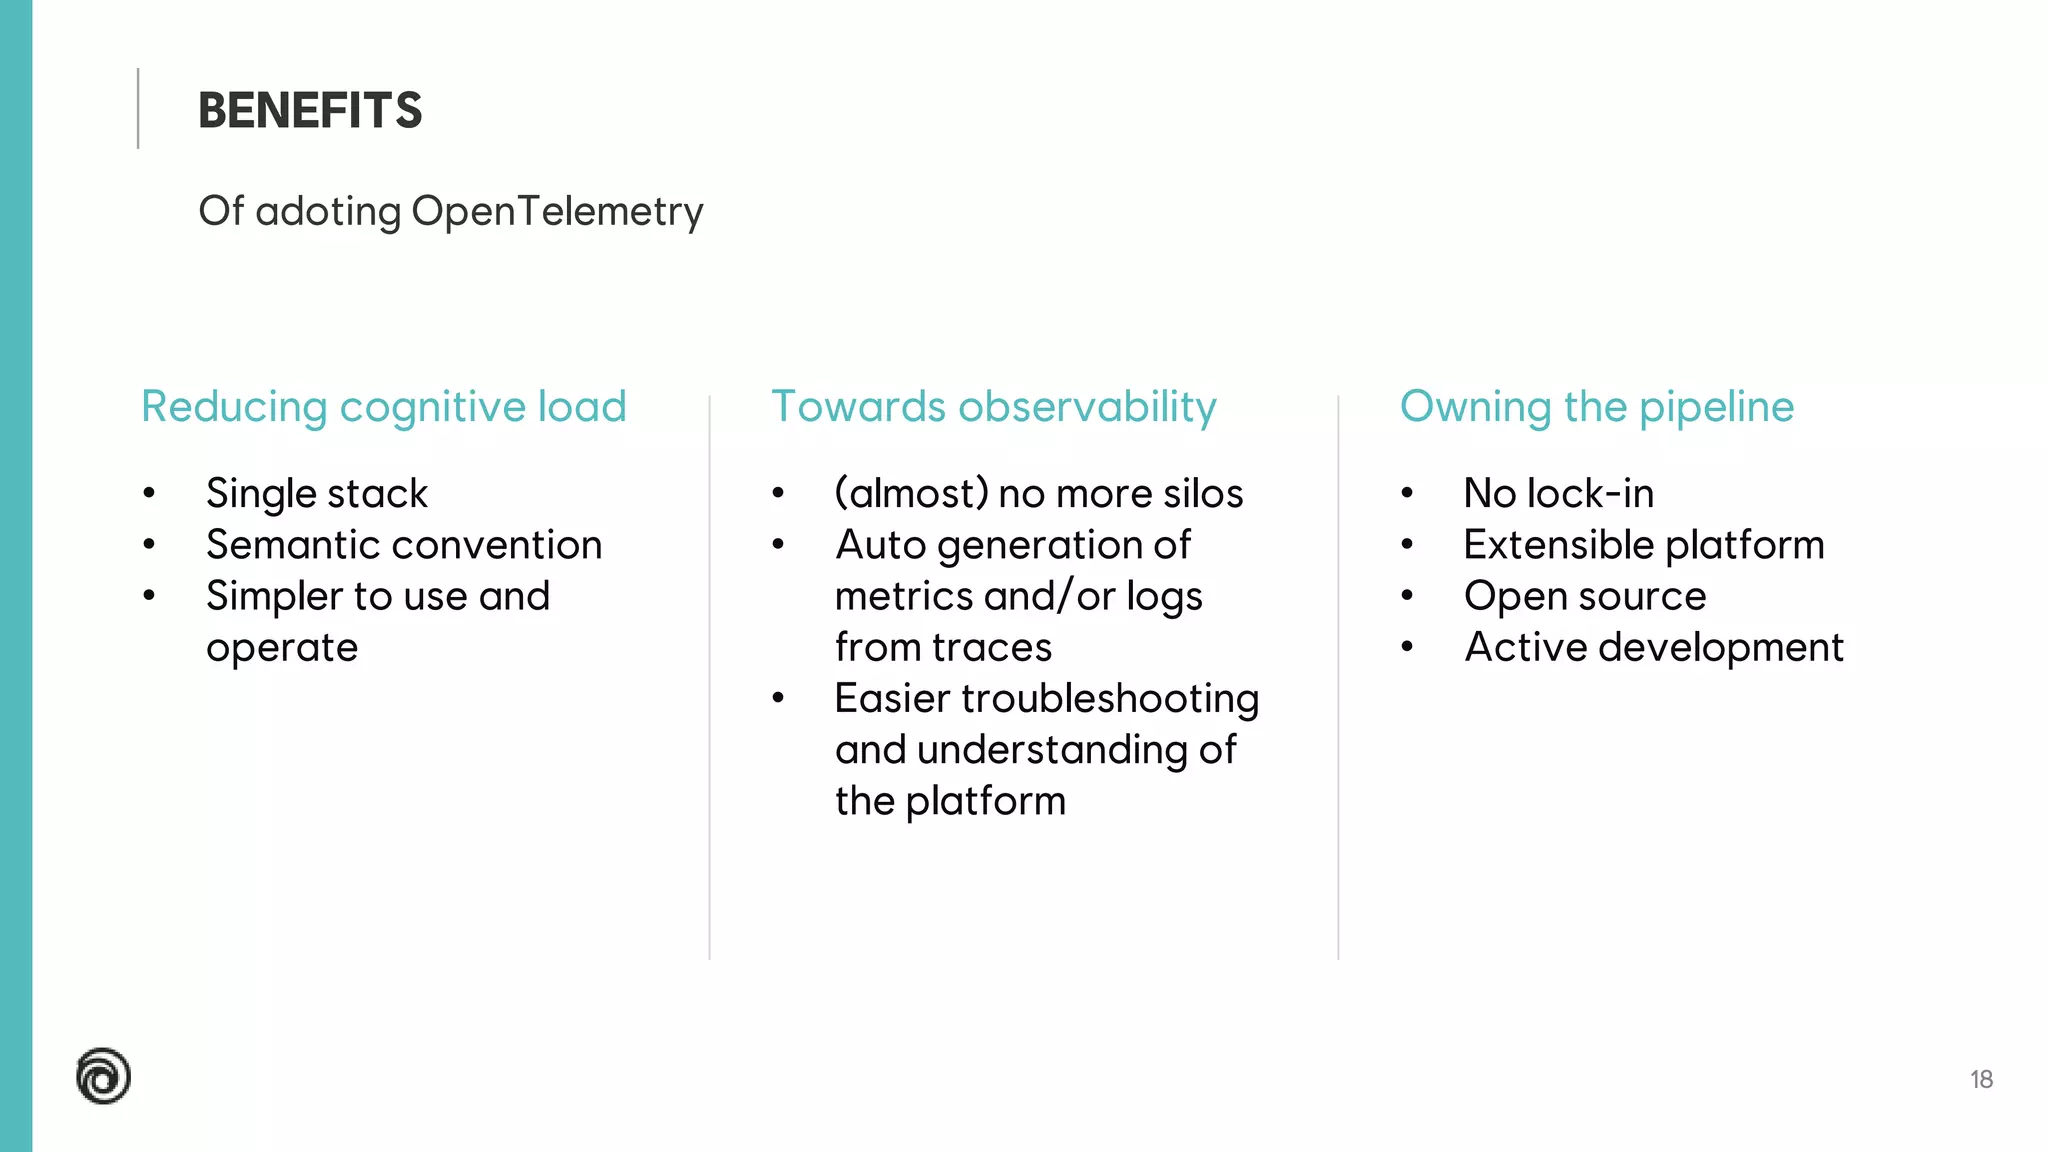
IT ENGINEERING & PLATFORM
ADOPTING
OPENTELEMETRY
05/04/2022
2
Senior Engineer
Vincent Behar
https://twitter.com/vbehar
Twitter
French video game company
Ubisoft
https://github.com/vbehar
GitHub
ABOUT ME
3
What are we trying to solve?
OUR PROBLEM
Silos
• Logs, Metrics, Traces
• Multiple stacks
• Investigation time
• Knowledge required
• High cognitive load
• …
4
Where we want to go
OUR GOAL
Unified Platform
• Single visualization UI
• Correlation
• Evolutive
5
DEMO
6
High-quality, ubiquitous, and portable telemetry to enable effective observability
OPENTELEMETRY
Open source
• 2019
• OpenTracing
• OpenCensus
• CNCF - #2 project
Contributors
• Amazon, Google, Microsoft,
RedHat, …
• Lightstep, Splunk,
Dynatrace, Grafana,
Honeycomb, New Relic,
Datadog, Elastic, …
7
Specifications
• Traces: stable
• Metrics: stable
• Logs: stable
• Semantic Conventions
• Propagation
• Protocol (OTLP)
• …
Implementations
• APIs
• SDKs
• Libraries
instrumentation
• 11 languages
Collector
• Interoperability
• Written in Go
• OpenCensus Service
• OTel’s killer feature
What’s in it?
OPENTELEMETRY
8
Components
• 50+ receivers
• 40+ exporters
• 20+ processors
• 10+ extensions
• Custom components
• Distributions
Vendor-agnostic way to receive, process and export telemetry data
OPENTELEMETRY COLLECTOR
9
Semantic conventions
• Spans attributes
• Application’s logs
(structured logging)
• Metrics labels
• Collector pipelines
API/SDK for tracing
• Stable API/SDK
available in multiple
languages
• Auto-instrumentation
• Adoption by libraries
• OTLP
Collector
• Single agent
• Interoperability
• Routing
• Custom processors
• Custom distribution
• Not just an agent, but
an extensible platform
And what are we using?
OPENTELEMETRY @ UBISOFT
10
Input / Output
OPENTELEMETRY COLLECTOR @ UBISOFT
11
Agent Collector
• Kubernetes DaemonSet
• Per-node collection of
logs
• Per-node scraping of
Prometheus metrics on
the pods
• Per-node scraping of the
Kubelet metrics / stats
• Per-node collect of the
host metrics
• Spans ingestion through a
Service
DEPLOYMENT
12
Standalone Collector
• Kubernetes Deployment
• Collection of cluster-wide
Prometheus metrics
• Scraping of Prometheus
metrics on the services
• Prometheus blackbox
exporter integration
DEPLOYMENT
13
Logs Pipeline
PIPELINES
14
Metrics Pipeline
PIPELINES
15
Traces Pipeline
PIPELINES
16
CUSTOM (LOGS) PROCESSORS
17
MONITORING
18
Reducing cognitive load
• Single stack
• Semantic convention
• Simpler to use and
operate
Towards observability
• (almost) no more silos
• Auto generation of
metrics and/or logs
from traces
• Easier troubleshooting
and understanding of
the platform
Owning the pipeline
• No lock-in
• Extensible platform
• Open source
• Active development
Of adoting OpenTelemetry
BENEFITS
19
Various level of maturity depending on the components
• Prometheus metrics labels naming convention vs Otel semantic convention
• Prometheus Exemplars are not fully supported
SHORTCOMINGS
20
Our next steps
WHAT’S NEXT
Tracing first
• Simplify instrumentation
• Generate metrics and logs
from traces at the collector
level
Continuous Profiling
• Parca – inspired by
Prometheus
• Would be great to collect
profiles from the
OpenTelemetry Collector
• Backends: Parca,
Pyroscope, …
21
CONCLUSION
UNIFIED PLATFORM
BREAK
THE SILOS
EMBRACE THE
COLLECTOR
ENJOY
IT ENGINEERING &
PLATFORM
THANK
YOU!
Q&A

Adopting OpenTelemetry

  • 1.
    IT ENGINEERING &PLATFORM ADOPTING OPENTELEMETRY 05/04/2022
  • 2.
    2 Senior Engineer Vincent Behar https://twitter.com/vbehar Twitter Frenchvideo game company Ubisoft https://github.com/vbehar GitHub ABOUT ME
  • 3.
    3 What are wetrying to solve? OUR PROBLEM Silos • Logs, Metrics, Traces • Multiple stacks • Investigation time • Knowledge required • High cognitive load • …
  • 4.
    4 Where we wantto go OUR GOAL Unified Platform • Single visualization UI • Correlation • Evolutive
  • 5.
  • 6.
    6 High-quality, ubiquitous, andportable telemetry to enable effective observability OPENTELEMETRY Open source • 2019 • OpenTracing • OpenCensus • CNCF - #2 project Contributors • Amazon, Google, Microsoft, RedHat, … • Lightstep, Splunk, Dynatrace, Grafana, Honeycomb, New Relic, Datadog, Elastic, …
  • 7.
    7 Specifications • Traces: stable •Metrics: stable • Logs: stable • Semantic Conventions • Propagation • Protocol (OTLP) • … Implementations • APIs • SDKs • Libraries instrumentation • 11 languages Collector • Interoperability • Written in Go • OpenCensus Service • OTel’s killer feature What’s in it? OPENTELEMETRY
  • 8.
    8 Components • 50+ receivers •40+ exporters • 20+ processors • 10+ extensions • Custom components • Distributions Vendor-agnostic way to receive, process and export telemetry data OPENTELEMETRY COLLECTOR
  • 9.
    9 Semantic conventions • Spansattributes • Application’s logs (structured logging) • Metrics labels • Collector pipelines API/SDK for tracing • Stable API/SDK available in multiple languages • Auto-instrumentation • Adoption by libraries • OTLP Collector • Single agent • Interoperability • Routing • Custom processors • Custom distribution • Not just an agent, but an extensible platform And what are we using? OPENTELEMETRY @ UBISOFT
  • 10.
  • 11.
    11 Agent Collector • KubernetesDaemonSet • Per-node collection of logs • Per-node scraping of Prometheus metrics on the pods • Per-node scraping of the Kubelet metrics / stats • Per-node collect of the host metrics • Spans ingestion through a Service DEPLOYMENT
  • 12.
    12 Standalone Collector • KubernetesDeployment • Collection of cluster-wide Prometheus metrics • Scraping of Prometheus metrics on the services • Prometheus blackbox exporter integration DEPLOYMENT
  • 13.
  • 14.
  • 15.
  • 16.
  • 17.
  • 18.
    18 Reducing cognitive load •Single stack • Semantic convention • Simpler to use and operate Towards observability • (almost) no more silos • Auto generation of metrics and/or logs from traces • Easier troubleshooting and understanding of the platform Owning the pipeline • No lock-in • Extensible platform • Open source • Active development Of adoting OpenTelemetry BENEFITS
  • 19.
    19 Various level ofmaturity depending on the components • Prometheus metrics labels naming convention vs Otel semantic convention • Prometheus Exemplars are not fully supported SHORTCOMINGS
  • 20.
    20 Our next steps WHAT’SNEXT Tracing first • Simplify instrumentation • Generate metrics and logs from traces at the collector level Continuous Profiling • Parca – inspired by Prometheus • Would be great to collect profiles from the OpenTelemetry Collector • Backends: Parca, Pyroscope, …
  • 21.
  • 22.
  • 23.