Downloaded 59 times


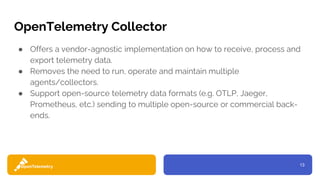
![receivers:
otlp:
protocols:
grpc:
max_recv_msg_size_mib: 32
max_concurrent_streams: 16
read_buffer_size: 1024
write_buffer_size: 1024
keepalive:
server_parameters:
max_connection_idle: 10s
processors:
memory_limiter:
ballast_size_mib: 192
check_interval: 5s
limit_mib: 448
spike_limit_mib: 64
batch:
send_batch_size: 64
timeout: 15s
exporters:
jaeger:
endpoint: jaeger.monitoring.svc.storefront-development.local.:14250
timeout: 10s
sending_queue:
enabled: true
num_consumers: 2
queue_size: 10
retry_on_failure:
enabled: true
initial_interval: 10s
max_interval: 60s
max_elapsed_time: 10m
prometheusremotewrite:
namespace: "monitoring"
sending_queue:
enabled: true
num_consumers: 2
queue_size: 10
retry_on_failure:
enabled: true
initial_interval: 10s
max_interval: 60s
max_elapsed_time: 10m
endpoint: ":8888"
ca_file: "/etc/pki/tls/certs/carbon-lb.pem"
write_buffer_size: 524288
headers:
Prometheus-Remote-Write-Version: "0.1.0"
X-Scope-OrgID: 234
extensions:
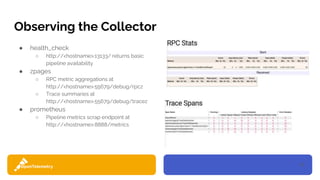
health_check:
port: 13133
zpages:
endpoint: :55679
service:
extensions: [zpages, health_check]
pipelines:
traces:
receivers: [otlp]
processors: [memory_limiter, batch]
exporters: [jaeger]
metrics:
receivers: [otlp]
processors: [memory_limiter, batch]
exporters: [prometheusremotewrite]
Full Configuration File Example](https://image.slidesharecdn.com/otelforoperators-1-201109165601/85/OpenTelemetry-For-Operators-23-320.jpg)
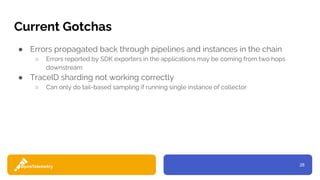
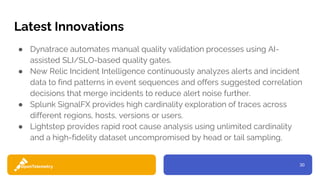


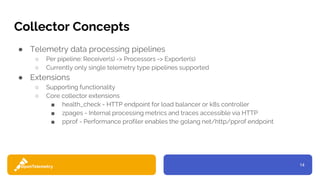
This document provides an overview of OpenTelemetry for operators. It discusses some of the limitations of current observability platforms and how OpenTelemetry addresses these issues. It introduces the OpenTelemetry project which combines distributed tracing, metrics, and logging APIs. It describes the OpenTelemetry Collector which receives, processes, and exports telemetry data. It provides examples of Collector configuration and running it in production. It also discusses some innovations in the observability space from vendors like Dynatrace, New Relic, Splunk SignalFX, and others.


![Jacob Marble [InfluxData] | Observability with InfluxDB IOx and OpenTelemetry...](https://cdn.slidesharecdn.com/ss_thumbnails/influxdbioxandopentelemetry-27-oct-2021jmarble-211022195239-thumbnail.jpg?width=640&height=640&fit=bounds)


