Downloaded 120 times


![17
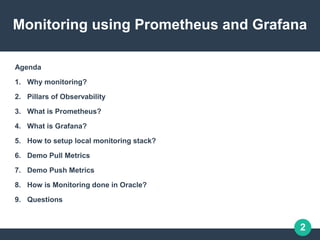
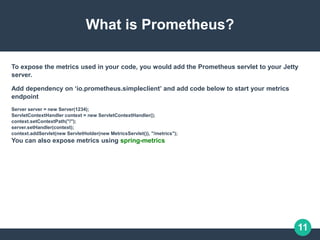
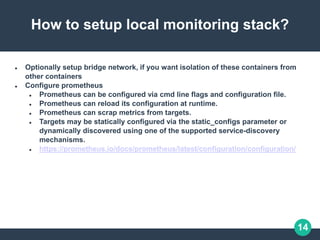
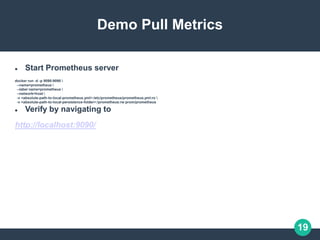
Demo Pull Metrics
Consider I have three endpoints I need to monitor.
Imagine that the first two endpoints are production targets, while the third one
represents a canary instance.
Configuration is as follows:
- job_name: 'example-random'
# Override the global default and scrape targets from this job every 5 seconds.
scrape_interval: 5s
static_configs:
- targets: ['localhost:8080', 'localhost:8081']
labels:
group: 'production'
- targets: ['localhost:8082']
labels:
group: 'canary'](https://image.slidesharecdn.com/lspeprometheusgrafanaoracle-191216060803/85/Monitoring-using-Prometheus-and-Grafana-17-320.jpg)
![20
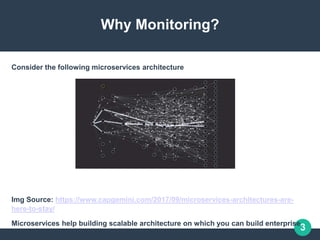
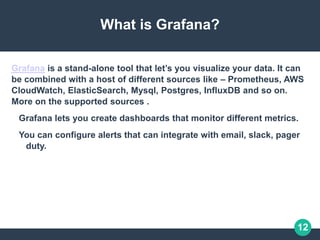
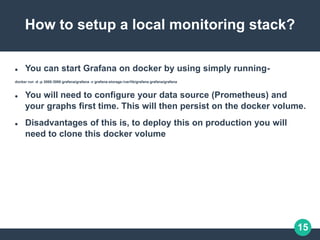
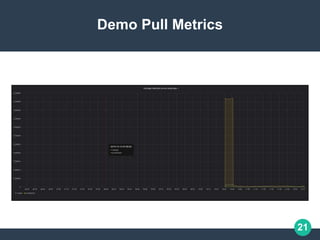
Demo Pull Metrics
Build Graph on grafana by selecting the Prometheus data source.
Set query:
sum(rate(go_gc_duration_seconds{job="example-random"}[10m]))
by (group)](https://image.slidesharecdn.com/lspeprometheusgrafanaoracle-191216060803/85/Monitoring-using-Prometheus-and-Grafana-20-320.jpg)
![22
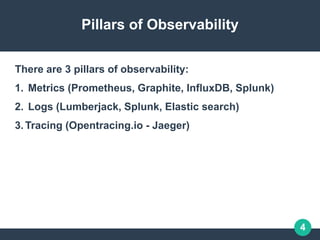
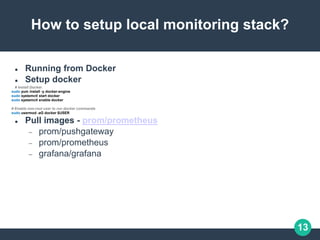
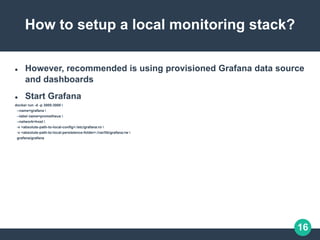
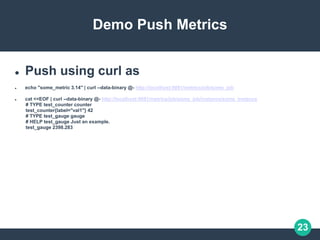
Demo Push Metrics
Configure prometheus to scrap of push gateway
# Scrape PushGateway for client metrics
- job_name: "pushgateway"
# Override the global default and scrape targets from this job every 5 seconds.
scrape_interval: 5s
# By default prometheus adds labels, job (=job_name) and instance (=host:port), to scrapped metrics. This may conflict
# with pushed metrics. Hence it’s recommended to set honor_labels to true, then the scrapped metrics ‘job’ and ‘instance’
# are retained
honor_labels: true
static_configs:
- targets: ["localhost:9091"]
Start push gateway
docker run -d -p 9091:9091
--name=pushgateway
--label name=prometheus
--network=host
prom/pushgateway](https://image.slidesharecdn.com/lspeprometheusgrafanaoracle-191216060803/85/Monitoring-using-Prometheus-and-Grafana-22-320.jpg)


The document provides an overview of monitoring using Prometheus and Grafana, detailing the importance of monitoring, the pillars of observability, and how to set up a local monitoring stack. It explains the functionalities of Prometheus, including its modes of operation, metric types, and how to expose metrics. Additionally, it covers Grafana as a visualization tool, showcasing how to create dashboards and configure alerts.