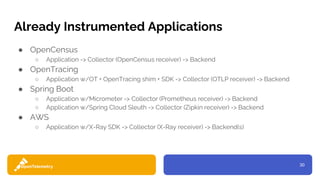
Downloaded 88 times


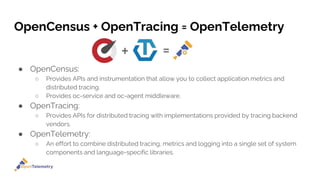


![Kubernetes Deployment - Proof of Concept
service:
pipelines:
traces:
receivers: [otlp]
processors: [memory_limiter, resource, ...]
exporters: [otlp]
metrics:
receivers: [otlp, prometheus]
processors: [memory_limiter, resource, ...]
exporters: [otlp]
service:
pipelines:
traces:
receivers: [otlp]
processors: [memory_limiter, batch, queued_retry]
exporters: [jaeger]
metrics:
receivers: [otlp]
processors: [memory_limiter]
exporters: [prometheus]](https://image.slidesharecdn.com/otelforarchitects-1-201109165601/85/OpenTelemetry-For-Architects-24-320.jpg)
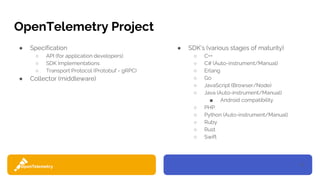
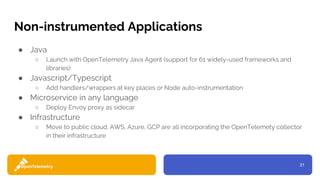
![Kubernetes Deployment - External Backends
service:
pipelines:
traces:
receivers: [otlp, zipkin]
processors: [memory_limiter, resource, ...]
exporters: [otlp]
metrics:
receivers: [otlp, prometheus]
processors: [memory_limiter, resource, ...]
exporters: [otlp]
service:
pipelines:
traces:
receivers: [otlp]
processors: [memory_limiter, batch, queued_retry]
exporters: [commercial...]
metrics:
receivers: [otlp]
processors: [memory_limiter, batch, queued_retry]
exporters: [commercial...]](https://image.slidesharecdn.com/otelforarchitects-1-201109165601/85/OpenTelemetry-For-Architects-25-320.jpg)
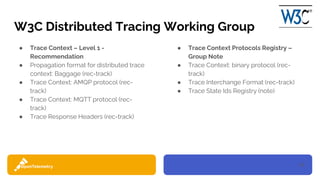
![Kubernetes Deployment - Service Mesh
service:
pipelines:
traces:
receivers: [zipkin]
processors: [memory_limiter, resource, ...]
exporters: [otlp]
metrics:
receivers: [statsd, prometheus]
processors: [memory_limiter, resource, ...]
exporters: [otlp]
service:
pipelines:
traces:
receivers: [otlp]
processors: [memory_limiter, batch, queued_retry]
exporters: [commercial...]
metrics:
receivers: [otlp]
processors: [memory_limiter, batch, queued_retry]
exporters: [commercial...]](https://image.slidesharecdn.com/otelforarchitects-1-201109165601/85/OpenTelemetry-For-Architects-26-320.jpg)
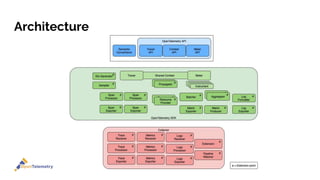
![Application Server on VM Deployment
service:
pipelines:
traces:
receivers: [otlp]
processors: [memory_limiter, resource, ...]
exporters: [otlp]
metrics:
receivers: [statsd, otlp]
processors: [memory_limiter, resource, ...]
exporters: [otlp]
service:
pipelines:
traces:
receivers: [otlp]
processors: [memory_limiter, batch, queued_retry]
exporters: [commercial...]
metrics:
receivers: [otlp]
processors: [memory_limiter, batch, queued_retry]
exporters: [commercial...]](https://image.slidesharecdn.com/otelforarchitects-1-201109165601/85/OpenTelemetry-For-Architects-27-320.jpg)


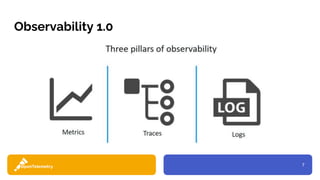
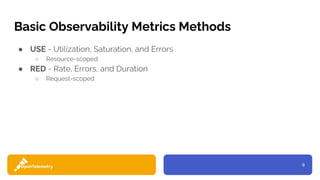
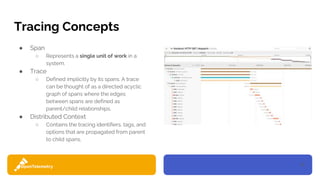
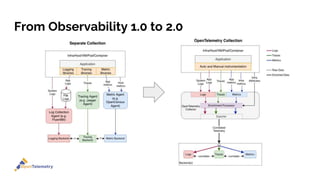
The document presents an overview of OpenTelemetry, discussing its importance in addressing shortcomings in current observability patterns, particularly for microservices. It covers foundational concepts of observability, including metrics, tracing, and limitations of previous systems, while also outlining deployment architectures and instrumentation strategies. The emphasis is on the integration of distributed tracing, metrics, and logging, enabling incremental improvements in telemetry collection across applications.