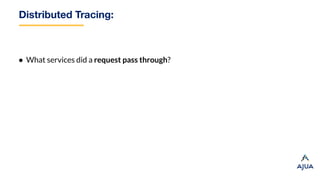
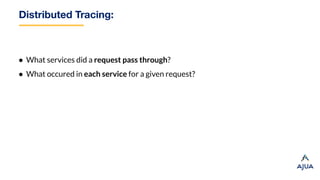
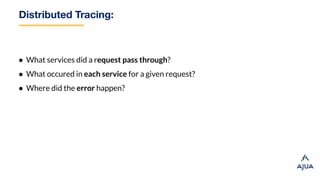
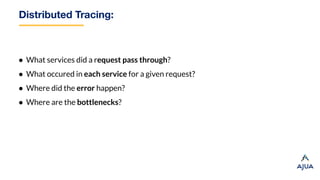
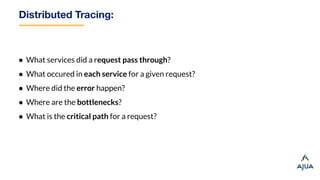
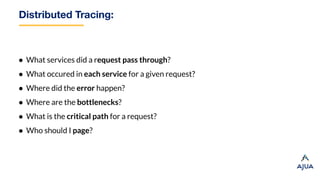
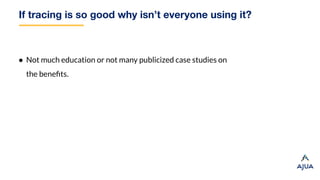
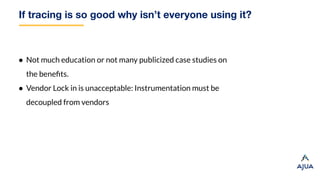
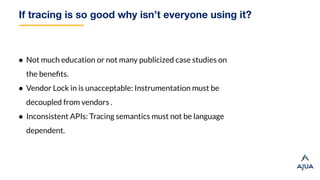
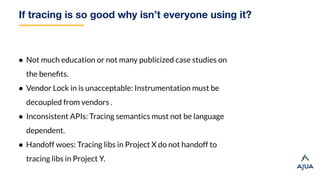
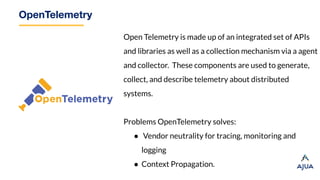
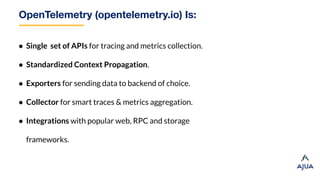
Everything You Wanted to
Know About Distributed Tracing.
Strange Loop Conference
September 2019
Who Am I
● Hungai Amuhinda
● Twitter: @Hungai
● Nairobi, Kenya
● Work: Ajua, Infra Team
● Website: hungaikev.in
How to use this talk
● Please don’t just follow it blindly: There are often times when you will need
to do things differently.
● Software is all about trade-offs: Very few decisions are about right and
wrong.
● Try things for yourself: Why not make Friday afternoons a time to play and
experiment?
Software Evolution.
● Monolith
● On Prem
● Single Language
● Single Stack
● Virtual Machines
Software Evolution.
● Microservices
● Containers
● Multi Cloud/ Hybrid
● Polyglot
● Containers
● Serverless/ Cloud Functions
New Architectures/ New Challenges.
● Observability
● Deployment / Packaging
● Configuration Management
● Debugging
● Secrets Management
Meet: Distributed Tracing
“Distributed Tracing, also called distributed request tracing, is a method used to
profile and monitor applications, especially those built using a microservices
architecture. Distributed tracing helps pinpoint where failures occur and what
causes poor performance.”
Distributed Tracing - Terminology
Trace - a trace is a tree of spans that
follows the course of a request or
system from its source to its ultimate
destination.
Each trace is a narrative that tells the
requests story as it travels through the
system.
Distributed Tracing - Terminology
Span - are logical units of work in a
distributed system. They all have a
name, a start time, and a duration.
Each Span captures important data
points specific to the current process
handling the request.
Distributed Tracing - Terminology
Context Propagation:
Incoming
Request
Distributed Tracing - Terminology
Context Propagation:
Incoming
Request
trace-id = 123
parent-d = nil
span-id = 1
Distributed Tracing - Terminology
Context Propagation:
Incoming
Request
trace-id = 123
parent-d = nil
span-id = 1
Outbound
Request
trace-id = 123
parent-d = 1
span-id = 2
Distributed Tracing - Terminology
Tags & Logs: both annotate the span with some contextual information.
● Tags typically apply to the whole span, while logs represent some events that
happened during the span execution.
● A log always has a timestamp that falls within the span's start-end time interval.
● The tracing system does not explicitly track causality between logged events the
way it keeps track of causality relationships between spans, because it can be
inferred from the timestamps.
What questions can tracing help us answer?
Distributed Tracing:
● What services did a request pass through?
Distributed Tracing:
● What services did a request pass through?
● What occured in each service for a given request?
Distributed Tracing:
● What services did a request pass through?
● What occured in each service for a given request?
● Where did the error happen?
Distributed Tracing:
● What services did a request pass through?
● What occured in each service for a given request?
● Where did the error happen?
● Where are the bottlenecks?
Distributed Tracing:
● What services did a request pass through?
● What occured in each service for a given request?
● Where did the error happen?
● Where are the bottlenecks?
● What is the critical path for a request?
Distributed Tracing:
● What services did a request pass through?
● What occured in each service for a given request?
● Where did the error happen?
● Where are the bottlenecks?
● What is the critical path for a request?
● Who should I page?
If tracing is so good why isn’t everyone using it?
● Not much education or not many publicized case studies on
the benefits.
If tracing is so good why isn’t everyone using it?
● Not much education or not many publicized case studies on
the benefits.
● Vendor Lock in is unacceptable: Instrumentation must be
decoupled from vendors
If tracing is so good why isn’t everyone using it?
● Not much education or not many publicized case studies on
the benefits.
● Vendor Lock in is unacceptable: Instrumentation must be
decoupled from vendors .
● Inconsistent APIs: Tracing semantics must not be language
dependent.
If tracing is so good why isn’t everyone using it?
● Not much education or not many publicized case studies on
the benefits.
● Vendor Lock in is unacceptable: Instrumentation must be
decoupled from vendors .
● Inconsistent APIs: Tracing semantics must not be language
dependent.
● Handoff woes: Tracing libs in Project X do not handoff to
tracing libs in Project Y.
Meet OpenTelemetry
OpenTelemetry
Open Telemetry is made up of an integrated set of APIs
and libraries as well as a collection mechanism via a agent
and collector. These components are used to generate,
collect, and describe telemetry about distributed
systems.
Problems OpenTelemetry solves:
● Vendor neutrality for tracing, monitoring and
logging
● Context Propagation.
OpenTelemetry (opentelemetry.io) Is:
● Single set of APIs for tracing and metrics collection.
● Standardized Context Propagation.
● Exporters for sending data to backend of choice.
● Collector for smart traces & metrics aggregation.
● Integrations with popular web, RPC and storage
frameworks.
OpenTelemetry (opentelemetry.io) Is:
Next major version of the OpenTracing and OpenCensus projects.
+ =
OpenTelemetry Roadmap:
+
Announcement: https://medium.com/opentracing/merging-opentracing-and-opencensus-f0fe9c7ca6f0
Roadmap: https://medium.com/opentracing/a-roadmap-to-convergence-b074e5815289
Tracing with OpenTelemetry - The Options
Agentless Using an Agent
OpenTelemetry: How to get Involved
Github: https://github.com/open-telemetry
Gitter: https://gitter.im/open-telemetry
Languages:
● .NET SDK
● GoLang SDK
● Java SDK
● JavaScript SDK
● Python SDK
● Ruby SIG
● Erlang/Elixir SDK
EXAMPLE
Create a Tracer
Create a Tracer
Tracers
Instrument
Instrument
Introducing Jaeger:
● Open source distributed tracing platform.
● Inspired by Google Dapper and OpenZipkin
● Created by Uber in 2015 and donated to CNCF in 2017.
● Compliant with both OpenTracing and OpenCensus.
● Supports multiple storage options (Cassandra, ElasticSearch, In-Memory)
● Compatible with Apache Kafka for backpressure management.
DEMO
obitech/micro-obs
Conclusion
● Tracing is crucial for understanding complex, microservices applications.
● Distributed tracing provides a base view of the system that can
drastically shorten feedback loops and the number of people involved
incidents.
● Tracing provides much more context, allowing an on call responder to
better understand the system and get further on their own before
involving more people.
Thank You
Twitter: @Hungai
Email: hungaikevin@gmail.com
Everything You wanted to Know About Distributed Tracing

Everything You wanted to Know About Distributed Tracing

  • 1.
    Everything You Wantedto Know About Distributed Tracing. Strange Loop Conference September 2019
  • 2.
    Who Am I ●Hungai Amuhinda ● Twitter: @Hungai ● Nairobi, Kenya ● Work: Ajua, Infra Team ● Website: hungaikev.in
  • 3.
    How to usethis talk ● Please don’t just follow it blindly: There are often times when you will need to do things differently. ● Software is all about trade-offs: Very few decisions are about right and wrong. ● Try things for yourself: Why not make Friday afternoons a time to play and experiment?
  • 4.
    Software Evolution. ● Monolith ●On Prem ● Single Language ● Single Stack ● Virtual Machines
  • 5.
    Software Evolution. ● Microservices ●Containers ● Multi Cloud/ Hybrid ● Polyglot ● Containers ● Serverless/ Cloud Functions
  • 6.
    New Architectures/ NewChallenges. ● Observability ● Deployment / Packaging ● Configuration Management ● Debugging ● Secrets Management
  • 7.
    Meet: Distributed Tracing “DistributedTracing, also called distributed request tracing, is a method used to profile and monitor applications, especially those built using a microservices architecture. Distributed tracing helps pinpoint where failures occur and what causes poor performance.”
  • 8.
    Distributed Tracing -Terminology Trace - a trace is a tree of spans that follows the course of a request or system from its source to its ultimate destination. Each trace is a narrative that tells the requests story as it travels through the system.
  • 9.
    Distributed Tracing -Terminology Span - are logical units of work in a distributed system. They all have a name, a start time, and a duration. Each Span captures important data points specific to the current process handling the request.
  • 10.
    Distributed Tracing -Terminology Context Propagation: Incoming Request
  • 11.
    Distributed Tracing -Terminology Context Propagation: Incoming Request trace-id = 123 parent-d = nil span-id = 1
  • 12.
    Distributed Tracing -Terminology Context Propagation: Incoming Request trace-id = 123 parent-d = nil span-id = 1 Outbound Request trace-id = 123 parent-d = 1 span-id = 2
  • 13.
    Distributed Tracing -Terminology Tags & Logs: both annotate the span with some contextual information. ● Tags typically apply to the whole span, while logs represent some events that happened during the span execution. ● A log always has a timestamp that falls within the span's start-end time interval. ● The tracing system does not explicitly track causality between logged events the way it keeps track of causality relationships between spans, because it can be inferred from the timestamps.
  • 14.
    What questions cantracing help us answer?
  • 15.
    Distributed Tracing: ● Whatservices did a request pass through?
  • 16.
    Distributed Tracing: ● Whatservices did a request pass through? ● What occured in each service for a given request?
  • 17.
    Distributed Tracing: ● Whatservices did a request pass through? ● What occured in each service for a given request? ● Where did the error happen?
  • 18.
    Distributed Tracing: ● Whatservices did a request pass through? ● What occured in each service for a given request? ● Where did the error happen? ● Where are the bottlenecks?
  • 19.
    Distributed Tracing: ● Whatservices did a request pass through? ● What occured in each service for a given request? ● Where did the error happen? ● Where are the bottlenecks? ● What is the critical path for a request?
  • 20.
    Distributed Tracing: ● Whatservices did a request pass through? ● What occured in each service for a given request? ● Where did the error happen? ● Where are the bottlenecks? ● What is the critical path for a request? ● Who should I page?
  • 21.
    If tracing isso good why isn’t everyone using it?
  • 22.
    If tracing isso good why isn’t everyone using it? ● Not much education or not many publicized case studies on the benefits.
  • 23.
    If tracing isso good why isn’t everyone using it? ● Not much education or not many publicized case studies on the benefits. ● Vendor Lock in is unacceptable: Instrumentation must be decoupled from vendors
  • 24.
    If tracing isso good why isn’t everyone using it? ● Not much education or not many publicized case studies on the benefits. ● Vendor Lock in is unacceptable: Instrumentation must be decoupled from vendors . ● Inconsistent APIs: Tracing semantics must not be language dependent.
  • 25.
    If tracing isso good why isn’t everyone using it? ● Not much education or not many publicized case studies on the benefits. ● Vendor Lock in is unacceptable: Instrumentation must be decoupled from vendors . ● Inconsistent APIs: Tracing semantics must not be language dependent. ● Handoff woes: Tracing libs in Project X do not handoff to tracing libs in Project Y.
  • 26.
  • 27.
    OpenTelemetry Open Telemetry ismade up of an integrated set of APIs and libraries as well as a collection mechanism via a agent and collector. These components are used to generate, collect, and describe telemetry about distributed systems. Problems OpenTelemetry solves: ● Vendor neutrality for tracing, monitoring and logging ● Context Propagation.
  • 28.
    OpenTelemetry (opentelemetry.io) Is: ●Single set of APIs for tracing and metrics collection. ● Standardized Context Propagation. ● Exporters for sending data to backend of choice. ● Collector for smart traces & metrics aggregation. ● Integrations with popular web, RPC and storage frameworks.
  • 29.
    OpenTelemetry (opentelemetry.io) Is: Nextmajor version of the OpenTracing and OpenCensus projects. + =
  • 30.
  • 31.
    Tracing with OpenTelemetry- The Options Agentless Using an Agent
  • 32.
    OpenTelemetry: How toget Involved Github: https://github.com/open-telemetry Gitter: https://gitter.im/open-telemetry Languages: ● .NET SDK ● GoLang SDK ● Java SDK ● JavaScript SDK ● Python SDK ● Ruby SIG ● Erlang/Elixir SDK
  • 33.
  • 34.
  • 35.
  • 36.
  • 37.
  • 38.
  • 39.
    Introducing Jaeger: ● Opensource distributed tracing platform. ● Inspired by Google Dapper and OpenZipkin ● Created by Uber in 2015 and donated to CNCF in 2017. ● Compliant with both OpenTracing and OpenCensus. ● Supports multiple storage options (Cassandra, ElasticSearch, In-Memory) ● Compatible with Apache Kafka for backpressure management.
  • 40.
  • 41.
    Conclusion ● Tracing iscrucial for understanding complex, microservices applications. ● Distributed tracing provides a base view of the system that can drastically shorten feedback loops and the number of people involved incidents. ● Tracing provides much more context, allowing an on call responder to better understand the system and get further on their own before involving more people.
  • 42.
    Thank You Twitter: @Hungai Email:hungaikevin@gmail.com