Downloaded 20 times


![https://github.com/open-telemetry/opentelemetry-collector
otel-collector:
image: otel/opentelemetry-collector:latest
command: [ "--config=/etc/otel-collector-config.yaml" ]
volumes:
- ./otel-collector-config.yaml:/etc/otel-collector-config.yaml:Z
ports:
- "13133:13133"
- "4317:4317"
- "4318:4318"
depends_on:
- jaeger
Integrating Prometheus with OpenTelemetry
otel-collector-config.yaml](https://image.slidesharecdn.com/implementingobservabilityforkubernetes-230816202602-f708ab34/85/Implementing-Observability-for-Kubernetes-pdf-35-320.jpg)
![processors:
batch:
extensions:
health_check:
service:
extensions: [health_check]
pipelines:
traces:
receivers: [otlp]
processors: [batch]
exporters: [jaeger]
receivers:
otlp:
protocols:
grpc:
endpoint: otel-collector:4317
exporters:
jaeger:
endpoint: jaeger:14250
tls:
insecure: true
Integrating Prometheus with OpenTelemetry
otel-collector-config.yaml](https://image.slidesharecdn.com/implementingobservabilityforkubernetes-230816202602-f708ab34/85/Implementing-Observability-for-Kubernetes-pdf-36-320.jpg)


![Integrating Prometheus with OpenTelemetry
receivers:
..
prometheus:
config:
scrape_configs:
- job_name: 'service-a'
scrape_interval: 2s
metrics_path: '/metrics/prometheus'
static_configs:
- targets: [ 'service-a:8080' ]
- job_name: 'service-b'
scrape_interval: 2s
metrics_path: '/actuator/prometheus'
static_configs:
- targets: [ 'service-b:8081' ]
- job_name: 'service-c'
scrape_interval: 2s](https://image.slidesharecdn.com/implementingobservabilityforkubernetes-230816202602-f708ab34/85/Implementing-Observability-for-Kubernetes-pdf-39-320.jpg)


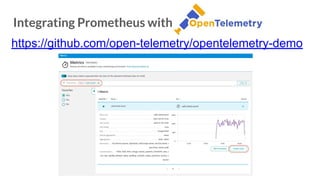


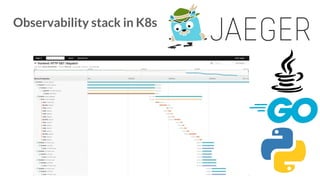
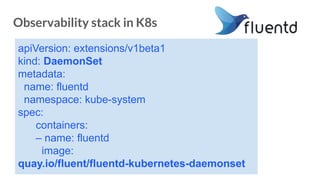
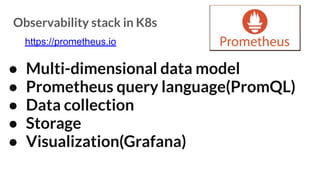
The document discusses the implementation of observability in Kubernetes, highlighting its importance for DevOps teams and detailing various metrics such as node status, resource usage, and application performance. It introduces tools like Prometheus, Jaeger, and Fluentd as part of an observability stack, emphasizing their roles in monitoring, logging, and distributed tracing. Additionally, it covers the integration of Prometheus with OpenTelemetry to enhance observability through data collection and processing.