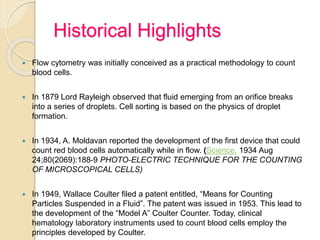
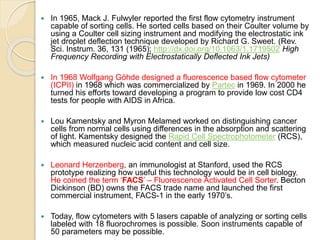
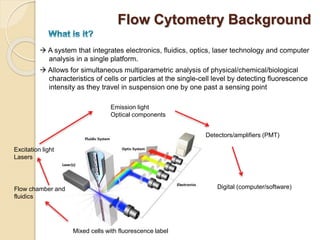
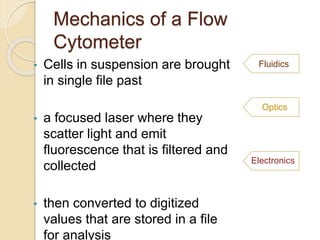
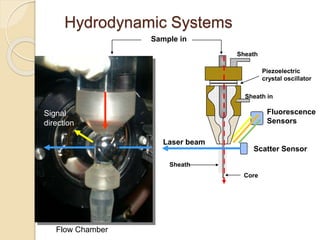
Flowcytometry
Dr.Dnyaneshwar Patale
SR PDCC Apheresis
ILBS
Outline
 History
 Basics of Flow
 Def
 Fluidics
 Optics
 Electronics
 Data analysis
 Application
Historical Highlights
 Flow cytometry was initially conceived as a practical methodology to count
blood cells.
 In 1879 Lord Rayleigh observed that fluid emerging from an orifice breaks
into a series of droplets. Cell sorting is based on the physics of droplet
formation.
 In 1934, A. Moldavan reported the development of the first device that could
count red blood cells automatically while in flow. (Science. 1934 Aug
24;80(2069):188-9 PHOTO-ELECTRIC TECHNIQUE FOR THE COUNTING
OF MICROSCOPICAL CELLS)
 In 1949, Wallace Coulter filed a patent entitled, “Means for Counting
Particles Suspended in a Fluid”. The patent was issued in 1953. This lead to
the development of the “Model A” Coulter Counter. Today, clinical
hematology laboratory instruments used to count blood cells employ the
principles developed by Coulter.
 In 1965, Mack J. Fulwyler reported the first flow cytometry instrument
capable of sorting cells. He sorted cells based on their Coulter volume by
using a Coulter cell sizing instrument and modifying the electrostatic ink
jet droplet deflection technique developed by Richard G. Sweet. (Rev.
Sci. Instrum. 36, 131 (1965); http://dx.doi.org/10.1063/1.1719502 High
Frequency Recording with Electrostatically Deflected Ink Jets)
 In 1968 Wolfgang Göhde designed a fluorescence based flow cytometer
(ICPII) in 1968 which was commercialized by Partec in 1969. In 2000 he
turned his efforts toward developing a program to provide low cost CD4
tests for people with AIDS in Africa.
 Lou Kamentsky and Myron Melamed worked on distinguishing cancer
cells from normal cells using differences in the absorption and scattering
of light. Kamentsky designed the Rapid Cell Spectrophotometer (RCS),
which measured nucleic acid content and cell size.
 Leonard Herzenberg, an immunologist at Stanford, used the RCS
prototype realizing how useful this technology would be in cell biology,
He coined the term ‘FACS’ – Fluorescence Activated Cell Sorter. Becton
Dickinson (BD) owns the FACS trade name and launched the first
commercial instrument, FACS-1 in the early 1970’s.
 Today, flow cytometers with 5 lasers capable of analyzing or sorting cells
labeled with 18 fluorochromes is possible. Soon instruments capable of
50 parameters may be possible.
What Is Flow Cytometry?
 Flow ~ motion
 Cyto ~ cell
 Metry ~ measure
Flow Cytometry Background
 A system that integrates electronics, fluidics, optics, laser technology and computer
analysis in a single platform.
 Allows for simultaneous multiparametric analysis of physical/chemical/biological
characteristics of cells or particles at the single-cell level by detecting fluorescence
intensity as they travel in suspension one by one past a sensing point
Flow chamber and
fluidics
Emission light
Optical components
Detectors/amplifiers (PMT)
Digital (computer/software)
Excitation light
Lasers
Mixed cells with fluorescence label
Optics
Fluidics
Electronics
Mechanics of a Flow
Cytometer
• Cells in suspension are brought
in single file past
• a focused laser where they
scatter light and emit
fluorescence that is filtered and
collected
• then converted to digitized
values that are stored in a file
for analysis
The Fluidics System
“Cells in suspension flow single file”
 Cells must flow one-by-one into the
cytometer to do single cell analysis
 Accomplished through a pressurized
laminar flow system.
 The sample is injected into a sheath fluid
as it passes through a small orifice
(50um-300um)
Hydrodynamic Systems
Sample in
Sheath
Sheath in
Laser beam
Piezoelectric
crystal oscillator
Fluorescence
Sensors
Scatter Sensor
Core
Sheath
Signal
direction
Flow Chamber
10 psi
10.2 psi
10 psi
10.4 psi
10 psi
10.8 psi
• Difference in pressure between sample and sheath
• This will control sample volume flow rate
• The greater the differential, the wider the sample core.
• If differential is too large, cells will no longer line up single
file
• Results in wider CV’s and increase in multiple cells passin
through the laser at once » » » Faster cell analysis BUT lo
Fluidics- Sample Differential
Hydrodynamic
Focusing
V. Kachel, H. Fellner-Feldegg & E. Menke - MLM Chapt. 3
Notice how the ink is focused
into a tight stream as it is
drawn into the tube under
laminar flow conditions.
PBS/Sheath
Sample/cells/core
Laminar flow
Hydrodynamic
Focusing
Laminar flow occurs when a fluid flows in parallel layers, with no
disruption between the layers
Incoming
Laser
Sample
Sheath Sheath
Sample
Core
Stream
Low Differential High Differential or “turbulent flow
Laser
Focal Point
Sample Preparation
Samples must be in single cell suspension
Solid tissue requires mechanical dissociation and often
enzymatic digestion
Adherent cell lines require detachment from the culture dish and
dissociation
Cell aggregates must be filtered out
Red cells should be lysed
Well prepared single cell suspensions yield good data
Common specimens suitable for flow
cytometry analysis include
Peripheral blood,
Bone marrow,
Body fluids,
Cerebrospinal fluid,
Urine,
Lymph node (cells or freshtissues),
Any fine-needleaspirates,
Fresh tissues suspicious for hematopoietic and lymphoiddisorders.
Interrogation
 Light source needs to be focused on the
same point where cells are focused.
 Light source
99%=Lasers
Lasers
Light amplification by stimulated emission of
radiation
 Lasers provide a single wavelength of light
(monochromatic)
 They can provide milliwatts to watts of power
 Low divergence
 Provide coherent light
 Gas, dye, or solid state
Coherent: all emiting photons have same wavelength,
phase and direction as stimulation photons
Light collection
 Collected photons are
the product of laser light
scattering or bouncing
off cells
 488nm
 Information associated
with physical attributes
of cells (size, granularity,
refractive index)
Scatter Fluorescence
VS
 Collected photons are
product of excitation with
subsequent emission
determined by fluorophore
 350nm-800nm
 Readout of intrinsic
(autofluorescence) or
extrinsic fluorescence
(intentional cell labeling)
Colors
 488 nm wavelength is the most commonly used type of laser in Flow Cytometers
 Many 5 laser instruments have these additional lasers
◦ 355 nm UV
◦ 405 nm Violet
◦ 640 nm Red
◦ 561 nm Yellow-Green
http://antonine-education.co.uk/
Forward Scatter
FSC
Detector
Laser Beam
Original from Purdue University Cytometry Laboratories
Different size cells
Particle or cell size (log scale) FSC
Number
of
events
small large
0.1 1 10 100 1000
0.9
20
90
200
700
While forward light scatter is not always related to cell size, in
The majority of cases between 1-20 microns, it is a reasonable estimate
Side Scatter
FSC
Detector
Collection
Lens
SSC
Detector
Laser Beam
Original from Purdue University Cytometry Laboratories
Side Scatter
Laser light that is scattered at 90
degrees to the axis of the laser path is
detected in the Side Scatter Channel
The intensity of this signal is
proportional to the amount of cytosolic
structure in the cell (eg. granules, cell
inclusions, drug delivery nanoparticles.)
Side Scatter=SSC=RALS=90 degree
Scatter
Why Look at FSC v. SSC
 Since FSC ~ size and SSC ~ internal
structure, a correlated measurement between
them can allow for differentiation of cell types
in a heterogenous cell population
FSC
SSC
Lymphocytes
Monocytes
Granulocytes
RBCs, Debris,
Dead Cells
LIVE
Dead
Optics- Filters
 Different wavelengths of light are scattered
simultaneously from a cell
Need to split the light into its specific wavelengths in
order to measure and quantify them independently.
This is done with filters
 Optical filters are designed such that they
absorb or reflect some wavelengths of light,
while transmitting others
 3 types of filters
Long Pass
Short Pass
Band Pass
Dichroic
Optical Filters
Optics- Dichroic Filters
 Long pass or short pass filters
 Placed at a 45º angle of incidence
 Part of the light reflected at 90º , and part
of the light is transmitted and continues
on.
Dichroic Filter
Detector 1
Detector 2
IMMUNOPHENOTYPING
ANALYSIS
Requires
Antibodies.
Fluorochromes.
 Highly specific monoclonal antibodies are usedthat are
produced by cloned antibody secreting cells.
 Antibodies are based on cluster of differentiation (CD)- a
protocol used for identification anddistinction of cell surface
antigens.
 Using CD system wecan identify cells by the presence or
absence of particular surface markers for e.g. CD3+ or CD20-
etc.
ANTIBODY
FLUOROCHROMES
Fluorochromes are substances that can be excited by
certain light source (such as laser) and emita
fluorescent signal at a single wavelength.
Fluorescent dyes can directly bind to certain cellular
content, such as DNA and RNA, and allow us to
perform quantitative analysis on individualcells.
However, in mostcases fluorochromes are conjugated
with monoclonal antibodies, which specifically target
cellular antigens/markers.
Understanding Fluoroscence
The fluorescent
molecule is excited
by the excitation
source (laser). This
imparts energy to
electrons in the
molecule which in
then released as
the molecule
relaxes. The
energy is released
as light.
e-
Excited
Resting
e-
e-
e-
e-
state
Mechanism of
Fluorscence
Fluorescence Detection
 Fluorochromes on the cell surface or inside the cell are
excited by the laser beam as the cell passes the
interrogation point.
 These fluorochromes then release energy as they leave
their excited state.
 The energy release is in the form of a photon with a
specific wavelength, longer than the excitation
wavelength.
 These photons of light are steered and collected by
optical lens and filters at specific wavelengths.
Characteristics of fluorochromes commonly
used in flow cytometry.
FLUOROCHROMES CONJUGATED TO ANTIBODIES EXCITATION WAVELENGTH(NM) EMISSIONWAVELENGTH(NM)
Fluorescein isothiocyanate(FITC) 488 530
Phycoerythrin (PE) 488 580
PE-Texas Red 488 615
PE-Cy5 488 670
Peridinin chlorophylprotein(PerCP) 488 670
Allophycocyanin (APC) 633 670
APC-Cy7 633 767
Interestingly, although some of them can be excited by the same light source, the
different fluorochromes may emit fluorescent signals with different
wavelengths/colors. Thus, multiple fluorochromes can be simultaneouslyexcited bya
light source and detected by their emission fluorescent signals with different
wavelengths, respectively.
How do I choose my
Fluorochromes ?
• Antibody availability
• Fluorochrome brightness
• Excitation source
• Emission filters
• Other fluorochromes/ Signals present in my
sample (spectral overlap)
Electronics
 Detectors basically collect photons of
light and convert them to an electrical
current
 The “electronics” process light signal
and convert the current to a digitized
value that computer can graph
Detectors
 There are two main types of photo
detectors used in flow cytometry
Photodiodes
 Used for strong signals, when saturation is a
potential problem (eg. FSC detector)
Photomultiplier tubes (PMT)
 Used for detecting small amounts of fluorescence
emitted from fluorochromes.
 Incredible Gain (amplification-up to 10million times)
 Low noise
• Fluorescent emissions are detected as a voltage pulse
from photomultiplier tube (PMT) detectors
• The area, voltage and height of the voltage pulse is
measured
Voltage
Laser
Laser
Laser
time
time
time
Voltage
Voltage
1.
2.
3.
Flow Cytometry: Signal Conversion
in PMT
Photon  Current  Voltage  Digital Signal
Forward light scatter (FSC) and side light scatter (SSC) . FSC collects
light at 180° from the point at which the laser beam intersects the cells .It
is correlated with cell size.and thus can distinguish normal lymphocytes
(small), monocytes (intermediate), and neoplastic cells (generally they
are large in size).
SSC collects right-angle light at 90° and is correlated with cytoplasmic
granularity and nuclearconfiguration.
 The combination of both FSC and SSC can distinguish normal
lymphocytes, granulocytes, and monocytes.
 The detection of lymphocytes and monocytes provides a reliable
internal control to evaluate the size of the cells of interest.
Basic parameters and Windows
of cell population
CD45 & SSC
• As the first step, it is most important todeterminewhetherthecells
of interest arehematopoietic.
• Generally speaking, all hematopoietic/lymphoid cells express
CD45 antigens (CD45+).
• Thus, a histogramof CD45 on a logarithmicscalevs. SSC on a linear
scale is indispensableasa starting pointof flow cytometryanalysis.
• Based onantigenexpression, cells aredivided into CD45+ and
CD45– groups.
• Among the CD45+ group, the cells can further separated into
subgroups based on expression levelsof CD45 and intensity of
cytoplasmicgranularity.
Compensation
 Fluorochromes typically fluoresce over a
large part of the spectrum (100nm or more)
 A detector may “see” fluorescence from
more than one fluorochrome. (referred to as
bleed over)
 You need to “compensate” for this bleed
over so that ONE detector reports signal
from only ONE fluorochrome
Histograms
Flow cytometry data can be plotted in several different ways:
• the axes of the graphs represent fluorescence intensity data, usually
plotted on a log scale
• for histograms, the y axis is cell number
Flow Cytometry: Data Analysis
 By cell distribution in the CD45vs. SSC. This is most
useful in a specimen containing mixed cell populations .
Thegrouped cells in individual windows represent different
celllineages.
 By cell size: In FSC vs. SSC histograms, neoplastic cells
(usually large in size) can be gated by using lymphocytes
(small) and monocytes (intermediate) as an internal size
control . Once thecells of interest aregated, furtheranalysis
of cell lineage can be performed.
 By cell lineage-specific antigens (immunophenotype) :
If cells are CD45+ but do not fit into particular windows in
the CD45 vs. SSC histogram, identification of lineage-
specific antigen expression is needed
Types of Gating
APPLICATION
Applications in Clinical Laboratories
 Immunophenotyping (HIV)
 CD4 absolute counts
 Leukemia and lymphoma immunophenotyping
 Cell cycle and ploidy analysis of tumors
 Reticulocyte enumeration
 Flow cross-matching (organ transplantation)
 Stem cell enumeration
 Residual white blood cell detection
 (QC platelet, red blood cells)
Applications in Blood Banking
 Fetomaternal Hemorrhage Testing
 Flow in AIHA Associated with a Negative DAT
 HLA Antibody Detection
 CD34+ cell enumeration and viability
 Platelet receptor defects (Bernard Soulier sndrome
and Glanzmann )
 Storage lesion studies
 Pretransfusion compatibility testing
Platelet analysis by flow…
 Identification of inherited disorders
 Monitoring of anti-platelet therapy
 Monitoring of clinical course of
disease
 Monitoring of platelet production in
thrombocytopenia
 Identification of patients at risk of
thrombosis
 Diagnosis of HIT
APPLICATION
Research Laboratories
 Immune function studies
 Hematopoietic stem cells
 Multi-drug resistance studies (cancer)
 Kinetics studies (cell function) Platelet analysis
(coronary disease)
 Environmental sample analysis
 Flow and FISH
APPLICATION
Immunophenotyping
 Is the term used in the identification of cells by
labeling with monoclonal antibodies identified as
cluster designations (CD)
 Used to determine
Cell lineage
Activation status
Adhesion migration and homing capacity of cells
Ability to respond to stimuli
Propidium iodide (PI) - Cell
Viability
How the assay works:
 PI cannot normally cross the cell membrane
 If the PI penetrates the cell membrane, it is assumed to be
damaged
 Cells that are brightly fluorescent with the PI are damaged or
dead
PI
PI
PI
PI
PI
PI
PI
PI
PI
PI
PI
PI
PI
PI
Viable Cell Damaged Cell
Minimum Residual Disease
 Patients that appear to be in complete
remission can be found to have residual
tumors cells that are too few in number to
be counted by standard techniques.
 Flow cytometry can detect these rare cells
before they proliferate and cause the
patient to relapse.
Flow Cytometric Crossmatch
(FCXM)
 Flow cytometry has become a valuable tool to
assess potential solid organ allograph
recipients.
 It is now recognized as the laboratory
procedure of choice. Circulating
alloantibodies at levels too low to be detected
by standard methods can be detected by a
flow cytometric crossmatch (FCXM).
 This means that transplants done based on a
negative FCXM are more successful.
Diagnosis of PNH
Conventional laboratory tests for the diagnosis of PNH
include the sugarwater testand the Ham’s acid hemolysis test .
Antibodies to CD55 and CD59 are specific for decay-
accelerating factor and membrane-inhibitor of reactive lysis,
respectively, and can be analyzed by flow cytometry to makea
definitive diagnosis of PNH.
DNA studies
• These assays involve measurements of fluoroscence
associated with DNA to determine
• Stage of cell cycle
• Apoptosis
• Gene Transfection
• Chromosomal Aberrations
• Endoreduplication
• Doubling Time
Leukemia and Lymphoma
 Lymphomas are tumors of the immune
system, primarily in the lymph nodes,
spleen, and bone marrow.
 Flow Cytometry has been used since
the late 1970's to diagnose and
classify human lymphomas.
 A standard panel of fluorescent
labeled monoclonal antibodies is used
for this purpose.
Fluorescence-Activated Cell Sorting (FACS)
v
laser PMT
Mixture of
cells to be
sorted
New
drop empty drop
+
+
+
+
+
+
+
+
+
_
_
_
_
_
_
_
_
+
+
+
_
_
_
FACS: a specialized type of flow cytometry to sort a
heterogeneous mixture of cell suspension
Features
• Sort up to 4 populations of interests
• 15 fluorescence color simultaneous on the same
cell
• Sort different types cells
o Primary BM, PBMC, mouse splenocytes
o Any types of cell lines
o Large fragile cells like activated neutrophiles, lung
DCs
o Sticky and hard to sort cells (e.g. solid tumor cells,
neuron cells)
• Multi-purpose sorting
o 7ml round bottom tube, 15ml conical tubes.
o Tissue culture plates, 96 well PCR plates
o Microscope slides including multiwell chamber slides
o Single cell sorting
o Different modes to maximize sort purity (99% for
qPCR) or recovery (for assays requiring large
number of cells
• sterile sorting, sample agitation, temperature
nozzl
e
CONCLUSION
Flow cytometry is a powerful technique forcorrelating
multiplecharacteristics on singlecells. This qualitative
and quantitative technique has made the transition
from a research tool to standard clinicaltesting.
Each instrument sub system –Fluidics, optics ,electronics
play critical role in accuracy of data that is collected
Smaller, less expensive instruments and anincreasing
number of clinically useful antibodies are creating
more opportunities for routine clinical laboratories to
use flow cytometry in thediagnosis and management
of disease

flow cytometry in transfusion medicine use

  • 1.
  • 2.
    Outline  History  Basicsof Flow  Def  Fluidics  Optics  Electronics  Data analysis  Application
  • 3.
    Historical Highlights  Flowcytometry was initially conceived as a practical methodology to count blood cells.  In 1879 Lord Rayleigh observed that fluid emerging from an orifice breaks into a series of droplets. Cell sorting is based on the physics of droplet formation.  In 1934, A. Moldavan reported the development of the first device that could count red blood cells automatically while in flow. (Science. 1934 Aug 24;80(2069):188-9 PHOTO-ELECTRIC TECHNIQUE FOR THE COUNTING OF MICROSCOPICAL CELLS)  In 1949, Wallace Coulter filed a patent entitled, “Means for Counting Particles Suspended in a Fluid”. The patent was issued in 1953. This lead to the development of the “Model A” Coulter Counter. Today, clinical hematology laboratory instruments used to count blood cells employ the principles developed by Coulter.
  • 4.
     In 1965,Mack J. Fulwyler reported the first flow cytometry instrument capable of sorting cells. He sorted cells based on their Coulter volume by using a Coulter cell sizing instrument and modifying the electrostatic ink jet droplet deflection technique developed by Richard G. Sweet. (Rev. Sci. Instrum. 36, 131 (1965); http://dx.doi.org/10.1063/1.1719502 High Frequency Recording with Electrostatically Deflected Ink Jets)  In 1968 Wolfgang Göhde designed a fluorescence based flow cytometer (ICPII) in 1968 which was commercialized by Partec in 1969. In 2000 he turned his efforts toward developing a program to provide low cost CD4 tests for people with AIDS in Africa.  Lou Kamentsky and Myron Melamed worked on distinguishing cancer cells from normal cells using differences in the absorption and scattering of light. Kamentsky designed the Rapid Cell Spectrophotometer (RCS), which measured nucleic acid content and cell size.  Leonard Herzenberg, an immunologist at Stanford, used the RCS prototype realizing how useful this technology would be in cell biology, He coined the term ‘FACS’ – Fluorescence Activated Cell Sorter. Becton Dickinson (BD) owns the FACS trade name and launched the first commercial instrument, FACS-1 in the early 1970’s.  Today, flow cytometers with 5 lasers capable of analyzing or sorting cells labeled with 18 fluorochromes is possible. Soon instruments capable of 50 parameters may be possible.
  • 5.
    What Is FlowCytometry?  Flow ~ motion  Cyto ~ cell  Metry ~ measure
  • 6.
    Flow Cytometry Background A system that integrates electronics, fluidics, optics, laser technology and computer analysis in a single platform.  Allows for simultaneous multiparametric analysis of physical/chemical/biological characteristics of cells or particles at the single-cell level by detecting fluorescence intensity as they travel in suspension one by one past a sensing point Flow chamber and fluidics Emission light Optical components Detectors/amplifiers (PMT) Digital (computer/software) Excitation light Lasers Mixed cells with fluorescence label
  • 7.
    Optics Fluidics Electronics Mechanics of aFlow Cytometer • Cells in suspension are brought in single file past • a focused laser where they scatter light and emit fluorescence that is filtered and collected • then converted to digitized values that are stored in a file for analysis
  • 8.
    The Fluidics System “Cellsin suspension flow single file”  Cells must flow one-by-one into the cytometer to do single cell analysis  Accomplished through a pressurized laminar flow system.  The sample is injected into a sheath fluid as it passes through a small orifice (50um-300um)
  • 9.
    Hydrodynamic Systems Sample in Sheath Sheathin Laser beam Piezoelectric crystal oscillator Fluorescence Sensors Scatter Sensor Core Sheath Signal direction Flow Chamber
  • 10.
    10 psi 10.2 psi 10psi 10.4 psi 10 psi 10.8 psi • Difference in pressure between sample and sheath • This will control sample volume flow rate • The greater the differential, the wider the sample core. • If differential is too large, cells will no longer line up single file • Results in wider CV’s and increase in multiple cells passin through the laser at once » » » Faster cell analysis BUT lo Fluidics- Sample Differential
  • 11.
    Hydrodynamic Focusing V. Kachel, H.Fellner-Feldegg & E. Menke - MLM Chapt. 3 Notice how the ink is focused into a tight stream as it is drawn into the tube under laminar flow conditions. PBS/Sheath Sample/cells/core Laminar flow Hydrodynamic Focusing Laminar flow occurs when a fluid flows in parallel layers, with no disruption between the layers
  • 12.
    Incoming Laser Sample Sheath Sheath Sample Core Stream Low DifferentialHigh Differential or “turbulent flow Laser Focal Point
  • 13.
    Sample Preparation Samples mustbe in single cell suspension Solid tissue requires mechanical dissociation and often enzymatic digestion Adherent cell lines require detachment from the culture dish and dissociation Cell aggregates must be filtered out Red cells should be lysed Well prepared single cell suspensions yield good data
  • 14.
    Common specimens suitablefor flow cytometry analysis include Peripheral blood, Bone marrow, Body fluids, Cerebrospinal fluid, Urine, Lymph node (cells or freshtissues), Any fine-needleaspirates, Fresh tissues suspicious for hematopoietic and lymphoiddisorders.
  • 15.
    Interrogation  Light sourceneeds to be focused on the same point where cells are focused.  Light source 99%=Lasers
  • 16.
    Lasers Light amplification bystimulated emission of radiation  Lasers provide a single wavelength of light (monochromatic)  They can provide milliwatts to watts of power  Low divergence  Provide coherent light  Gas, dye, or solid state Coherent: all emiting photons have same wavelength, phase and direction as stimulation photons
  • 17.
    Light collection  Collectedphotons are the product of laser light scattering or bouncing off cells  488nm  Information associated with physical attributes of cells (size, granularity, refractive index) Scatter Fluorescence VS  Collected photons are product of excitation with subsequent emission determined by fluorophore  350nm-800nm  Readout of intrinsic (autofluorescence) or extrinsic fluorescence (intentional cell labeling)
  • 18.
    Colors  488 nmwavelength is the most commonly used type of laser in Flow Cytometers  Many 5 laser instruments have these additional lasers ◦ 355 nm UV ◦ 405 nm Violet ◦ 640 nm Red ◦ 561 nm Yellow-Green http://antonine-education.co.uk/
  • 19.
    Forward Scatter FSC Detector Laser Beam Originalfrom Purdue University Cytometry Laboratories
  • 20.
    Different size cells Particleor cell size (log scale) FSC Number of events small large 0.1 1 10 100 1000 0.9 20 90 200 700 While forward light scatter is not always related to cell size, in The majority of cases between 1-20 microns, it is a reasonable estimate
  • 21.
  • 22.
    Side Scatter Laser lightthat is scattered at 90 degrees to the axis of the laser path is detected in the Side Scatter Channel The intensity of this signal is proportional to the amount of cytosolic structure in the cell (eg. granules, cell inclusions, drug delivery nanoparticles.) Side Scatter=SSC=RALS=90 degree Scatter
  • 23.
    Why Look atFSC v. SSC  Since FSC ~ size and SSC ~ internal structure, a correlated measurement between them can allow for differentiation of cell types in a heterogenous cell population FSC SSC Lymphocytes Monocytes Granulocytes RBCs, Debris, Dead Cells LIVE Dead
  • 27.
    Optics- Filters  Differentwavelengths of light are scattered simultaneously from a cell Need to split the light into its specific wavelengths in order to measure and quantify them independently. This is done with filters  Optical filters are designed such that they absorb or reflect some wavelengths of light, while transmitting others  3 types of filters Long Pass Short Pass Band Pass Dichroic
  • 28.
  • 29.
    Optics- Dichroic Filters Long pass or short pass filters  Placed at a 45º angle of incidence  Part of the light reflected at 90º , and part of the light is transmitted and continues on. Dichroic Filter Detector 1 Detector 2
  • 30.
  • 31.
     Highly specificmonoclonal antibodies are usedthat are produced by cloned antibody secreting cells.  Antibodies are based on cluster of differentiation (CD)- a protocol used for identification anddistinction of cell surface antigens.  Using CD system wecan identify cells by the presence or absence of particular surface markers for e.g. CD3+ or CD20- etc. ANTIBODY
  • 32.
    FLUOROCHROMES Fluorochromes are substancesthat can be excited by certain light source (such as laser) and emita fluorescent signal at a single wavelength. Fluorescent dyes can directly bind to certain cellular content, such as DNA and RNA, and allow us to perform quantitative analysis on individualcells. However, in mostcases fluorochromes are conjugated with monoclonal antibodies, which specifically target cellular antigens/markers.
  • 33.
    Understanding Fluoroscence The fluorescent moleculeis excited by the excitation source (laser). This imparts energy to electrons in the molecule which in then released as the molecule relaxes. The energy is released as light. e- Excited Resting e- e- e- e- state Mechanism of Fluorscence
  • 34.
    Fluorescence Detection  Fluorochromeson the cell surface or inside the cell are excited by the laser beam as the cell passes the interrogation point.  These fluorochromes then release energy as they leave their excited state.  The energy release is in the form of a photon with a specific wavelength, longer than the excitation wavelength.  These photons of light are steered and collected by optical lens and filters at specific wavelengths.
  • 35.
    Characteristics of fluorochromescommonly used in flow cytometry. FLUOROCHROMES CONJUGATED TO ANTIBODIES EXCITATION WAVELENGTH(NM) EMISSIONWAVELENGTH(NM) Fluorescein isothiocyanate(FITC) 488 530 Phycoerythrin (PE) 488 580 PE-Texas Red 488 615 PE-Cy5 488 670 Peridinin chlorophylprotein(PerCP) 488 670 Allophycocyanin (APC) 633 670 APC-Cy7 633 767 Interestingly, although some of them can be excited by the same light source, the different fluorochromes may emit fluorescent signals with different wavelengths/colors. Thus, multiple fluorochromes can be simultaneouslyexcited bya light source and detected by their emission fluorescent signals with different wavelengths, respectively.
  • 36.
    How do Ichoose my Fluorochromes ? • Antibody availability • Fluorochrome brightness • Excitation source • Emission filters • Other fluorochromes/ Signals present in my sample (spectral overlap)
  • 37.
    Electronics  Detectors basicallycollect photons of light and convert them to an electrical current  The “electronics” process light signal and convert the current to a digitized value that computer can graph
  • 38.
    Detectors  There aretwo main types of photo detectors used in flow cytometry Photodiodes  Used for strong signals, when saturation is a potential problem (eg. FSC detector) Photomultiplier tubes (PMT)  Used for detecting small amounts of fluorescence emitted from fluorochromes.  Incredible Gain (amplification-up to 10million times)  Low noise
  • 39.
    • Fluorescent emissionsare detected as a voltage pulse from photomultiplier tube (PMT) detectors • The area, voltage and height of the voltage pulse is measured Voltage Laser Laser Laser time time time Voltage Voltage 1. 2. 3. Flow Cytometry: Signal Conversion in PMT Photon  Current  Voltage  Digital Signal
  • 41.
    Forward light scatter(FSC) and side light scatter (SSC) . FSC collects light at 180° from the point at which the laser beam intersects the cells .It is correlated with cell size.and thus can distinguish normal lymphocytes (small), monocytes (intermediate), and neoplastic cells (generally they are large in size). SSC collects right-angle light at 90° and is correlated with cytoplasmic granularity and nuclearconfiguration.  The combination of both FSC and SSC can distinguish normal lymphocytes, granulocytes, and monocytes.  The detection of lymphocytes and monocytes provides a reliable internal control to evaluate the size of the cells of interest. Basic parameters and Windows of cell population
  • 42.
    CD45 & SSC •As the first step, it is most important todeterminewhetherthecells of interest arehematopoietic. • Generally speaking, all hematopoietic/lymphoid cells express CD45 antigens (CD45+). • Thus, a histogramof CD45 on a logarithmicscalevs. SSC on a linear scale is indispensableasa starting pointof flow cytometryanalysis. • Based onantigenexpression, cells aredivided into CD45+ and CD45– groups. • Among the CD45+ group, the cells can further separated into subgroups based on expression levelsof CD45 and intensity of cytoplasmicgranularity.
  • 43.
    Compensation  Fluorochromes typicallyfluoresce over a large part of the spectrum (100nm or more)  A detector may “see” fluorescence from more than one fluorochrome. (referred to as bleed over)  You need to “compensate” for this bleed over so that ONE detector reports signal from only ONE fluorochrome
  • 45.
    Histograms Flow cytometry datacan be plotted in several different ways: • the axes of the graphs represent fluorescence intensity data, usually plotted on a log scale • for histograms, the y axis is cell number Flow Cytometry: Data Analysis
  • 46.
     By celldistribution in the CD45vs. SSC. This is most useful in a specimen containing mixed cell populations . Thegrouped cells in individual windows represent different celllineages.  By cell size: In FSC vs. SSC histograms, neoplastic cells (usually large in size) can be gated by using lymphocytes (small) and monocytes (intermediate) as an internal size control . Once thecells of interest aregated, furtheranalysis of cell lineage can be performed.  By cell lineage-specific antigens (immunophenotype) : If cells are CD45+ but do not fit into particular windows in the CD45 vs. SSC histogram, identification of lineage- specific antigen expression is needed Types of Gating
  • 47.
    APPLICATION Applications in ClinicalLaboratories  Immunophenotyping (HIV)  CD4 absolute counts  Leukemia and lymphoma immunophenotyping  Cell cycle and ploidy analysis of tumors  Reticulocyte enumeration  Flow cross-matching (organ transplantation)  Stem cell enumeration  Residual white blood cell detection  (QC platelet, red blood cells)
  • 48.
    Applications in BloodBanking  Fetomaternal Hemorrhage Testing  Flow in AIHA Associated with a Negative DAT  HLA Antibody Detection  CD34+ cell enumeration and viability  Platelet receptor defects (Bernard Soulier sndrome and Glanzmann )  Storage lesion studies  Pretransfusion compatibility testing
  • 49.
    Platelet analysis byflow…  Identification of inherited disorders  Monitoring of anti-platelet therapy  Monitoring of clinical course of disease  Monitoring of platelet production in thrombocytopenia  Identification of patients at risk of thrombosis  Diagnosis of HIT
  • 50.
    APPLICATION Research Laboratories  Immunefunction studies  Hematopoietic stem cells  Multi-drug resistance studies (cancer)  Kinetics studies (cell function) Platelet analysis (coronary disease)  Environmental sample analysis  Flow and FISH
  • 51.
    APPLICATION Immunophenotyping  Is theterm used in the identification of cells by labeling with monoclonal antibodies identified as cluster designations (CD)  Used to determine Cell lineage Activation status Adhesion migration and homing capacity of cells Ability to respond to stimuli Ability to respond to stimuli
  • 52.
    Propidium iodide (PI)- Cell Viability How the assay works:  PI cannot normally cross the cell membrane  If the PI penetrates the cell membrane, it is assumed to be damaged  Cells that are brightly fluorescent with the PI are damaged or dead PI PI PI PI PI PI PI PI PI PI PI PI PI PI Viable Cell Damaged Cell
  • 53.
    Minimum Residual Disease Patients that appear to be in complete remission can be found to have residual tumors cells that are too few in number to be counted by standard techniques.  Flow cytometry can detect these rare cells before they proliferate and cause the patient to relapse.
  • 54.
    Flow Cytometric Crossmatch (FCXM) Flow cytometry has become a valuable tool to assess potential solid organ allograph recipients.  It is now recognized as the laboratory procedure of choice. Circulating alloantibodies at levels too low to be detected by standard methods can be detected by a flow cytometric crossmatch (FCXM).  This means that transplants done based on a negative FCXM are more successful.
  • 55.
    Diagnosis of PNH Conventionallaboratory tests for the diagnosis of PNH include the sugarwater testand the Ham’s acid hemolysis test . Antibodies to CD55 and CD59 are specific for decay- accelerating factor and membrane-inhibitor of reactive lysis, respectively, and can be analyzed by flow cytometry to makea definitive diagnosis of PNH.
  • 56.
    DNA studies • Theseassays involve measurements of fluoroscence associated with DNA to determine • Stage of cell cycle • Apoptosis • Gene Transfection • Chromosomal Aberrations • Endoreduplication • Doubling Time
  • 57.
    Leukemia and Lymphoma Lymphomas are tumors of the immune system, primarily in the lymph nodes, spleen, and bone marrow.  Flow Cytometry has been used since the late 1970's to diagnose and classify human lymphomas.  A standard panel of fluorescent labeled monoclonal antibodies is used for this purpose.
  • 58.
    Fluorescence-Activated Cell Sorting(FACS) v laser PMT Mixture of cells to be sorted New drop empty drop + + + + + + + + + _ _ _ _ _ _ _ _ + + + _ _ _ FACS: a specialized type of flow cytometry to sort a heterogeneous mixture of cell suspension Features • Sort up to 4 populations of interests • 15 fluorescence color simultaneous on the same cell • Sort different types cells o Primary BM, PBMC, mouse splenocytes o Any types of cell lines o Large fragile cells like activated neutrophiles, lung DCs o Sticky and hard to sort cells (e.g. solid tumor cells, neuron cells) • Multi-purpose sorting o 7ml round bottom tube, 15ml conical tubes. o Tissue culture plates, 96 well PCR plates o Microscope slides including multiwell chamber slides o Single cell sorting o Different modes to maximize sort purity (99% for qPCR) or recovery (for assays requiring large number of cells • sterile sorting, sample agitation, temperature nozzl e
  • 59.
    CONCLUSION Flow cytometry isa powerful technique forcorrelating multiplecharacteristics on singlecells. This qualitative and quantitative technique has made the transition from a research tool to standard clinicaltesting. Each instrument sub system –Fluidics, optics ,electronics play critical role in accuracy of data that is collected Smaller, less expensive instruments and anincreasing number of clinically useful antibodies are creating more opportunities for routine clinical laboratories to use flow cytometry in thediagnosis and management of disease